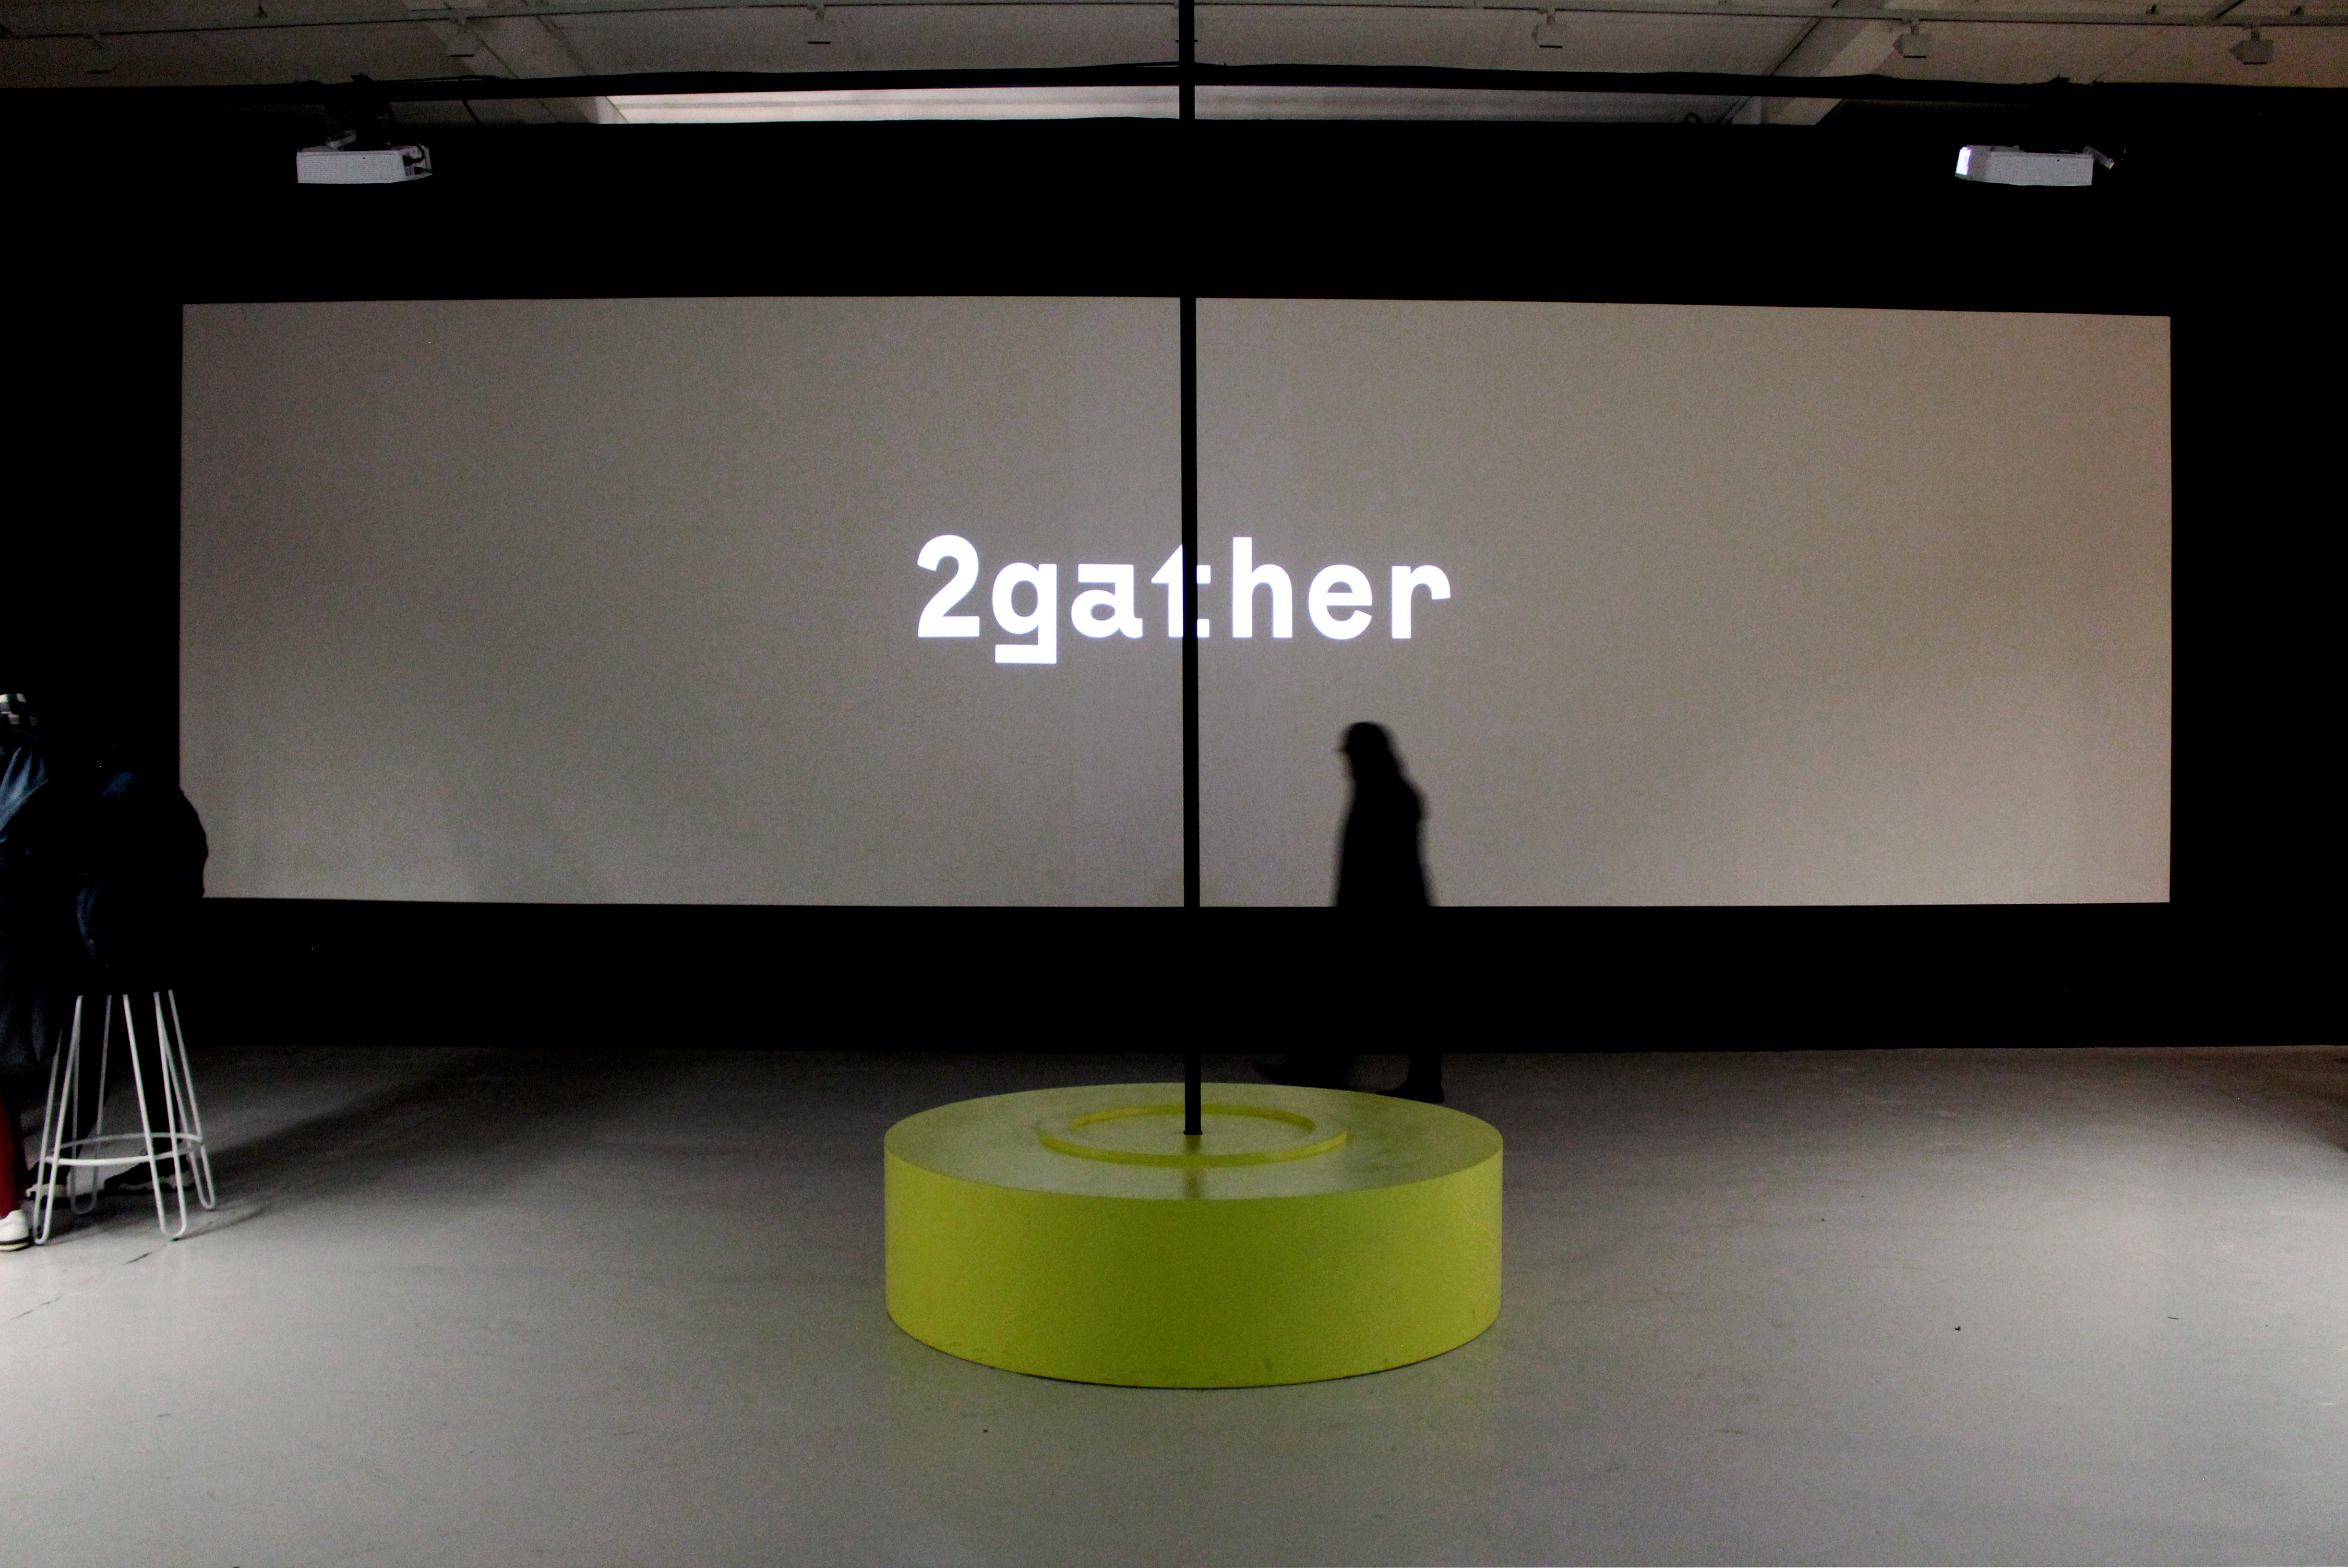
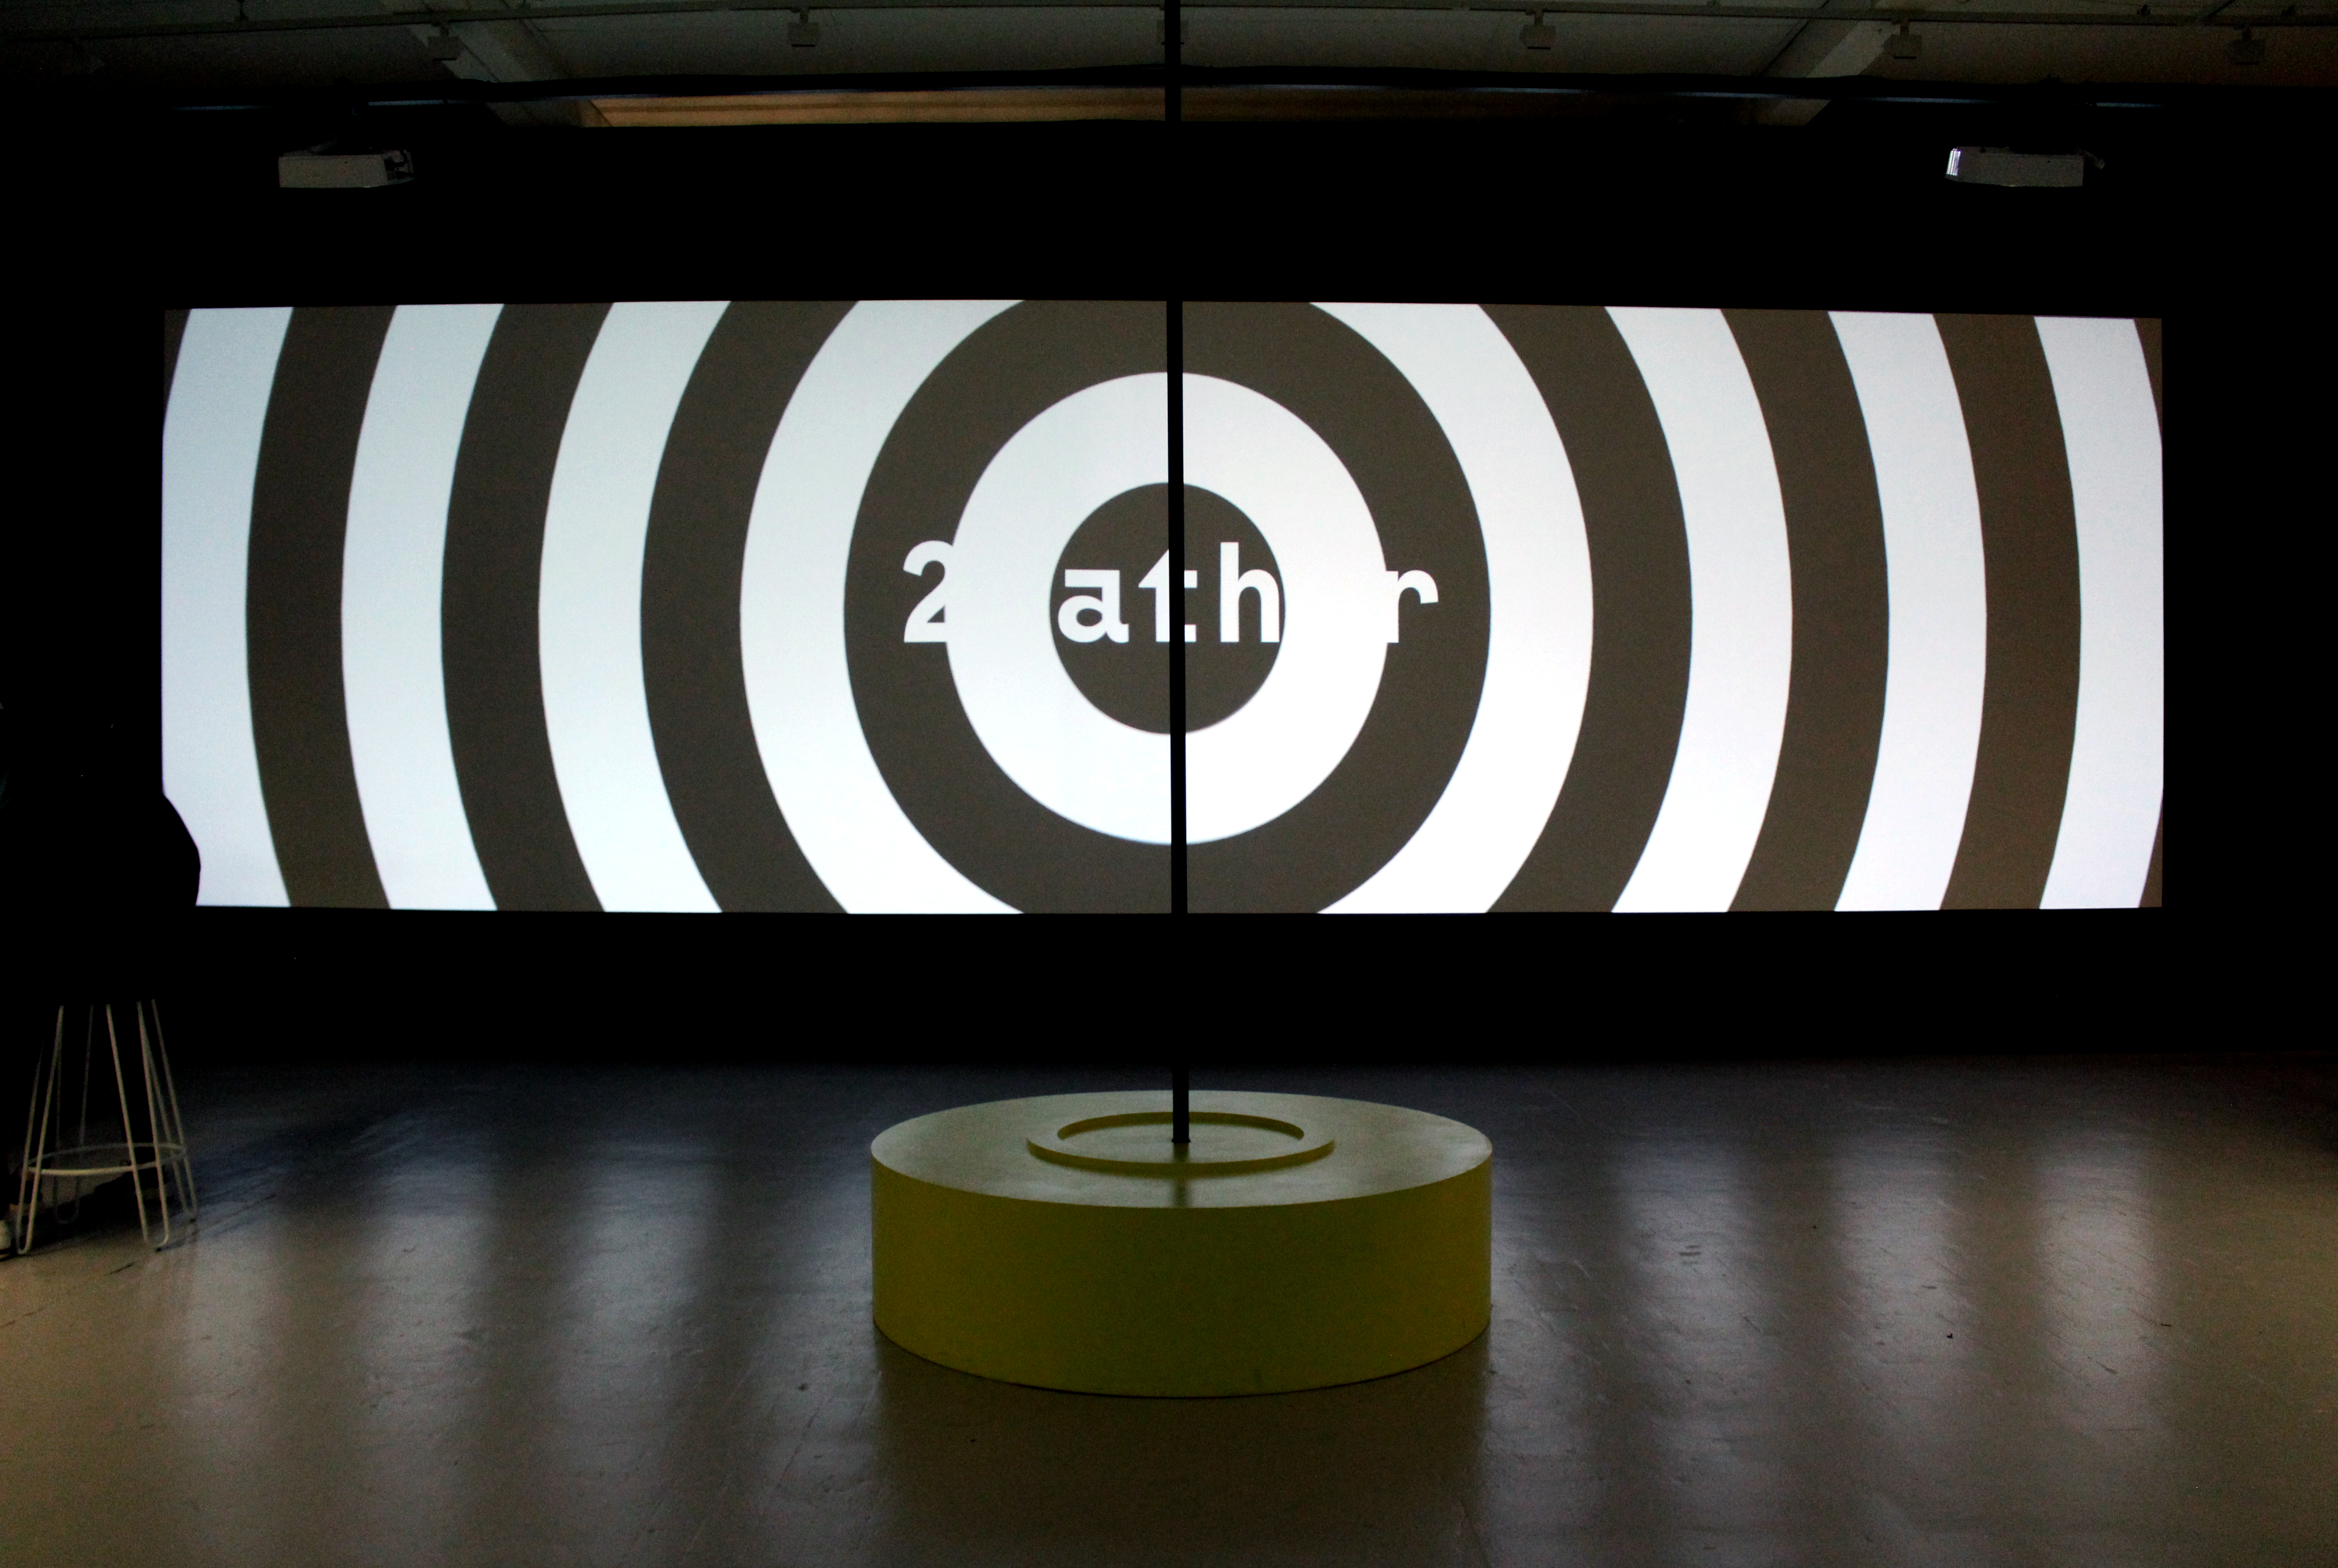
Data art installation
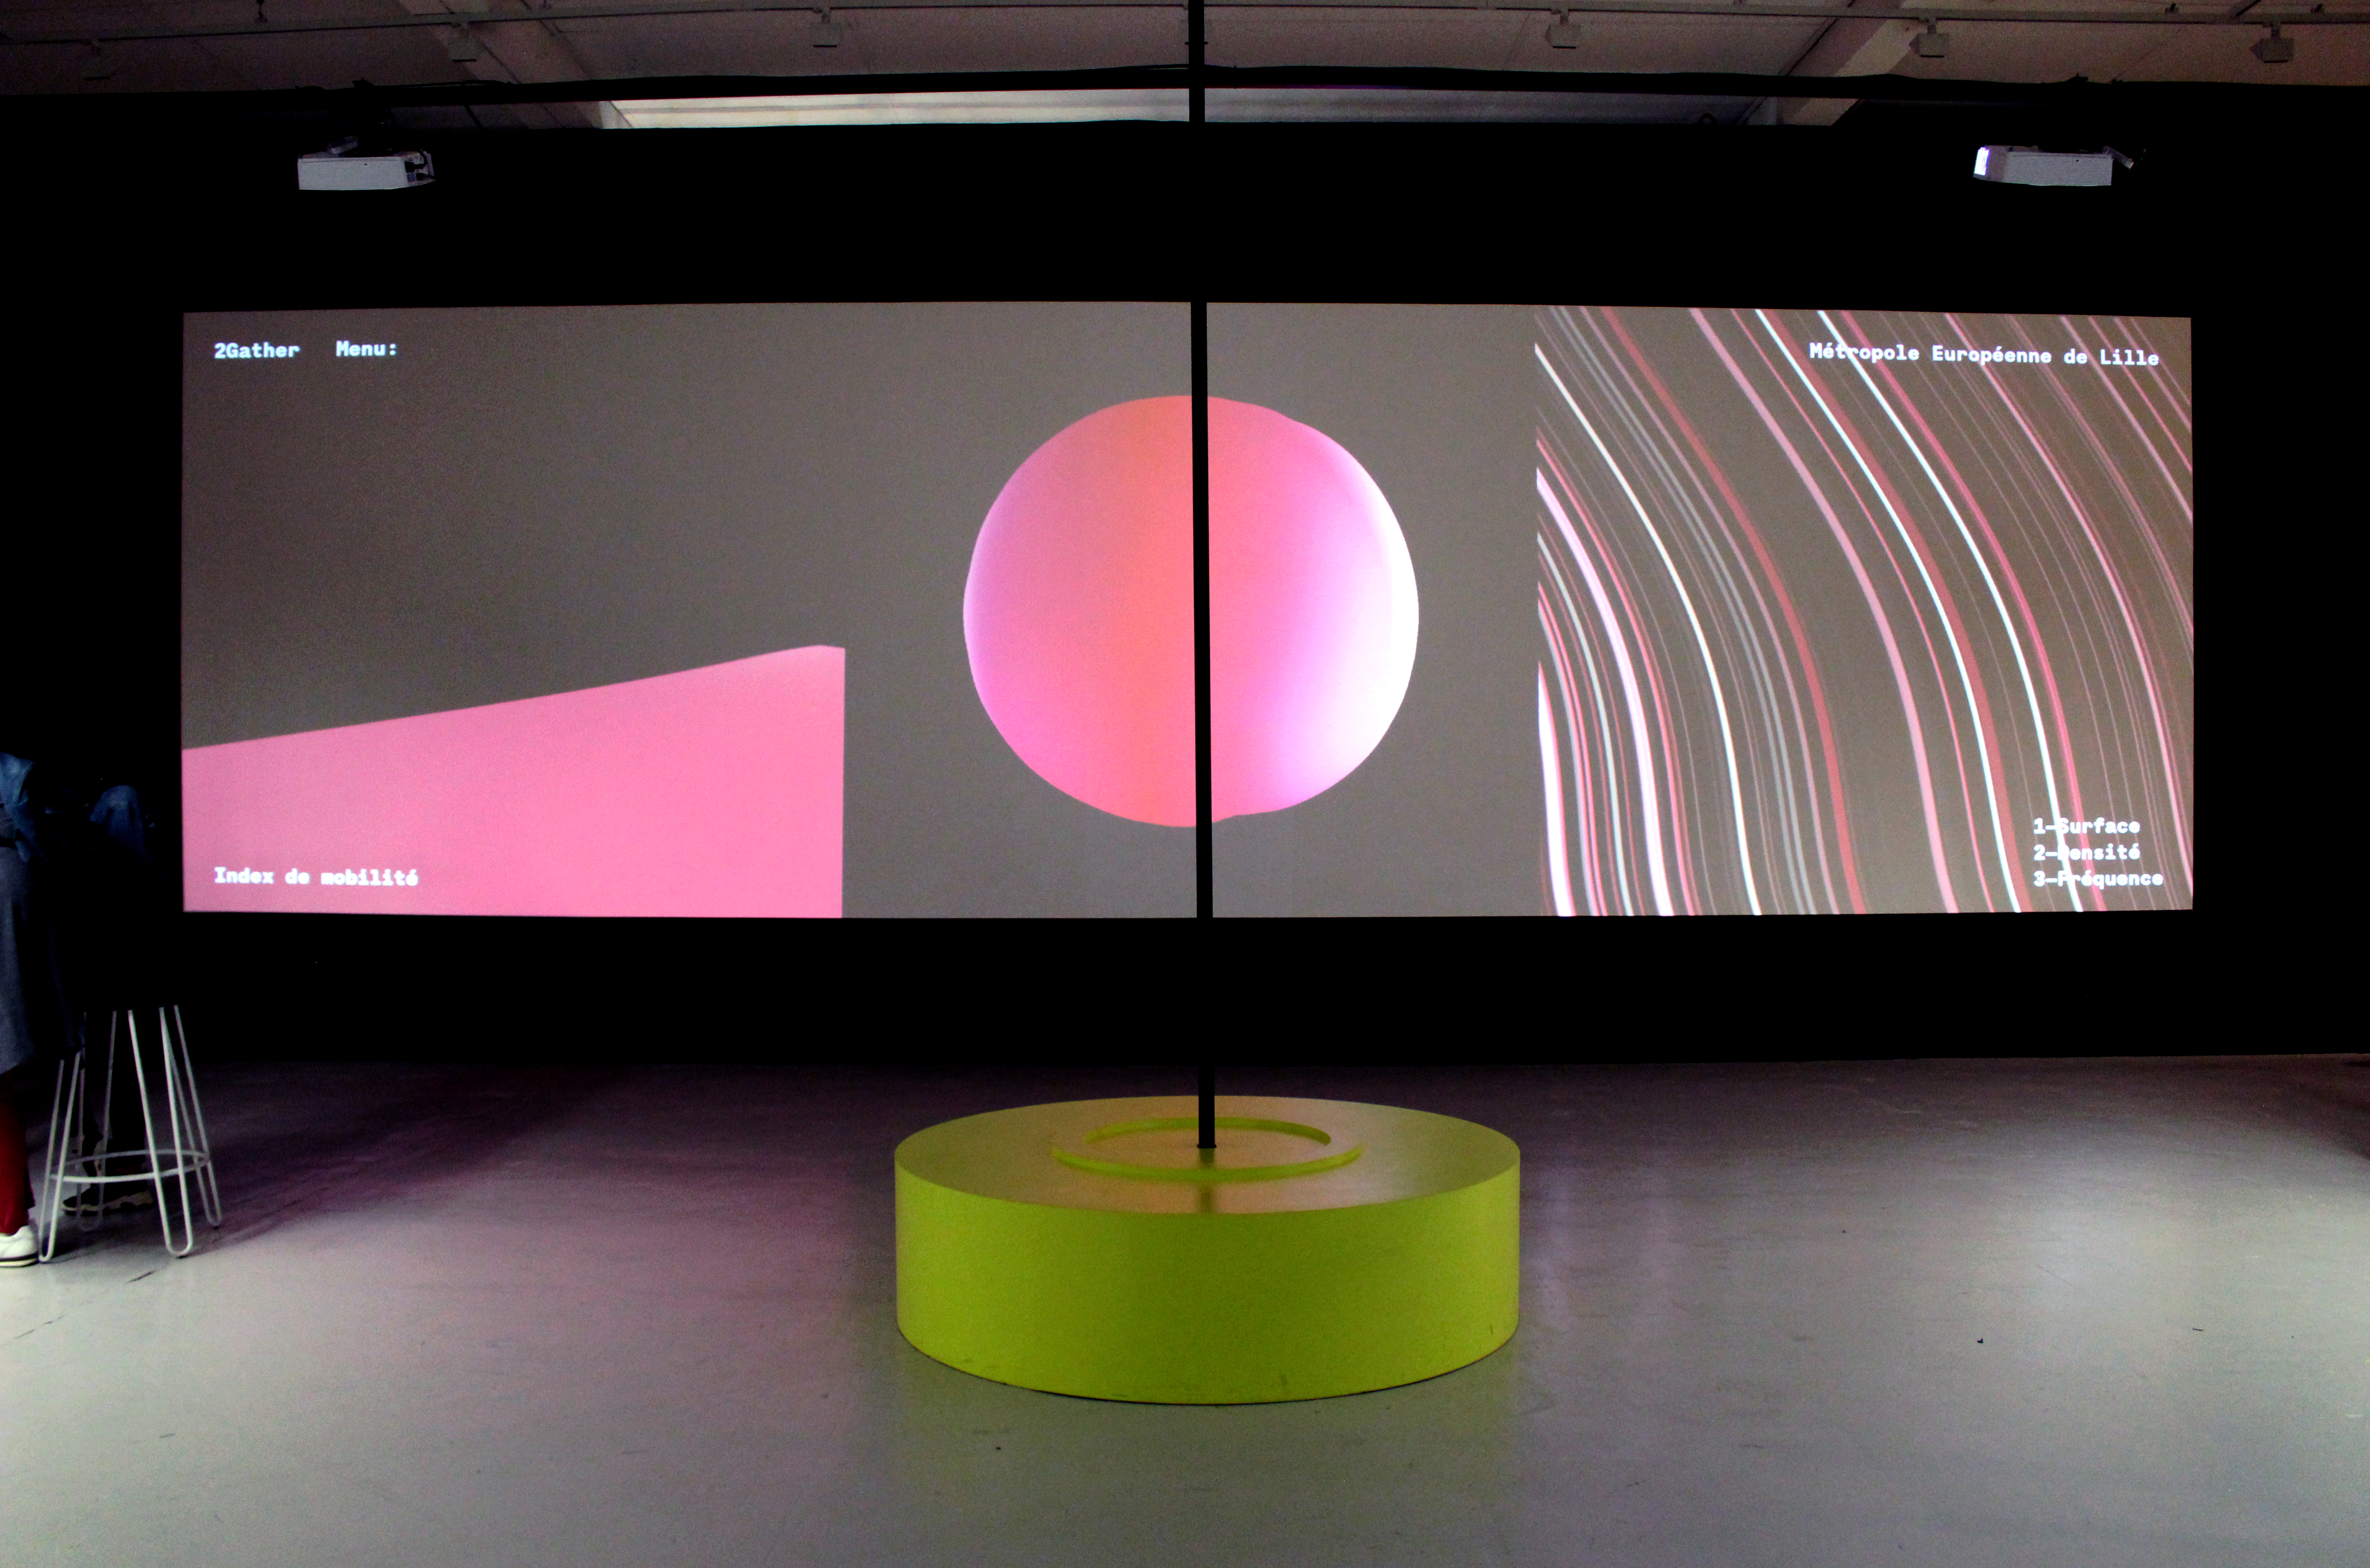
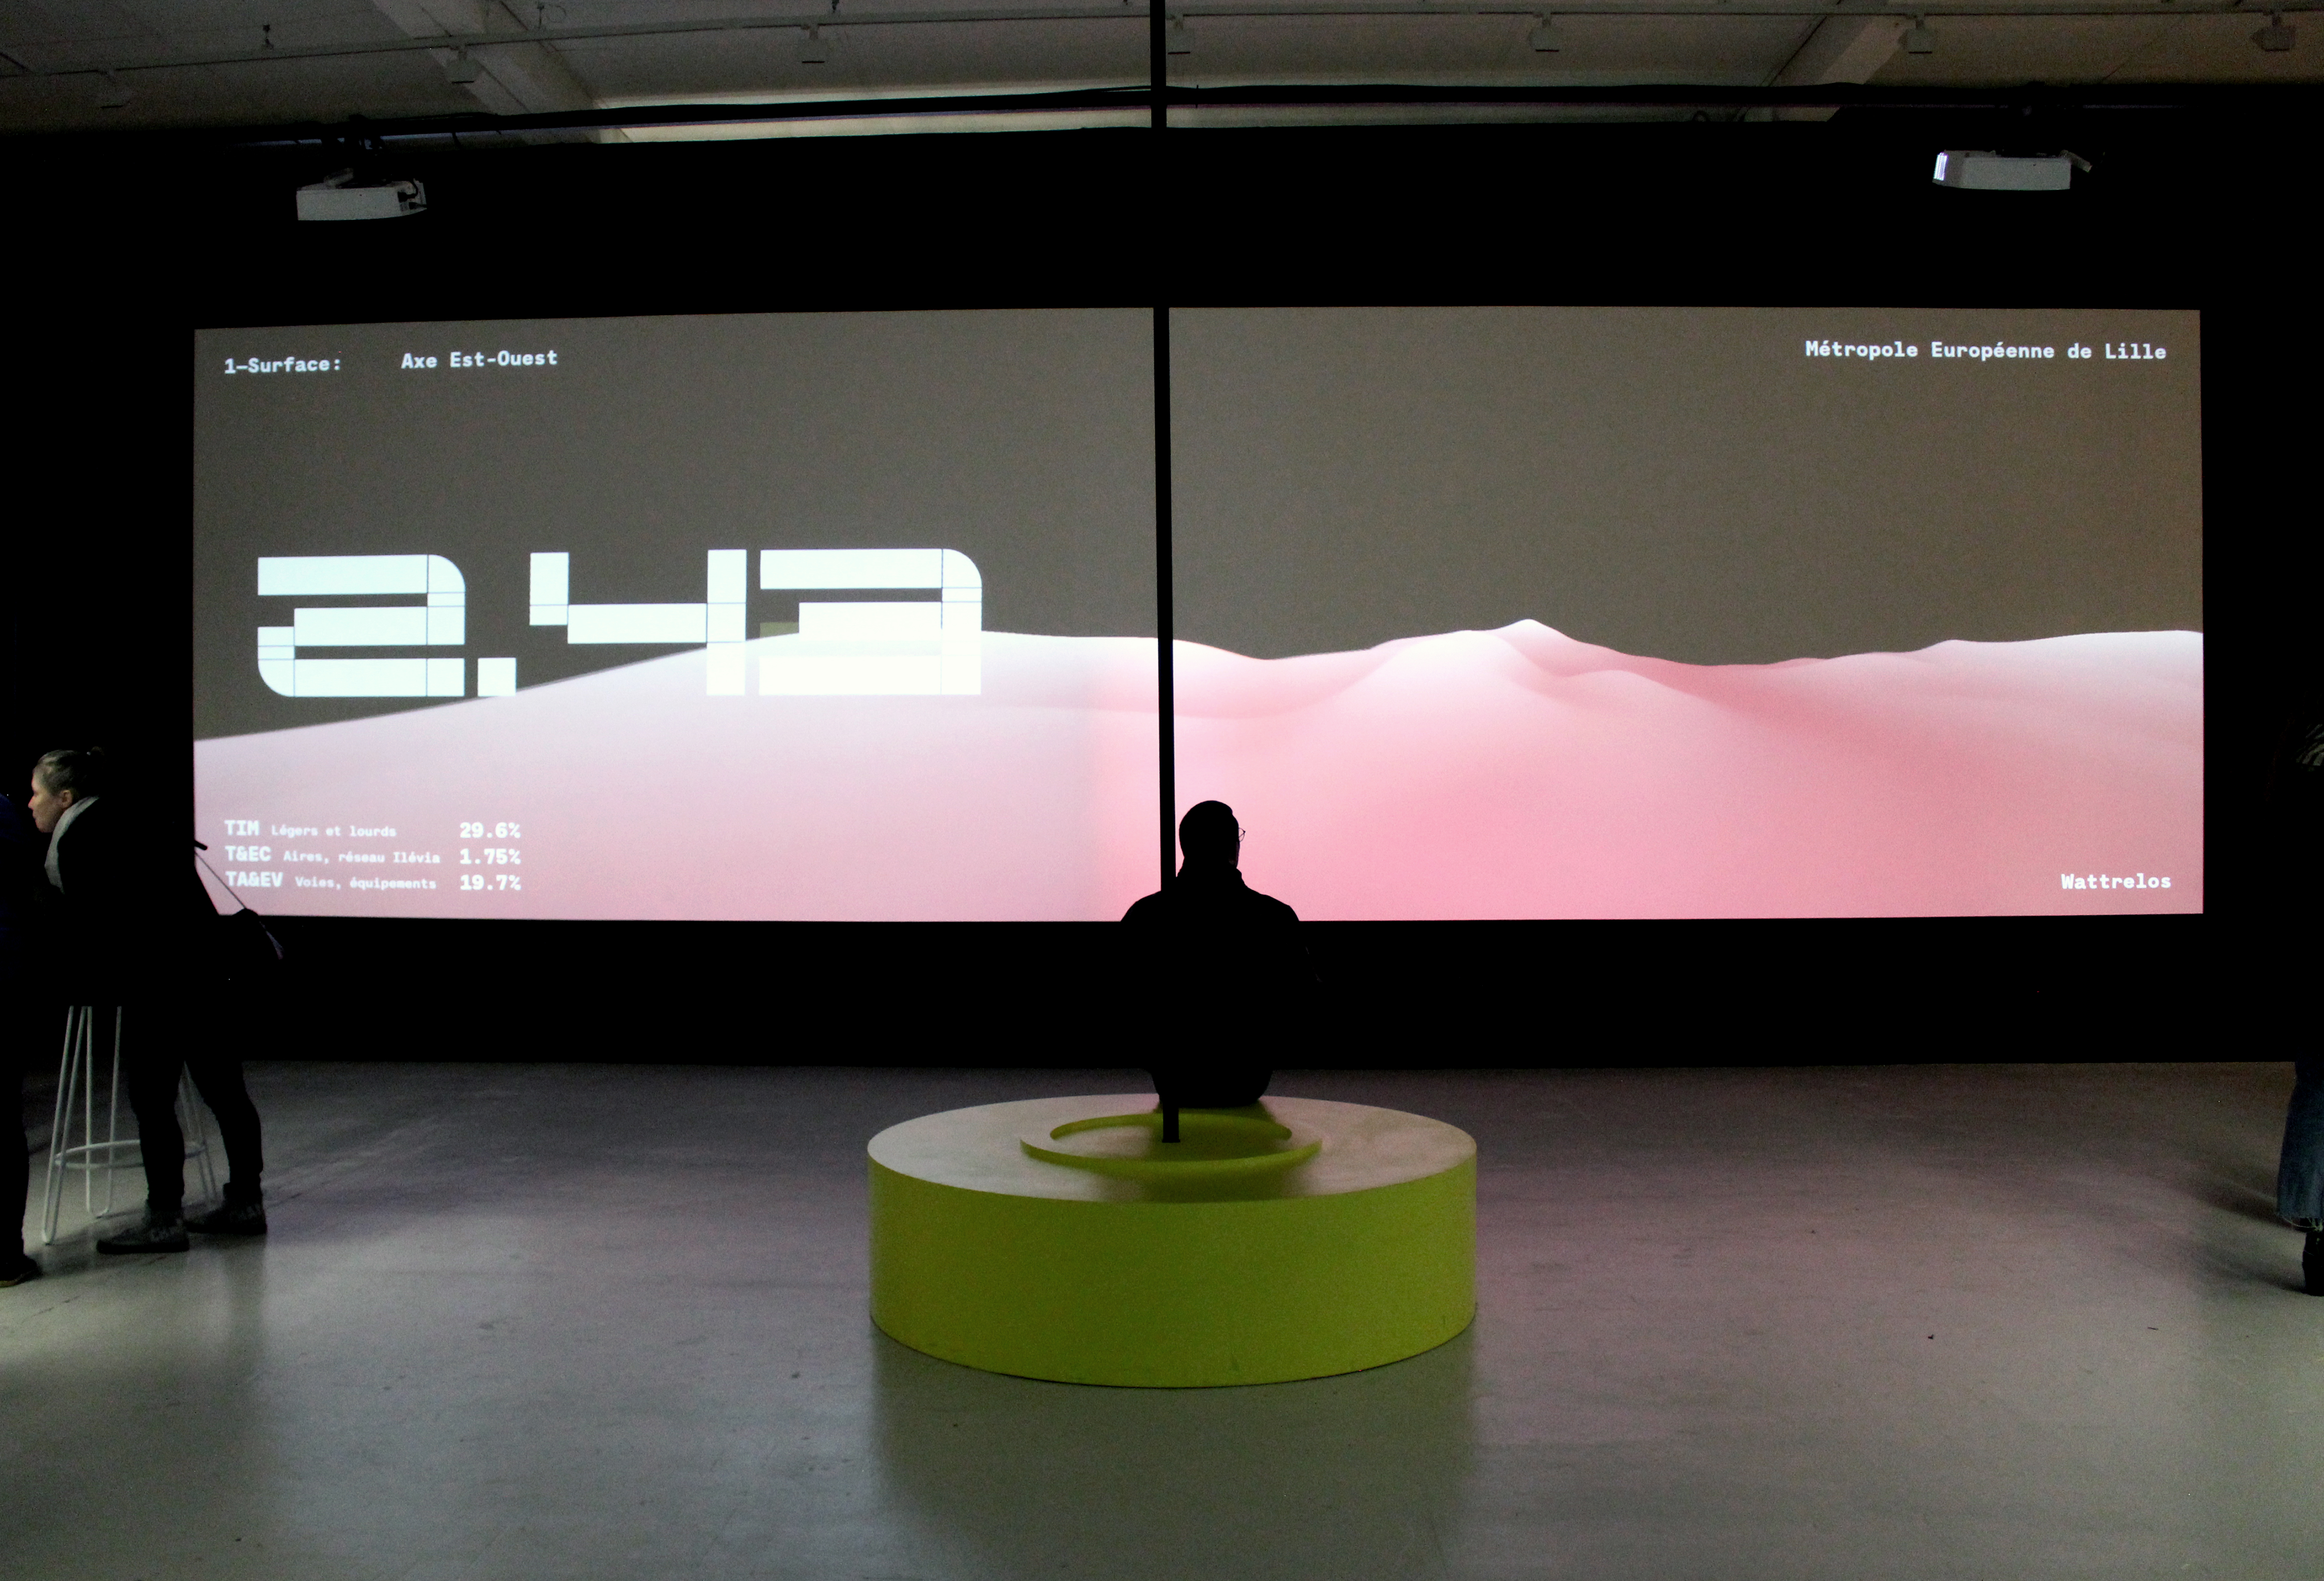
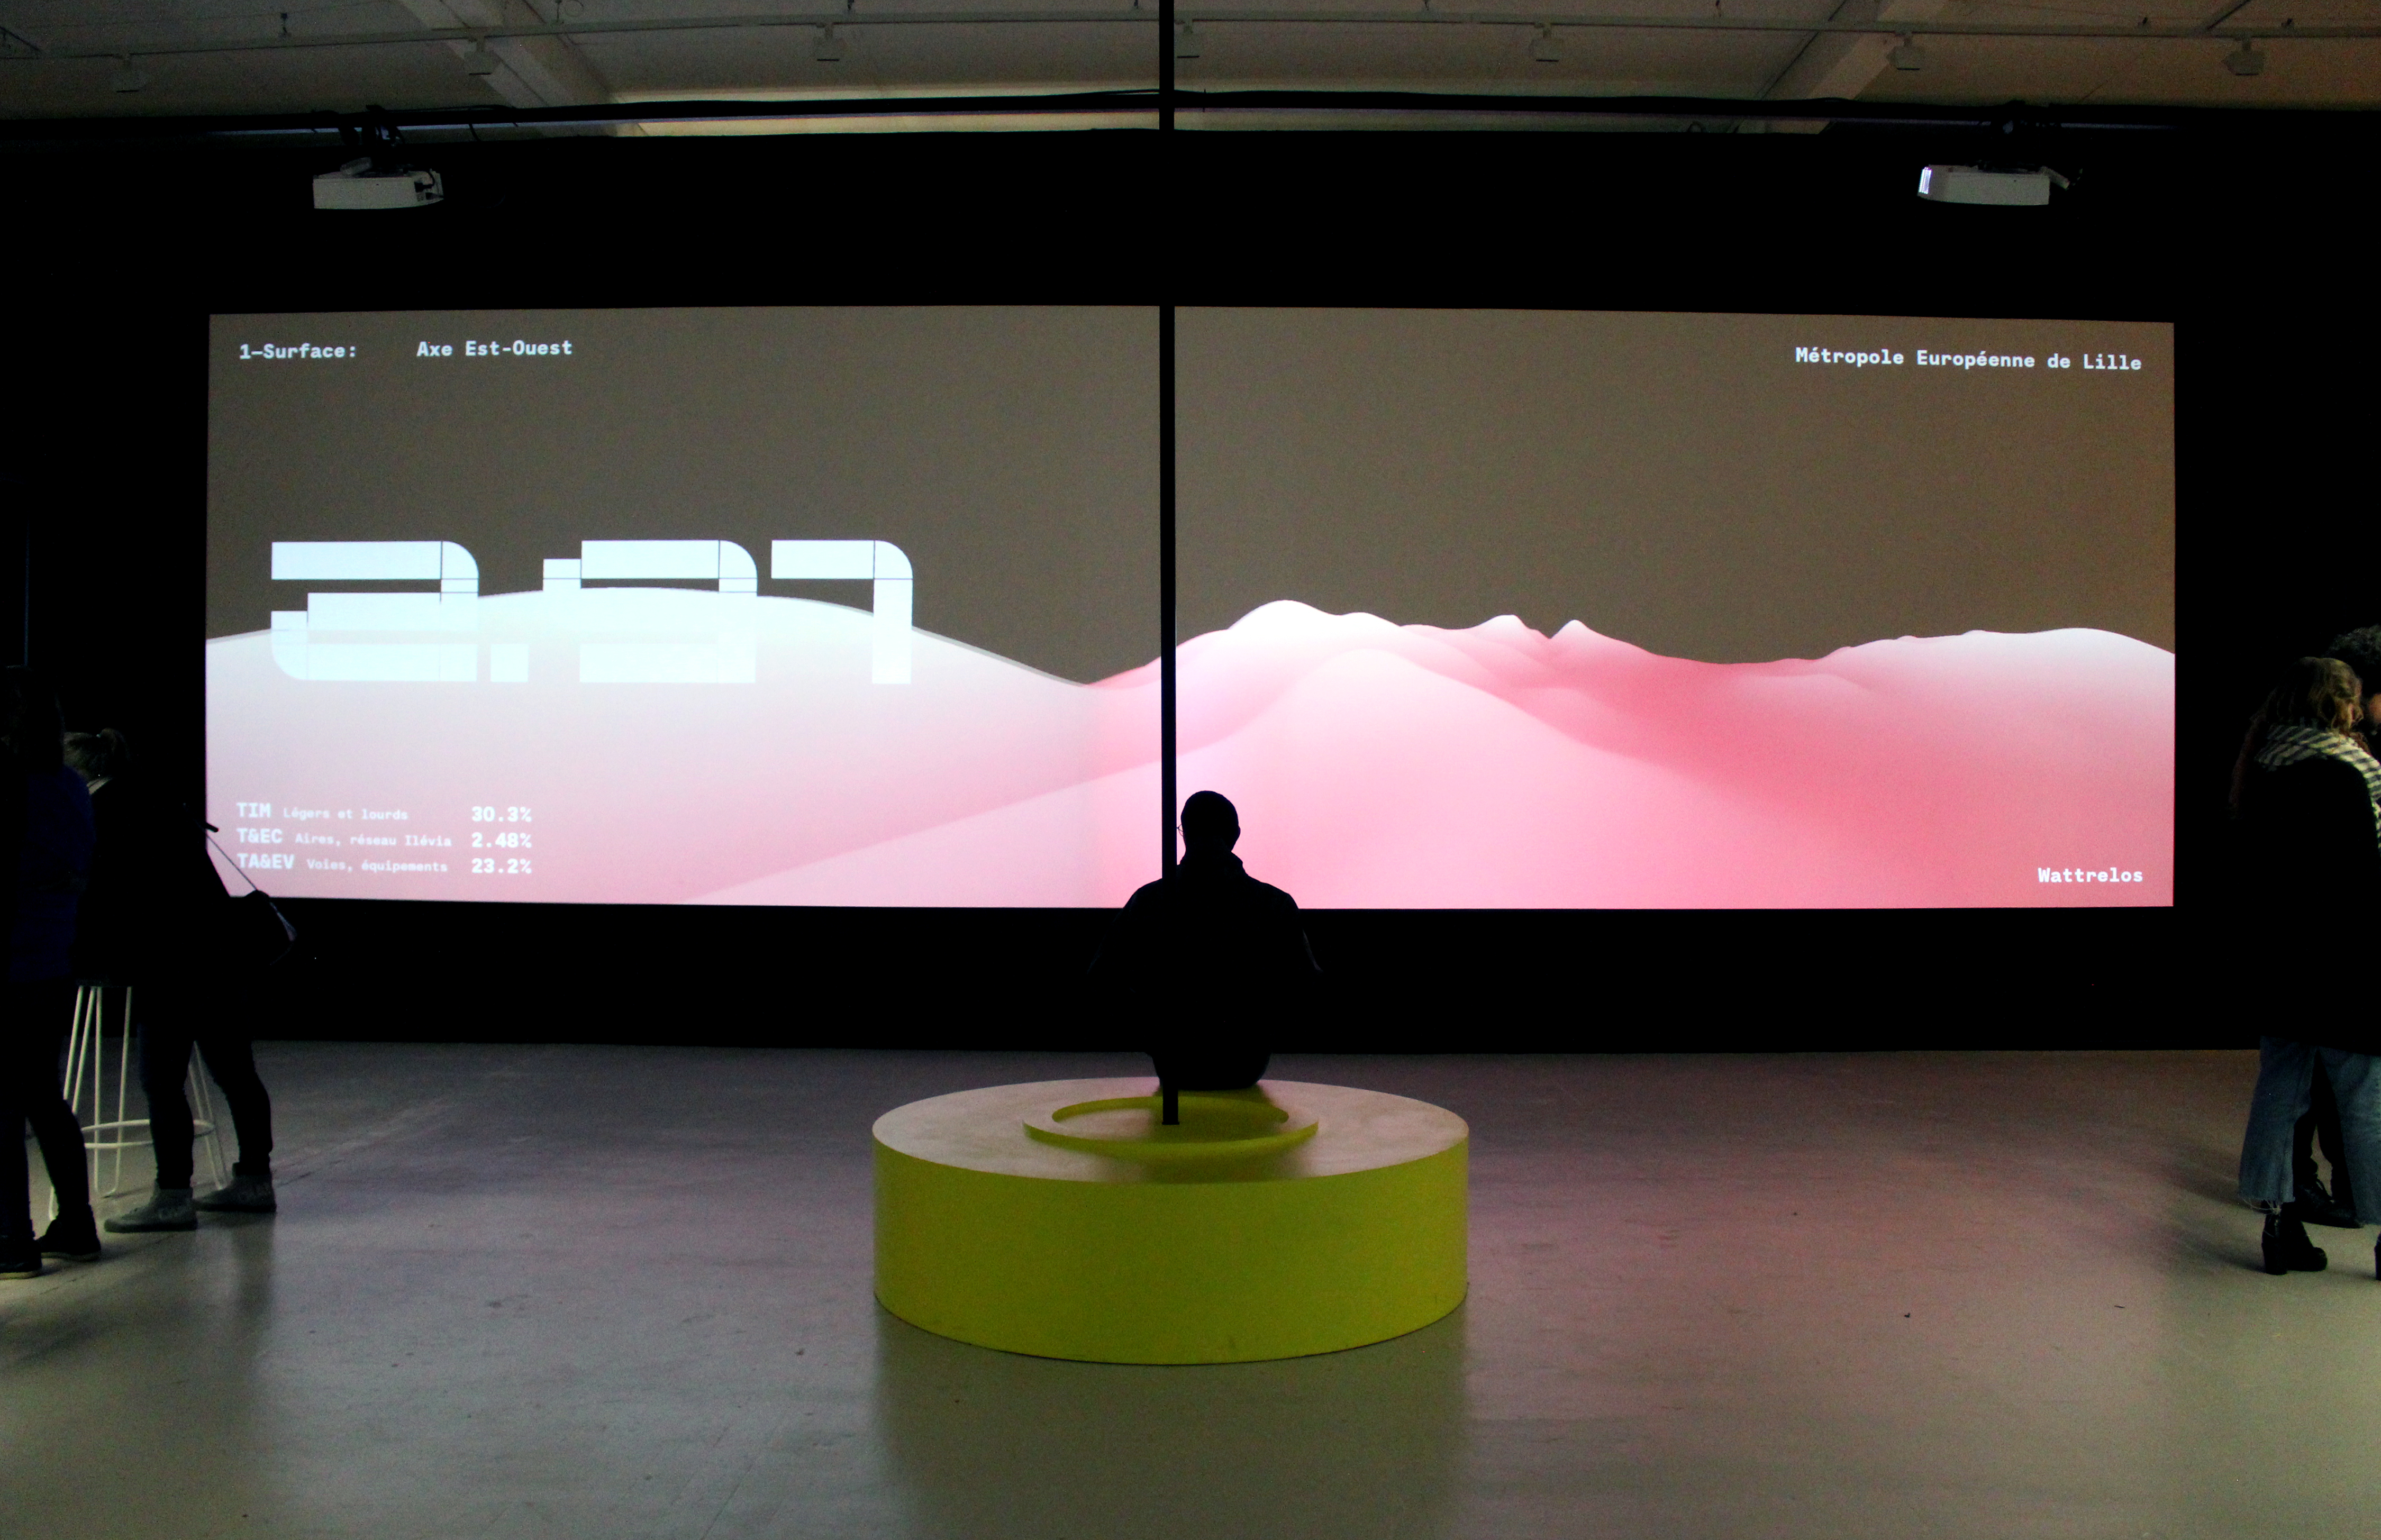
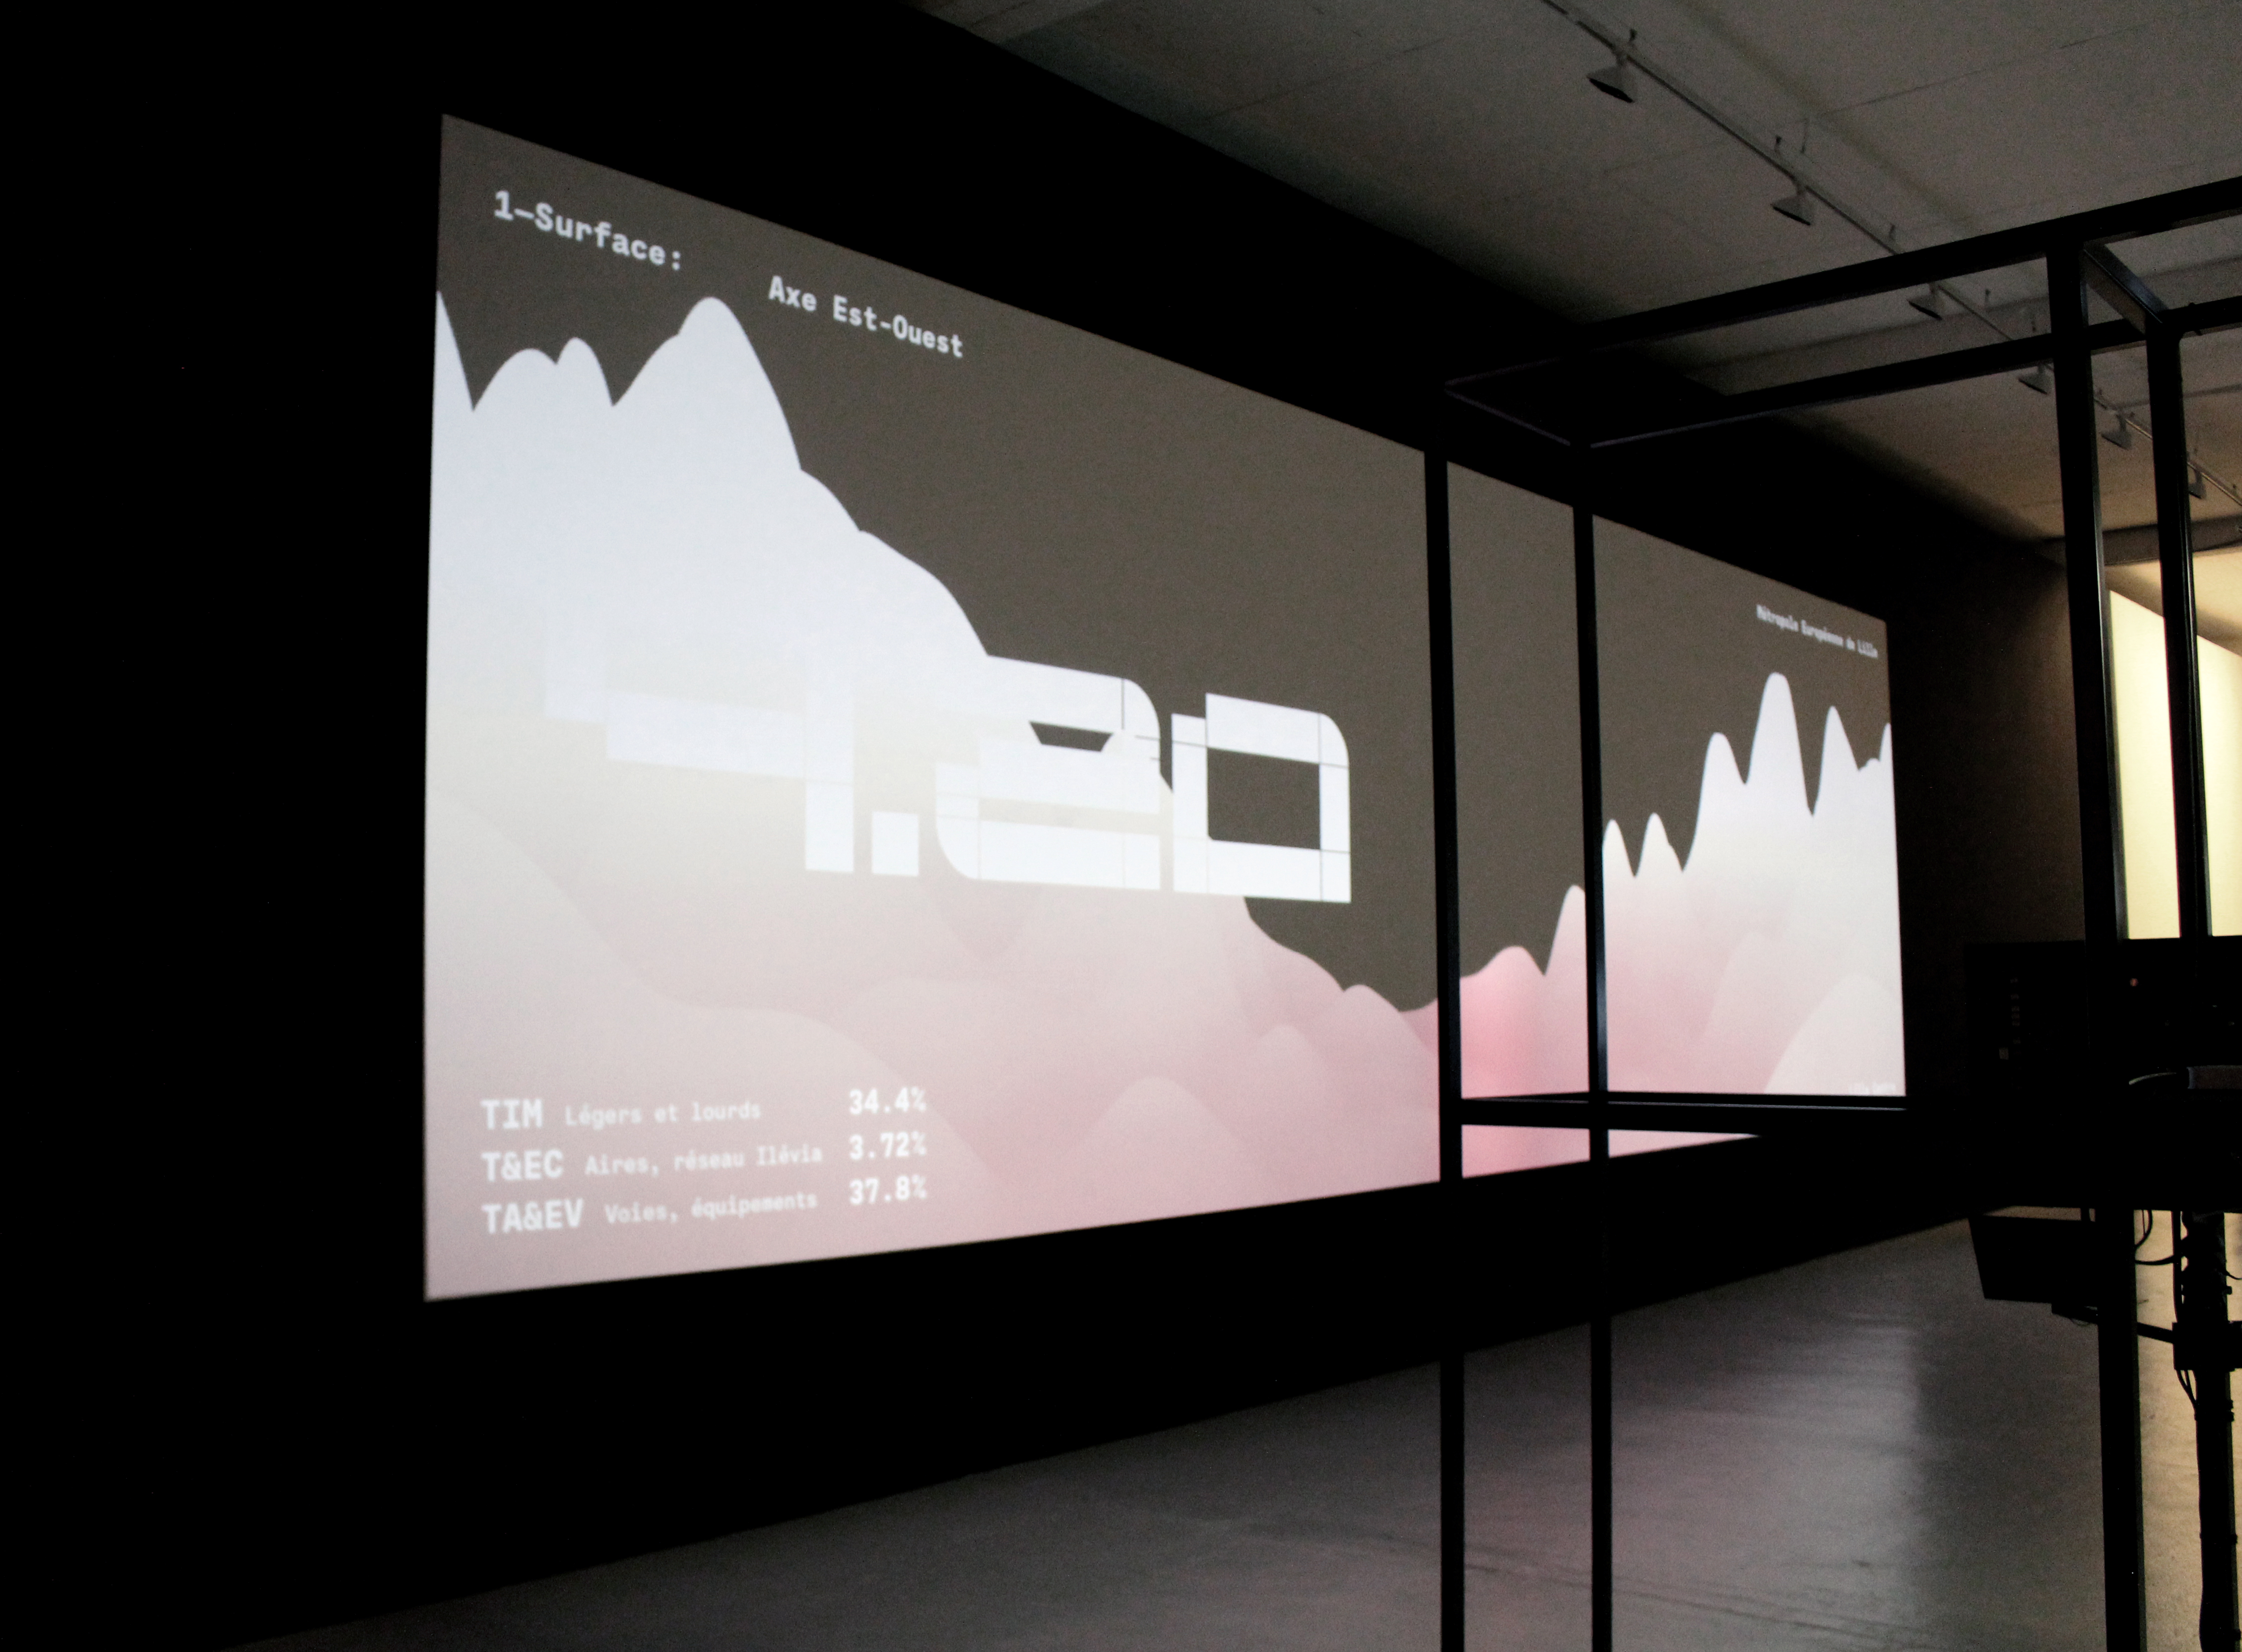
2gather is an in situ artwork based on the processing of both ‘static’ (delayed) and realtime mobility data, taken from the European Metropolis of Lille (EML). These public information resources are dispensed and made available to citizens by the OpenData services of the EML. These in particular relate to the ‘census’ and location of transport infrastructures (and equipments), the “tracing/mapping” of numerous traffic areas-lanes, the identification and monitoring of the different modes or means of transport : public transport (bus, tram, metro), individual motorized transport (heavy and light vehicles), as well as non-motorized ones (active transport or ‘soft mode transport’ like bikes from the V’Lille network). In this artwork, quantitative data variables are used: the number of infrastructures, equipments as well as objects or rolling elements on the metropolitan scale, their surface (geographic spread over the EML territory covering 647.71 km2), their density (concentration of urban traffic and movements per week over a period of 3 years) as well as their frequency (number of real-time moving ‘dots’: state of the Ilévia public transport network, use of car parks, road traffic, and so on)—bringing together and crossing these different measures, enabled also a global index of mobility. For each of these three variables (surface, density and frequency of mobility), dedicated ‘scenes’ of animated representation-visualization of the data were created which follow North—South and East—West paths/routes within the EML landscape. Thus, the set of shapes, figures and graphic details that make up these ‘scenes’ are being parametric, they change and evolve at the rate of the ‘incoming’ data streams. More than a useful, descriptive or even analytic transcription, a creative interpretation of the data is proposed, in favor of a sensitive impression and experience: feeling or sense the “pulse” of the city.
—This text was written for the “1,2,3 data” exhibition at the Tripostal—Lille (from February 5, to March 8, 2020) in Lille.
Installation de data art
2gather est une œuvre in situ reposant sur le traitement de données de mobilité pour certaines temps réel prélevées au sein de la Métropole Européenne de Lille (MEL). Il s’agit là de ressources informationnelles publiques, administrées et mises à disposition des citoyens par les services OpenData de la MEL. Celles-ci ont trait, notamment, au recensement et à la disposition/localisation des infrastructures (et équipements) de transport, au “traçage” des nombreuses aires et voies de circulation, au suivi des différents modes ou moyens de transport : les transports en commun (bus, tramway, métro), les transports individuels motorisés (véhicules lourds et légers) ainsi que ceux non-motorisés (transports actifs ou mode doux comme le vélo—réseau V’Lille). Sont utilisées, dans le cadre de cette œuvre, des variables de données quantitatives : le nombre d’infrastructures, d’équipements ainsi que d’objets et/ou matériels roulants à l’échelle de la métropole, leur surface (étalement, répartition géographique sur le territoire de la MEL d’une superficie totale de 647,71 km2), leur densité (concentration des circulations et déplacements urbains par semaine sur une durée de trois ans) ainsi que leur fréquence (nombre des ‘points’ mobiles temps réel : état du réseau de transport public Ilévia, fréquentation des parkings, trafic routier, etc.)—le rapprochement et le croisement de ces différentes mesures ont permis, en outre, la constitution d’un index global de mobilité. Pour chacune de ces trois variables (surface, densité et fréquence des mobilités), il fut créé des “scènes” dédiées de représentation-visualisation animée des données lesquelles suivent des parcours Nord—Sud et Est—Ouest au sein de la MEL. Ainsi, l’ensemble des formes, des figures et détails graphiques qui compose ces “scènes” étant paramétrique, celles-ci changent, évoluent au rythme des flots de données “entrants”. Plus qu’une “retranscription” utilitaire, descriptive ou bien encore analytique, il est ici proposé une réinterprétation créative des données en faveur d’une impression et expérience sensibles : sentir ou ressentir le « pouls » de la Ville.
—Ce texte fut rédigé pour l’exposition « 1,2,3 data » au Tripostal de Lille (du 5 février au 8 mars 2020).
Exhibition
This installation is a core artwork of the “1,2,3 data” exhibition at the Tripostal—Lille (from February 5, to March 8, 2020). This exhibit is part of the official program of Lille Metropole 2020 World Design Capital (labelled by the World Design Consortium—WDC).
Images
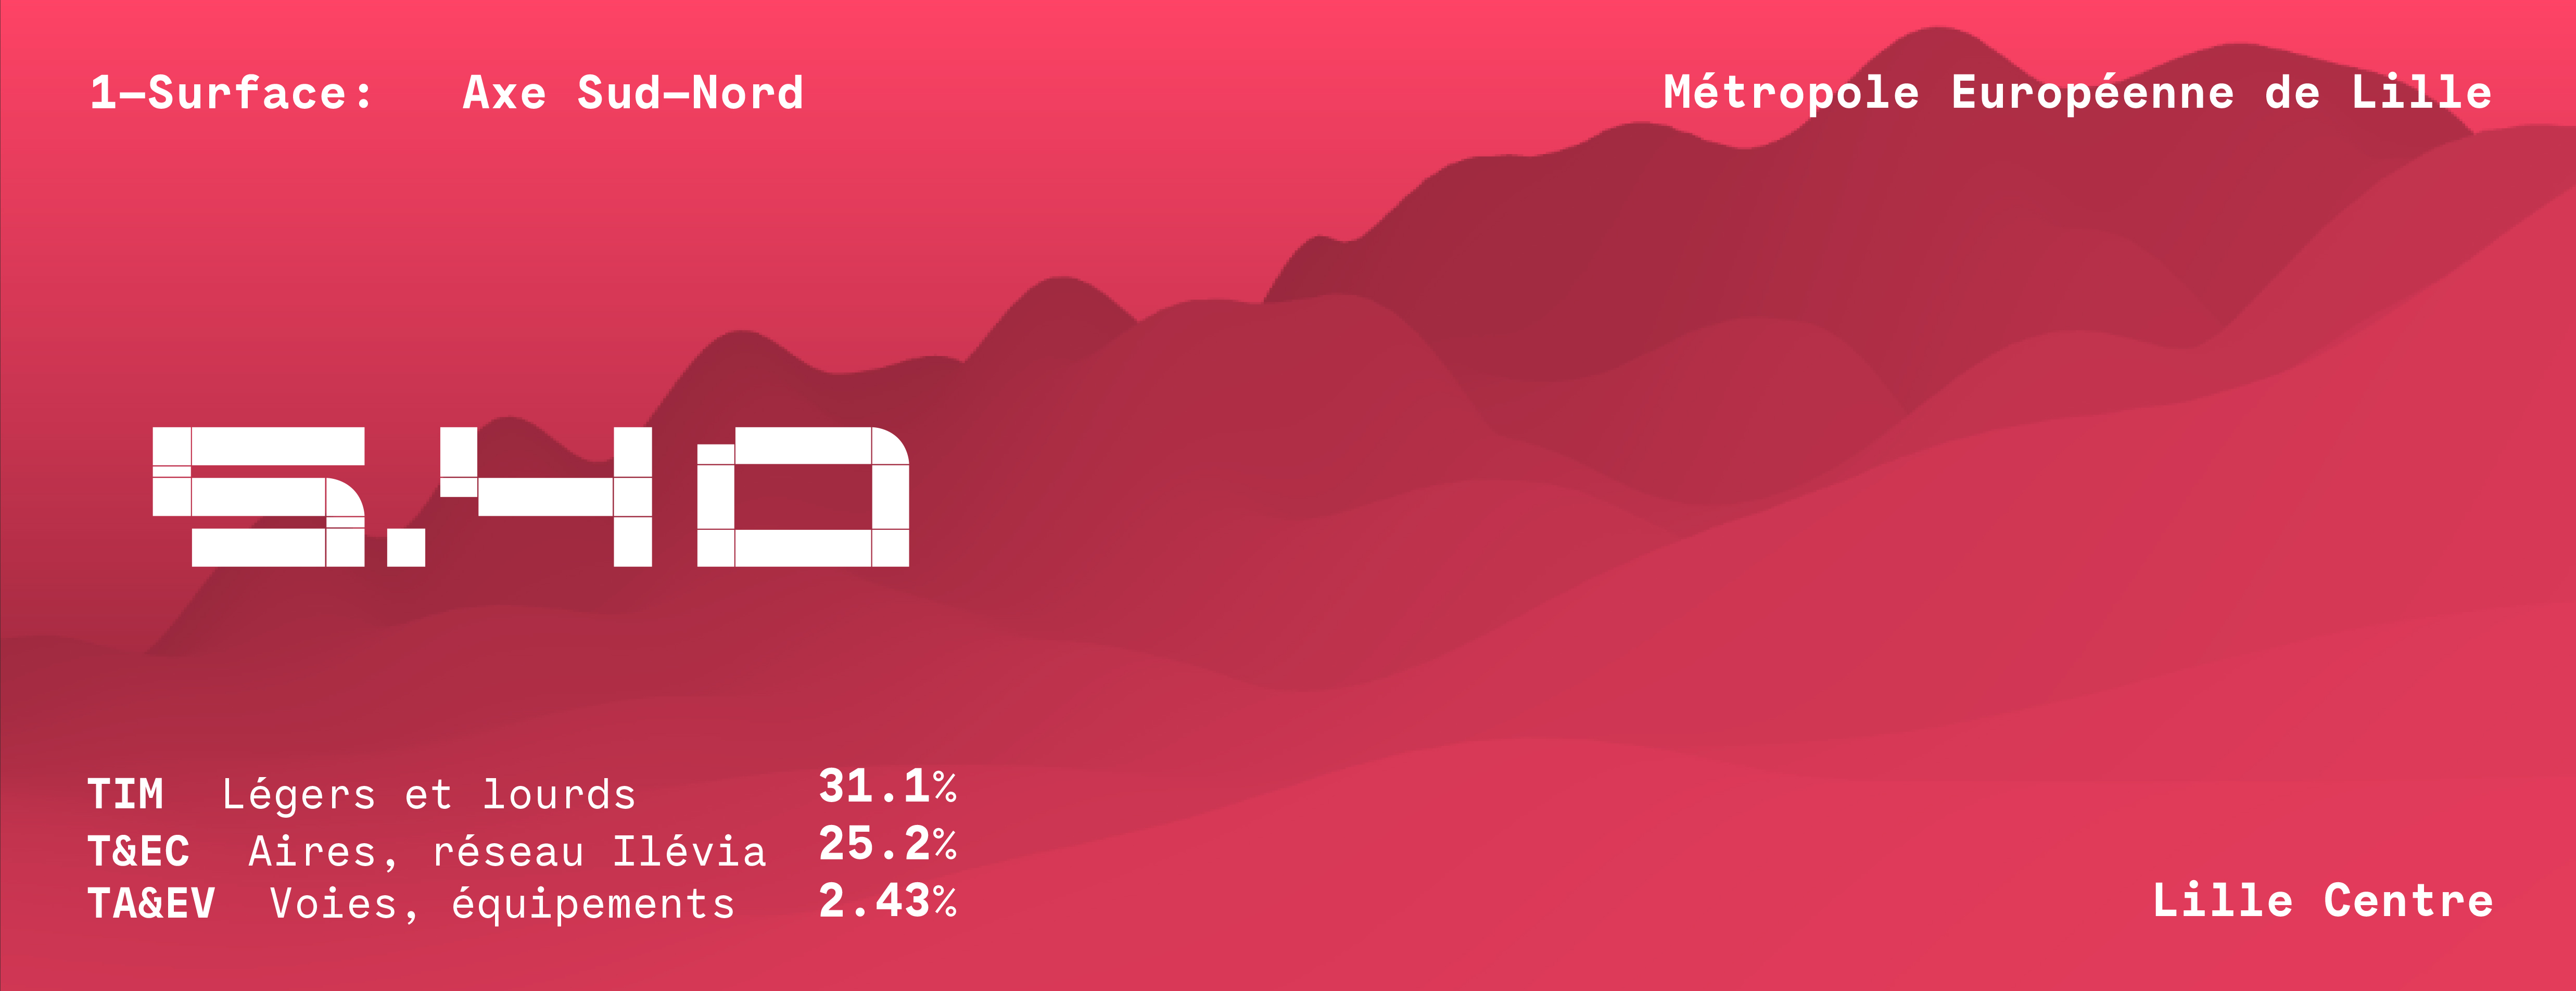
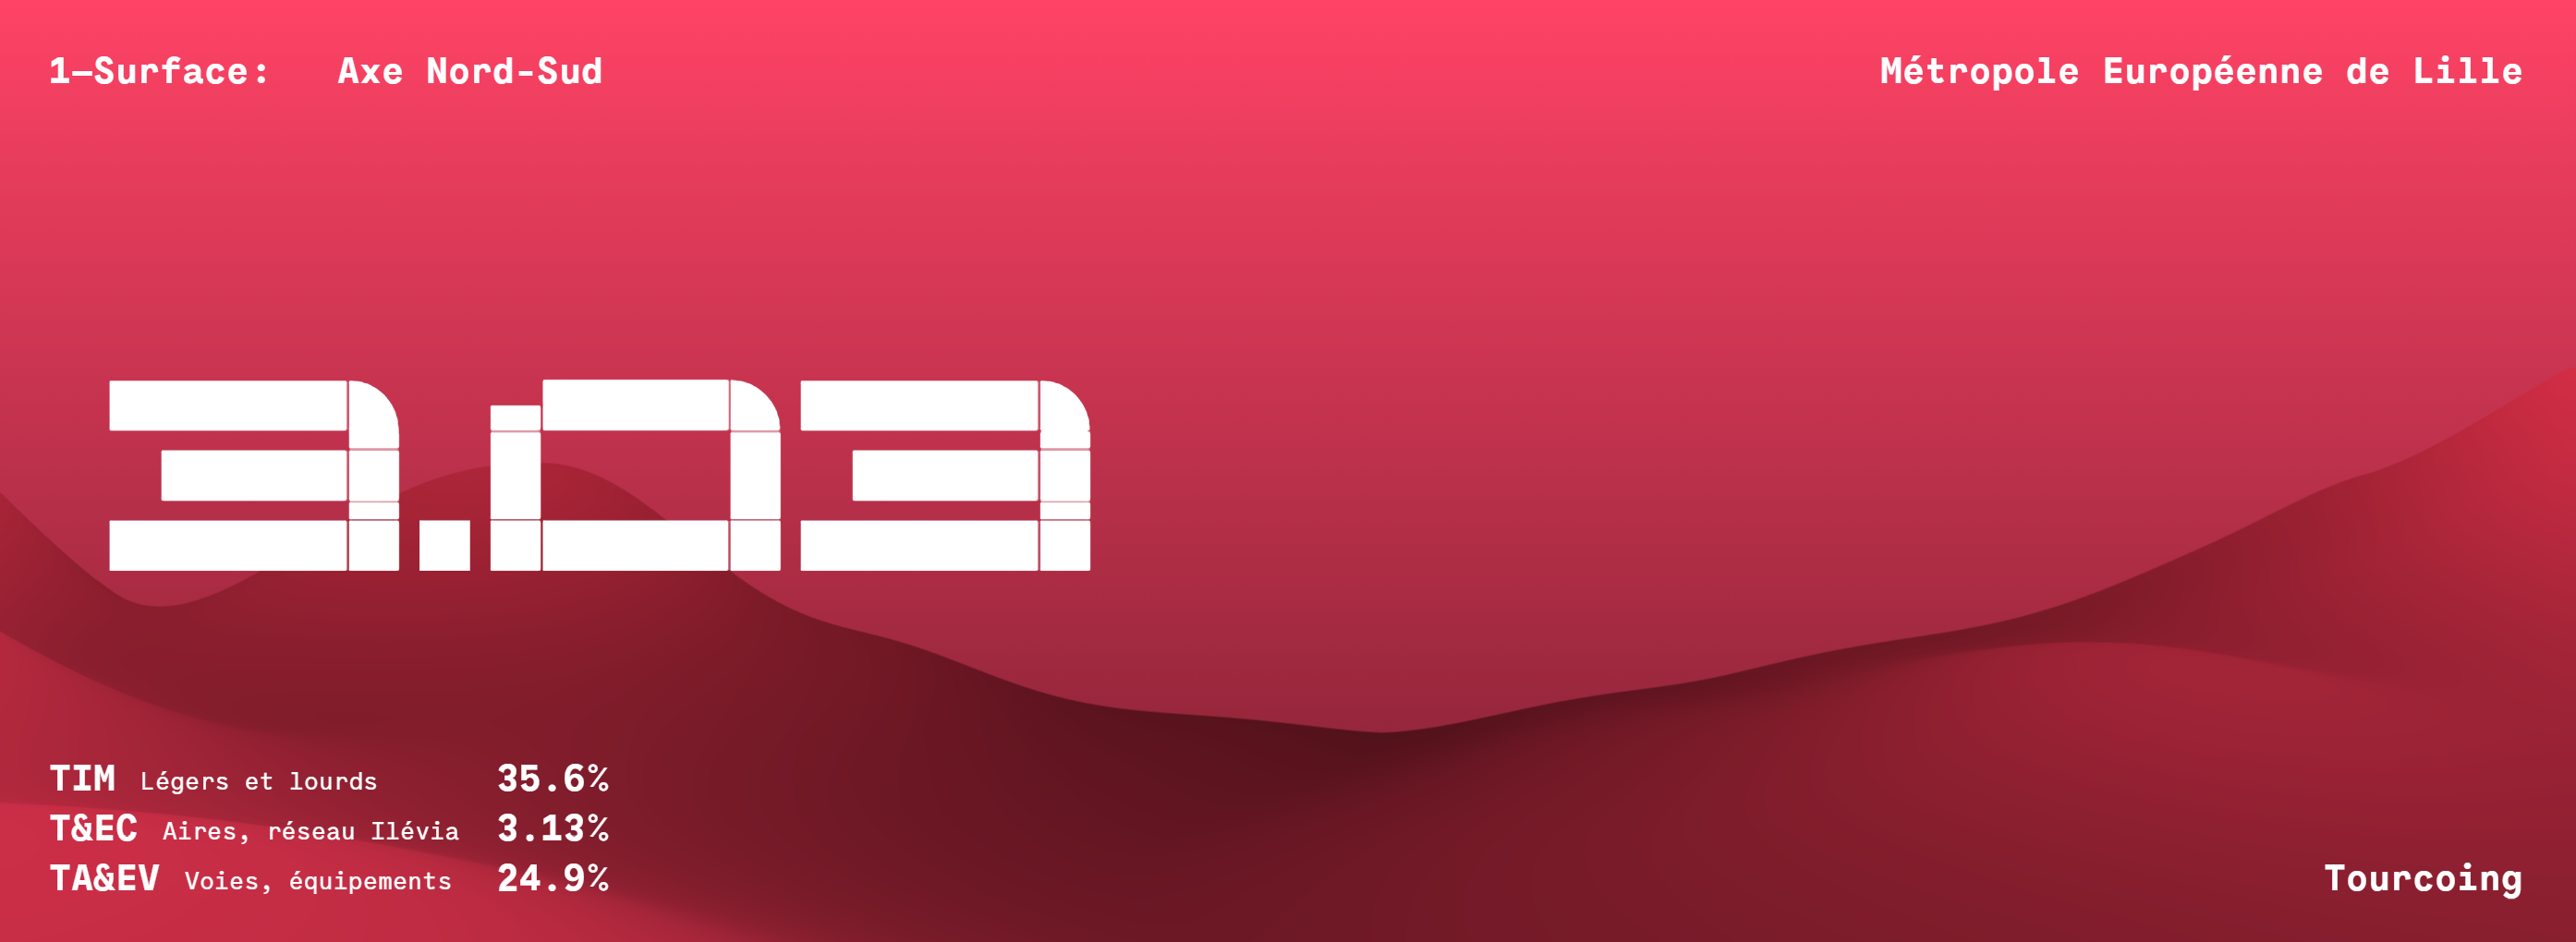
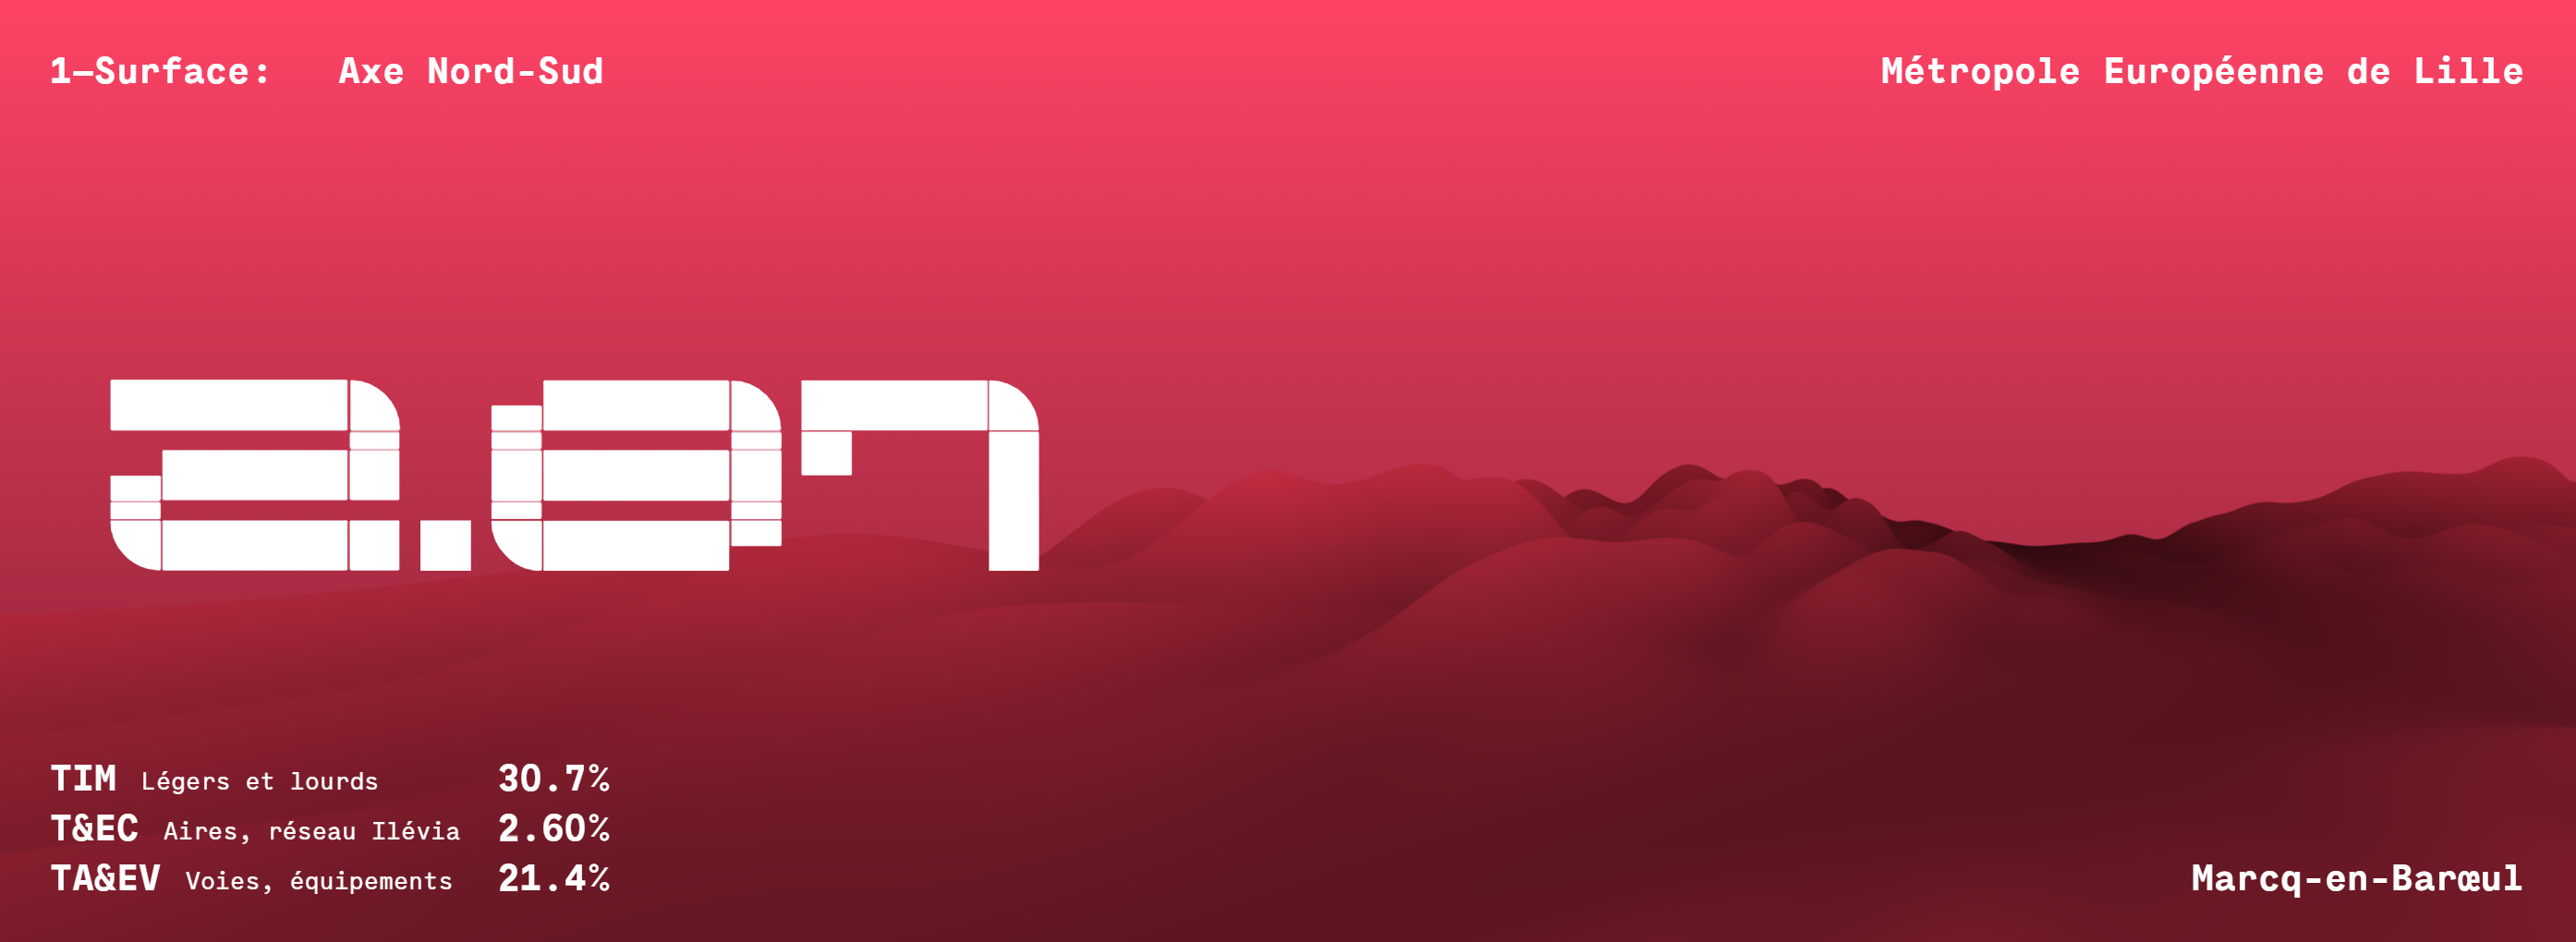
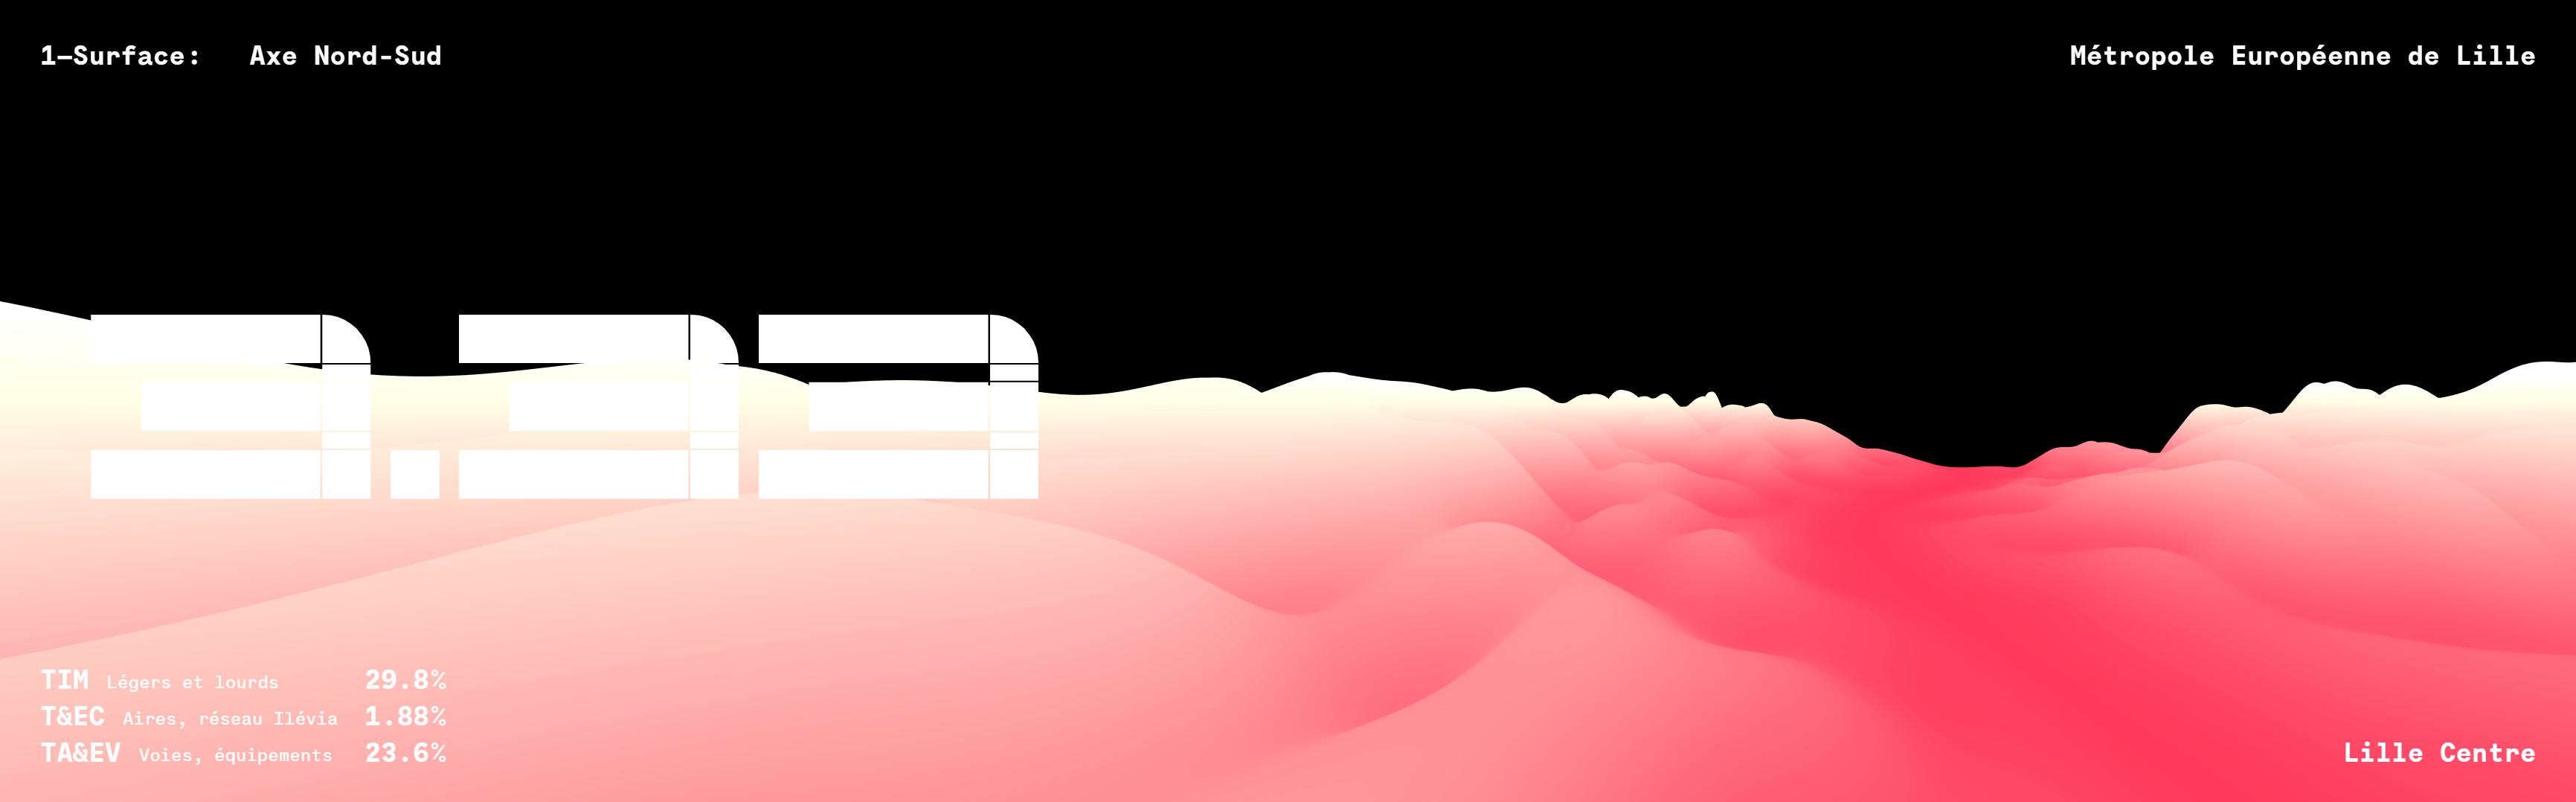
The project is composed of three “Data Scenes”—each is related to a specific dataset.
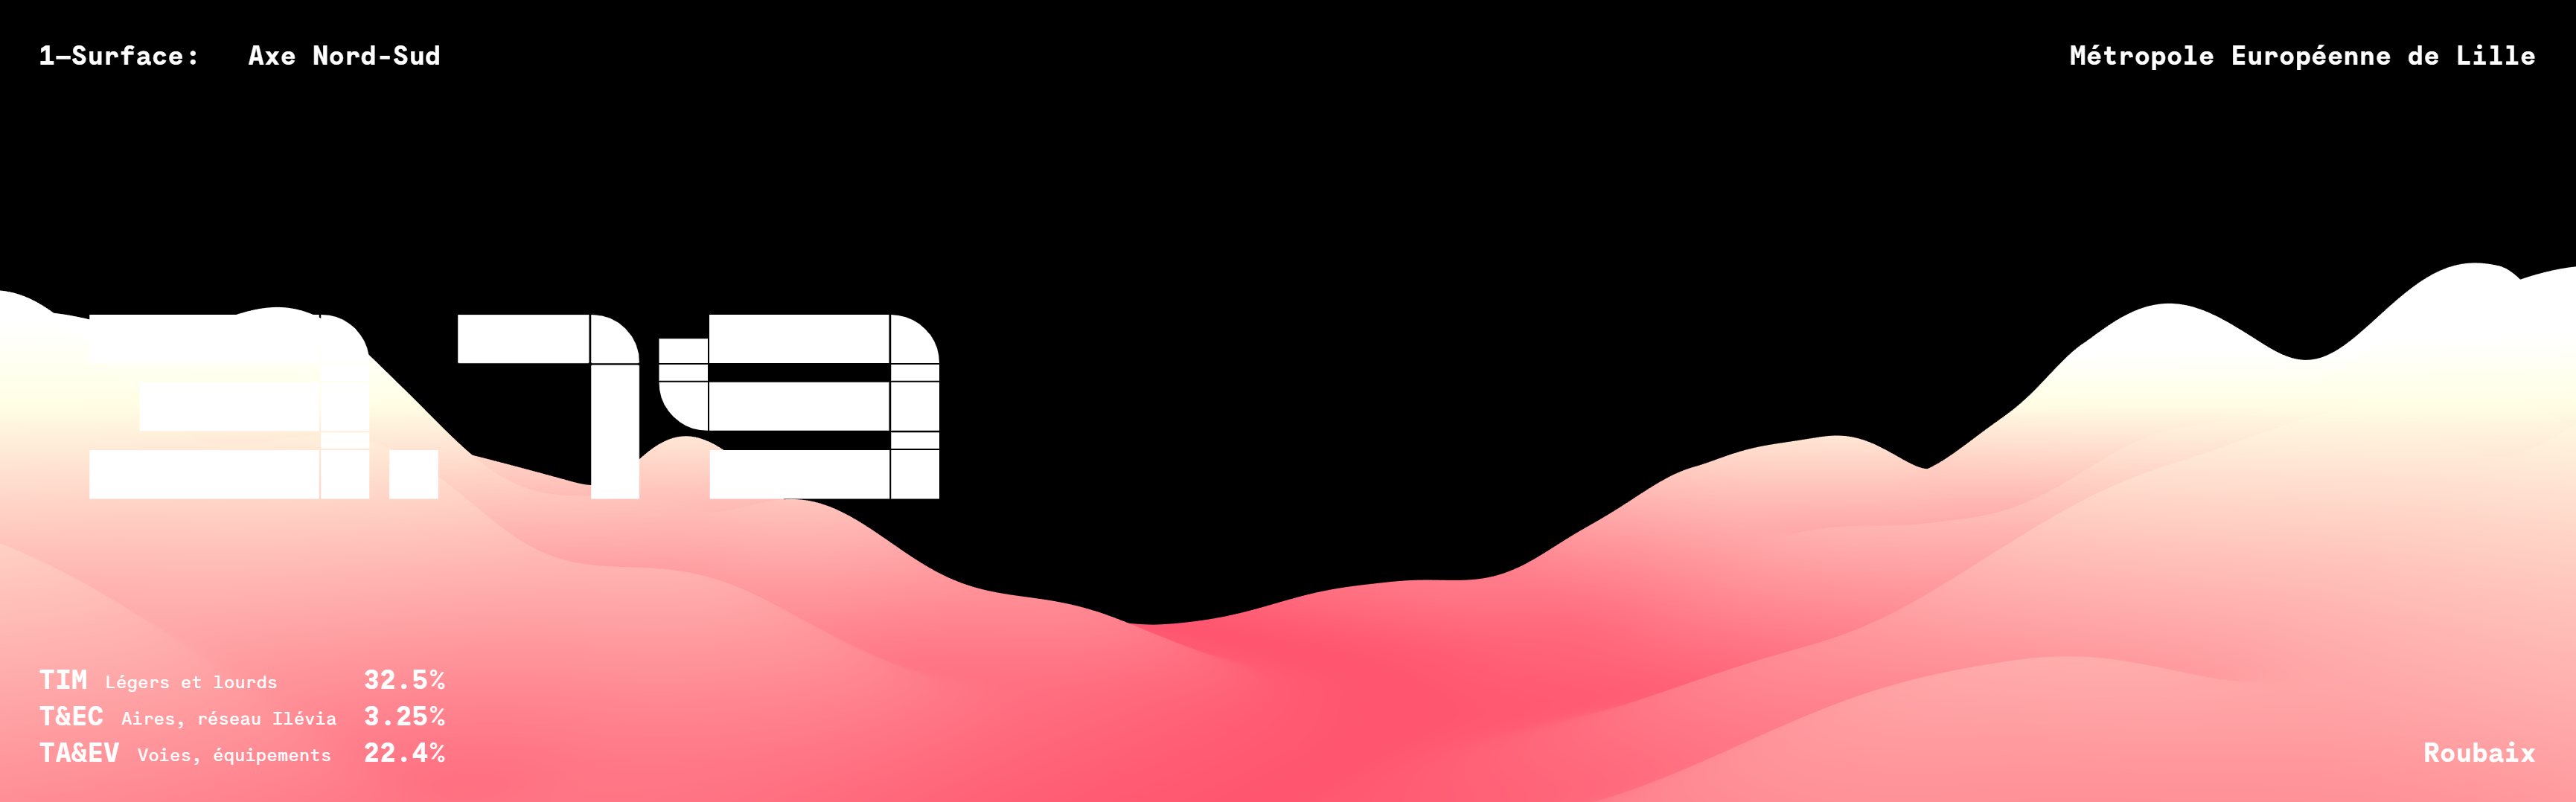
* The first (1) scene titled “Surface” offers to depict the whole EML’s (European Metropolis of Lille) Urban Infrastructure (included Installations and Equipments), and facilities.
3 main indicators:
- « TIM (Légers et lourds) [Transports Individuels Motorisés] » means Individual Motorized Transport (Heavy and Light Vehicles),
- « T&EC (Aires, réseau Illévia) [Transports & Espaces Communs] » means Public Transport and Common Areas,
- « TA&EV (Voies, équipements) [Transports Actifs & Espaces Verts] » means Active Transportation and Green Spaces.
WIP Version:


First-Draft Version:
First Edited Version:
Second Edited Version:
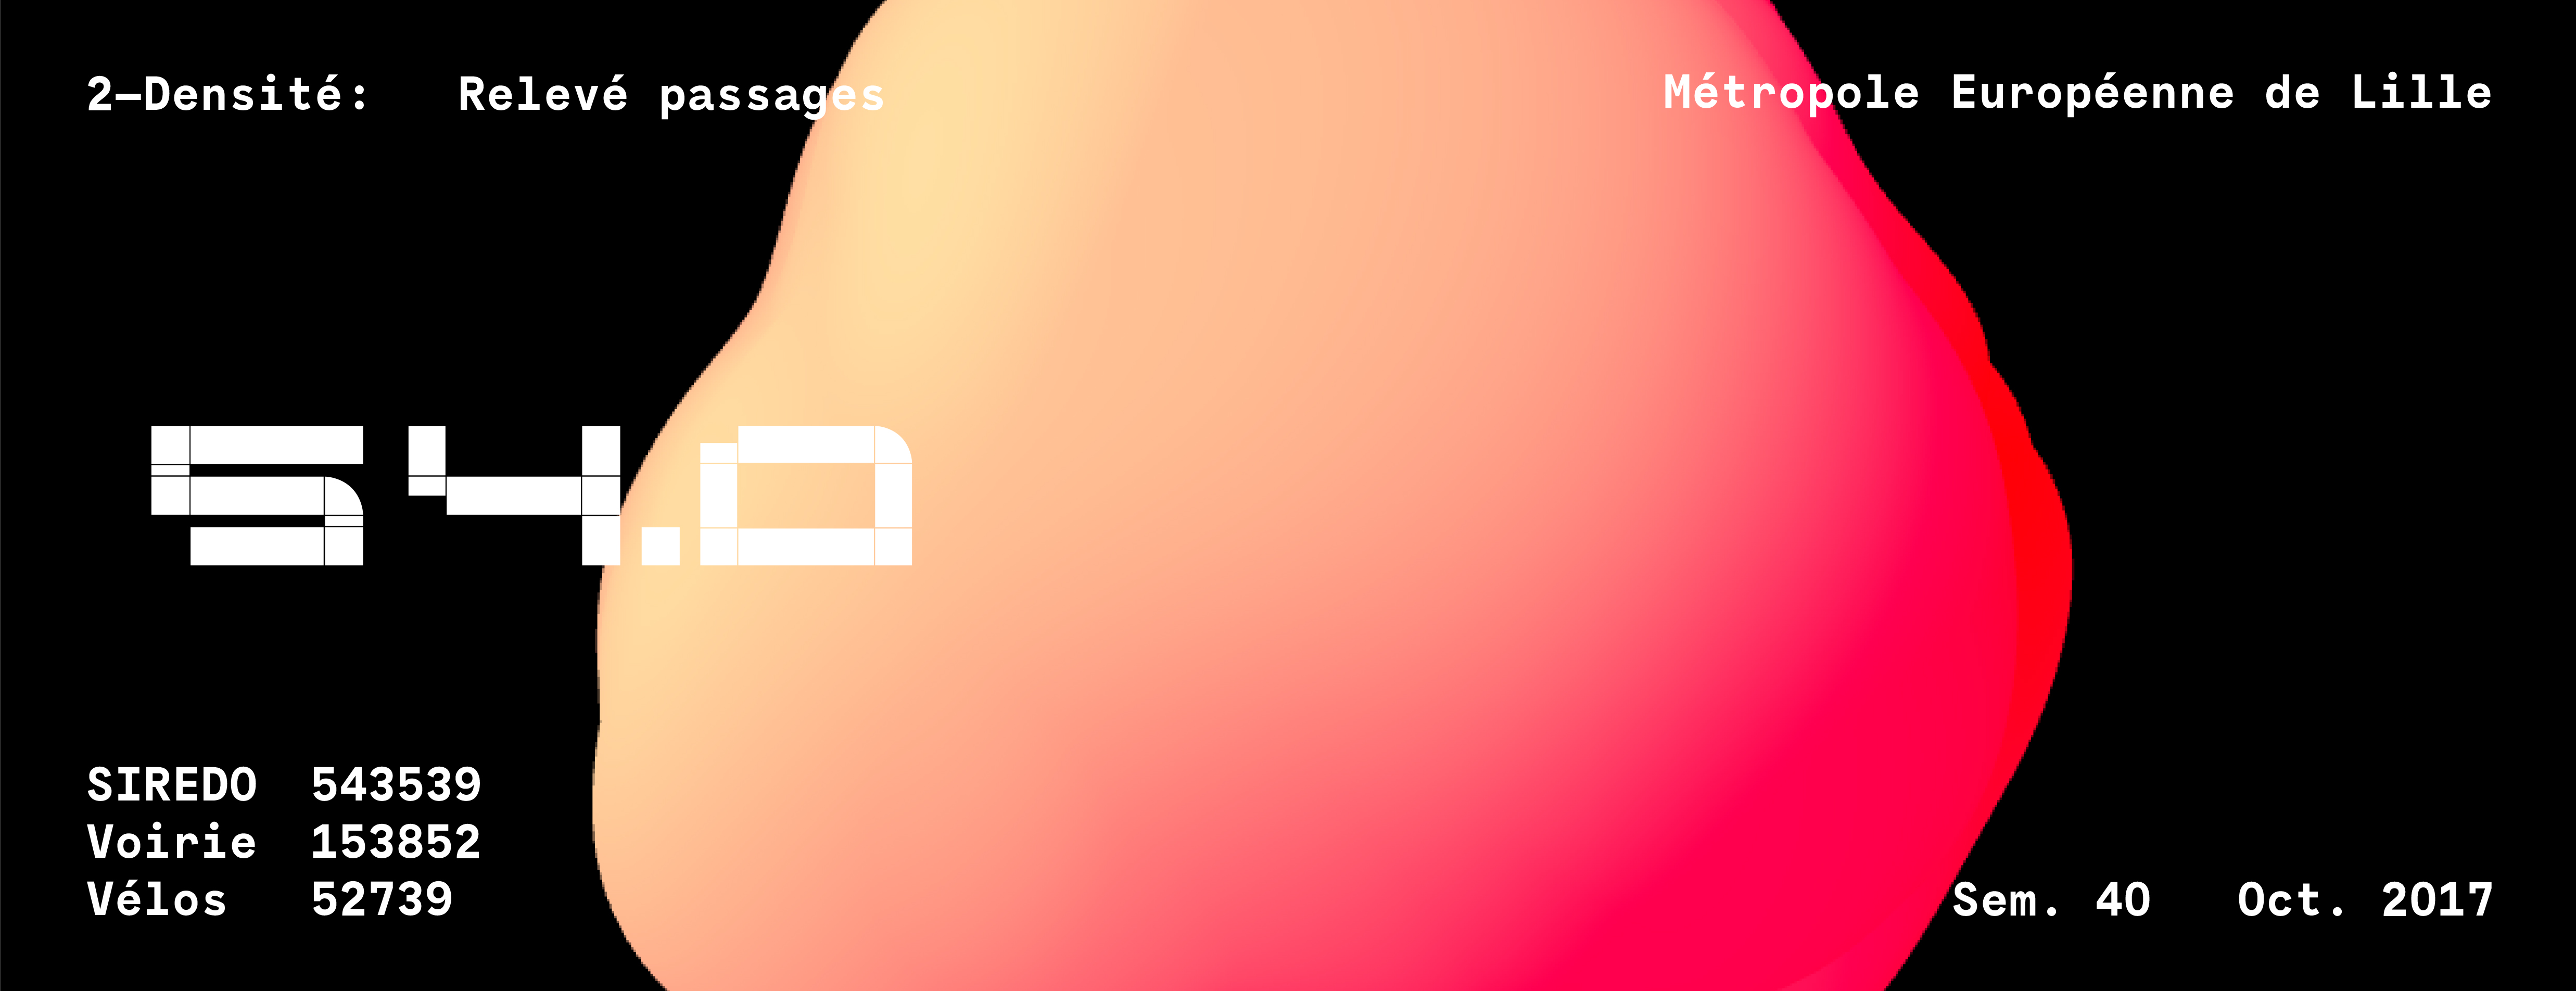
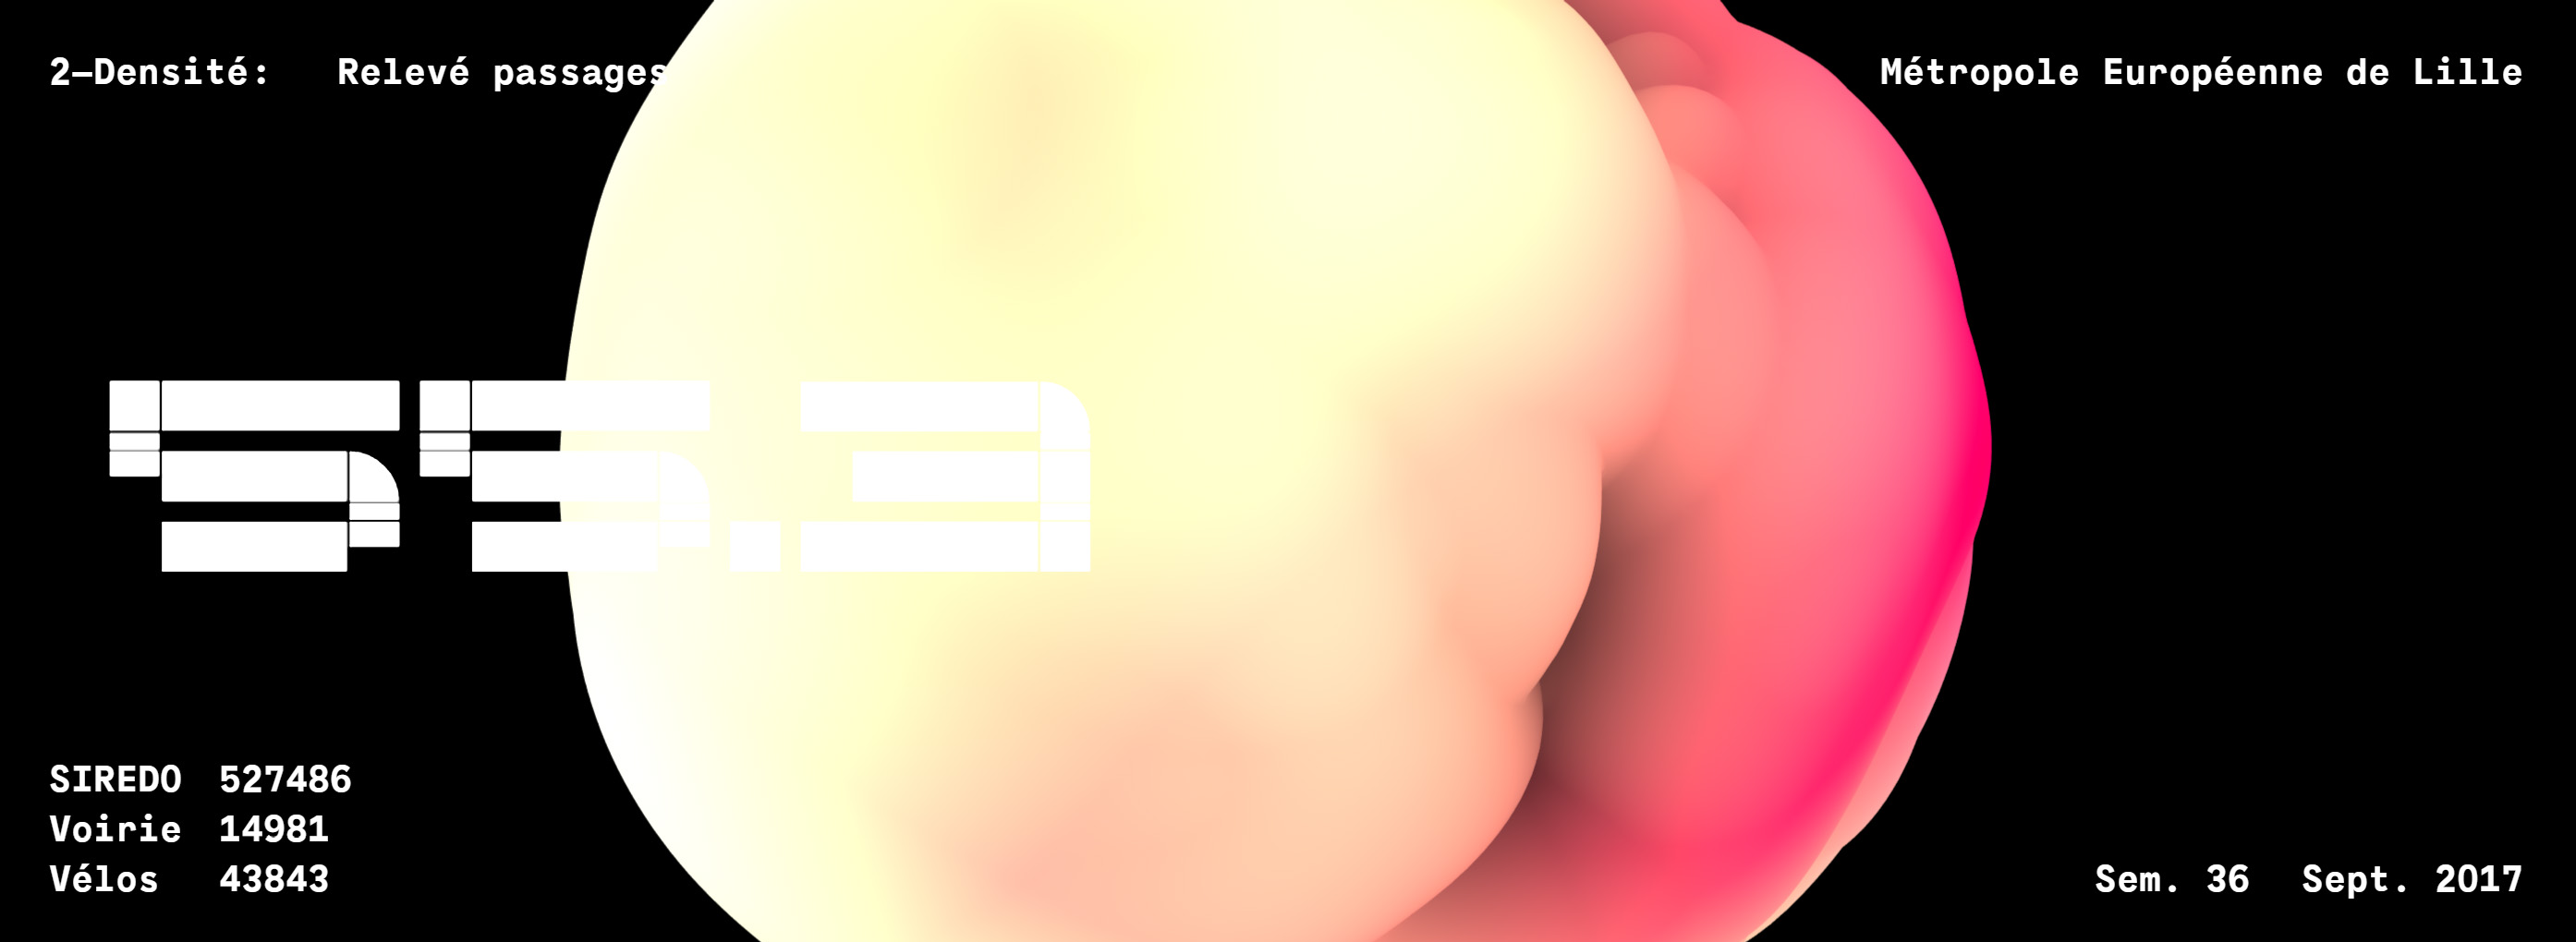
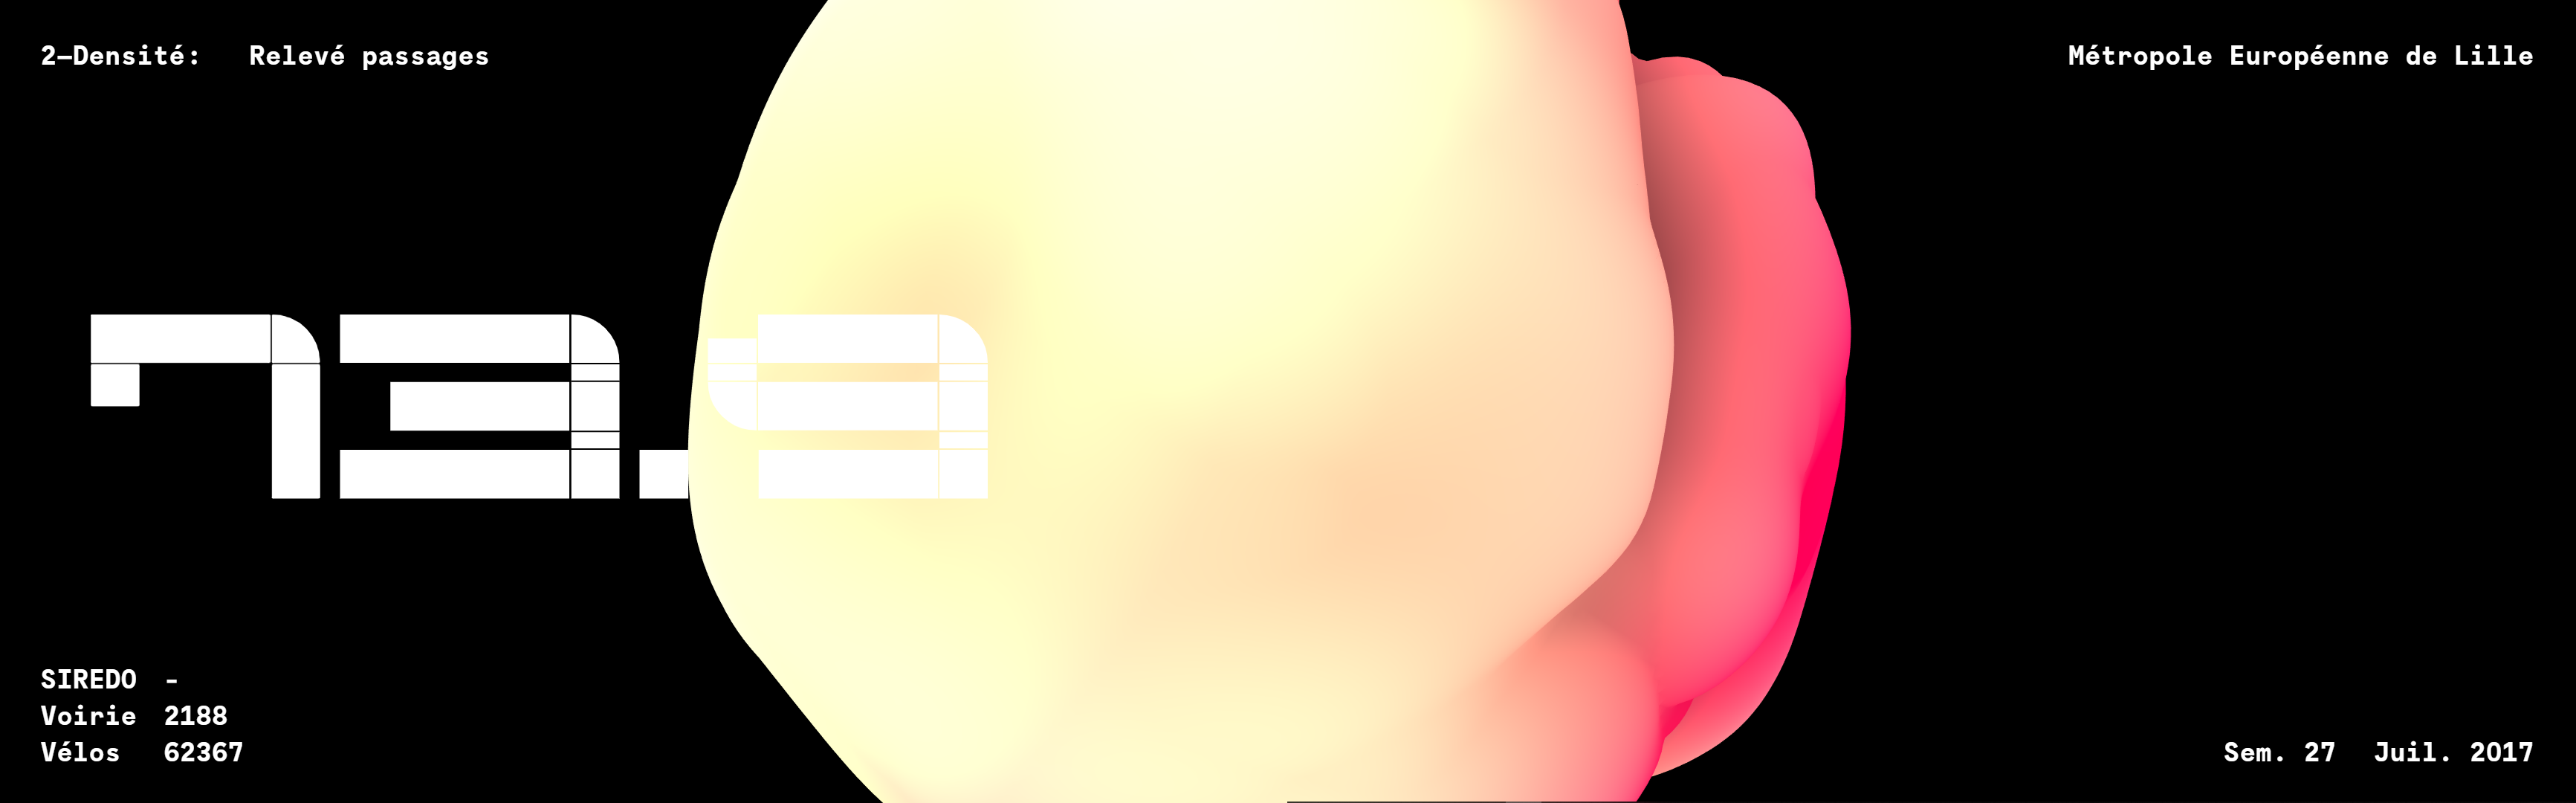
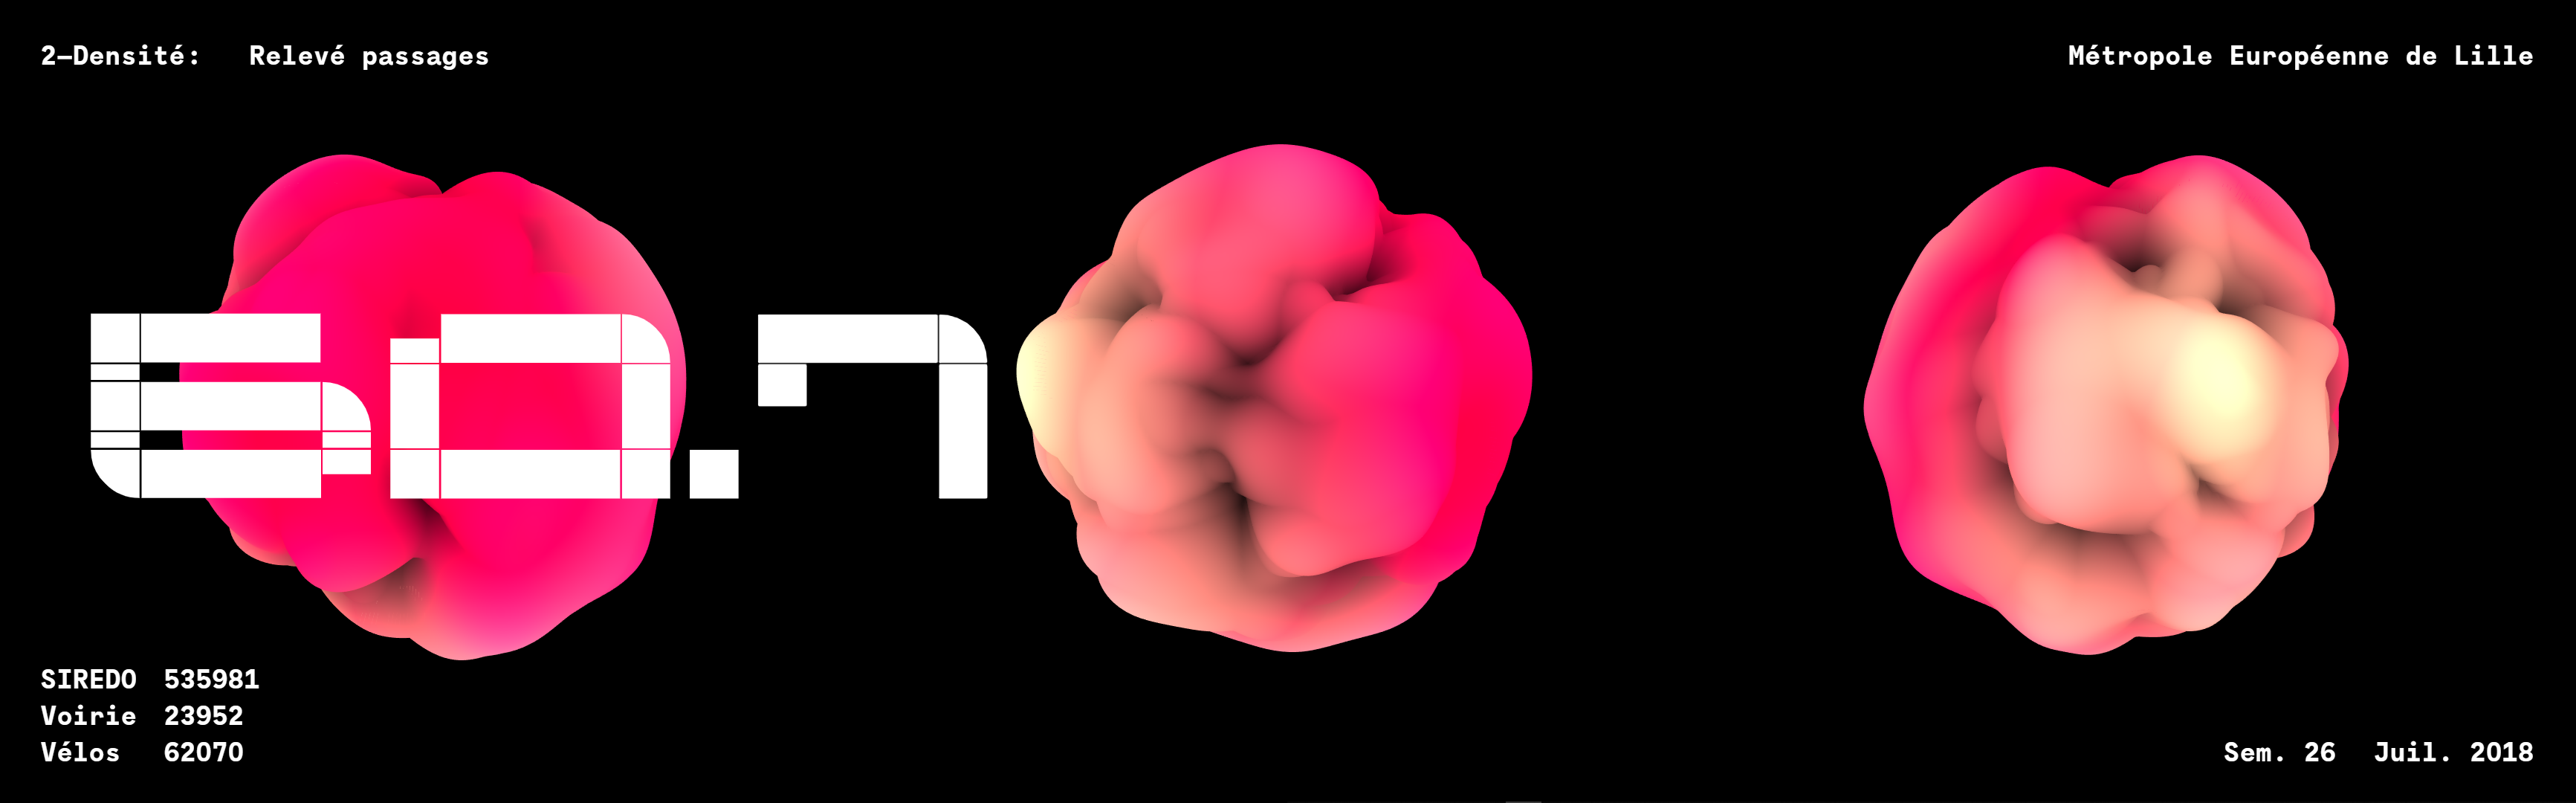
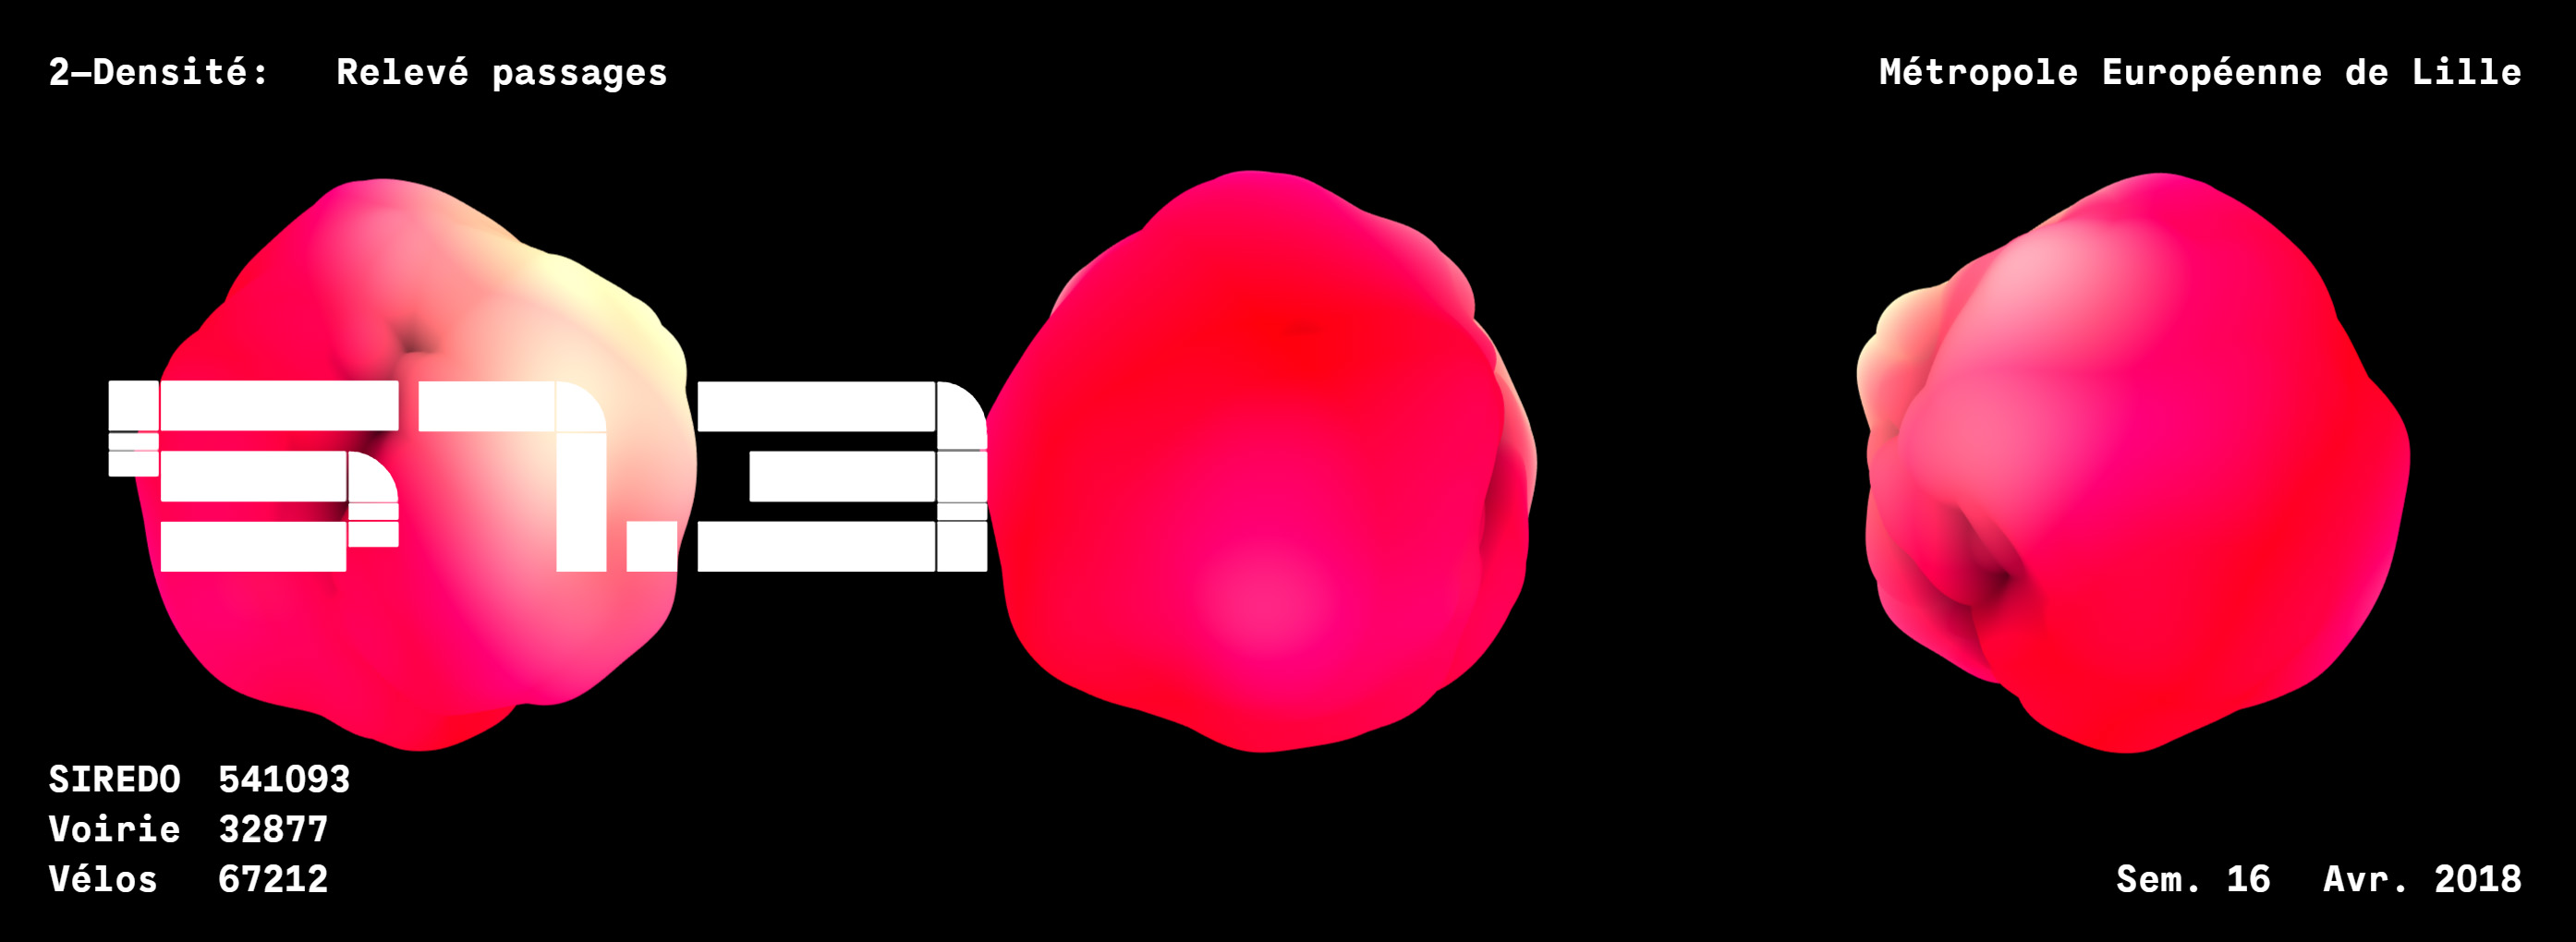
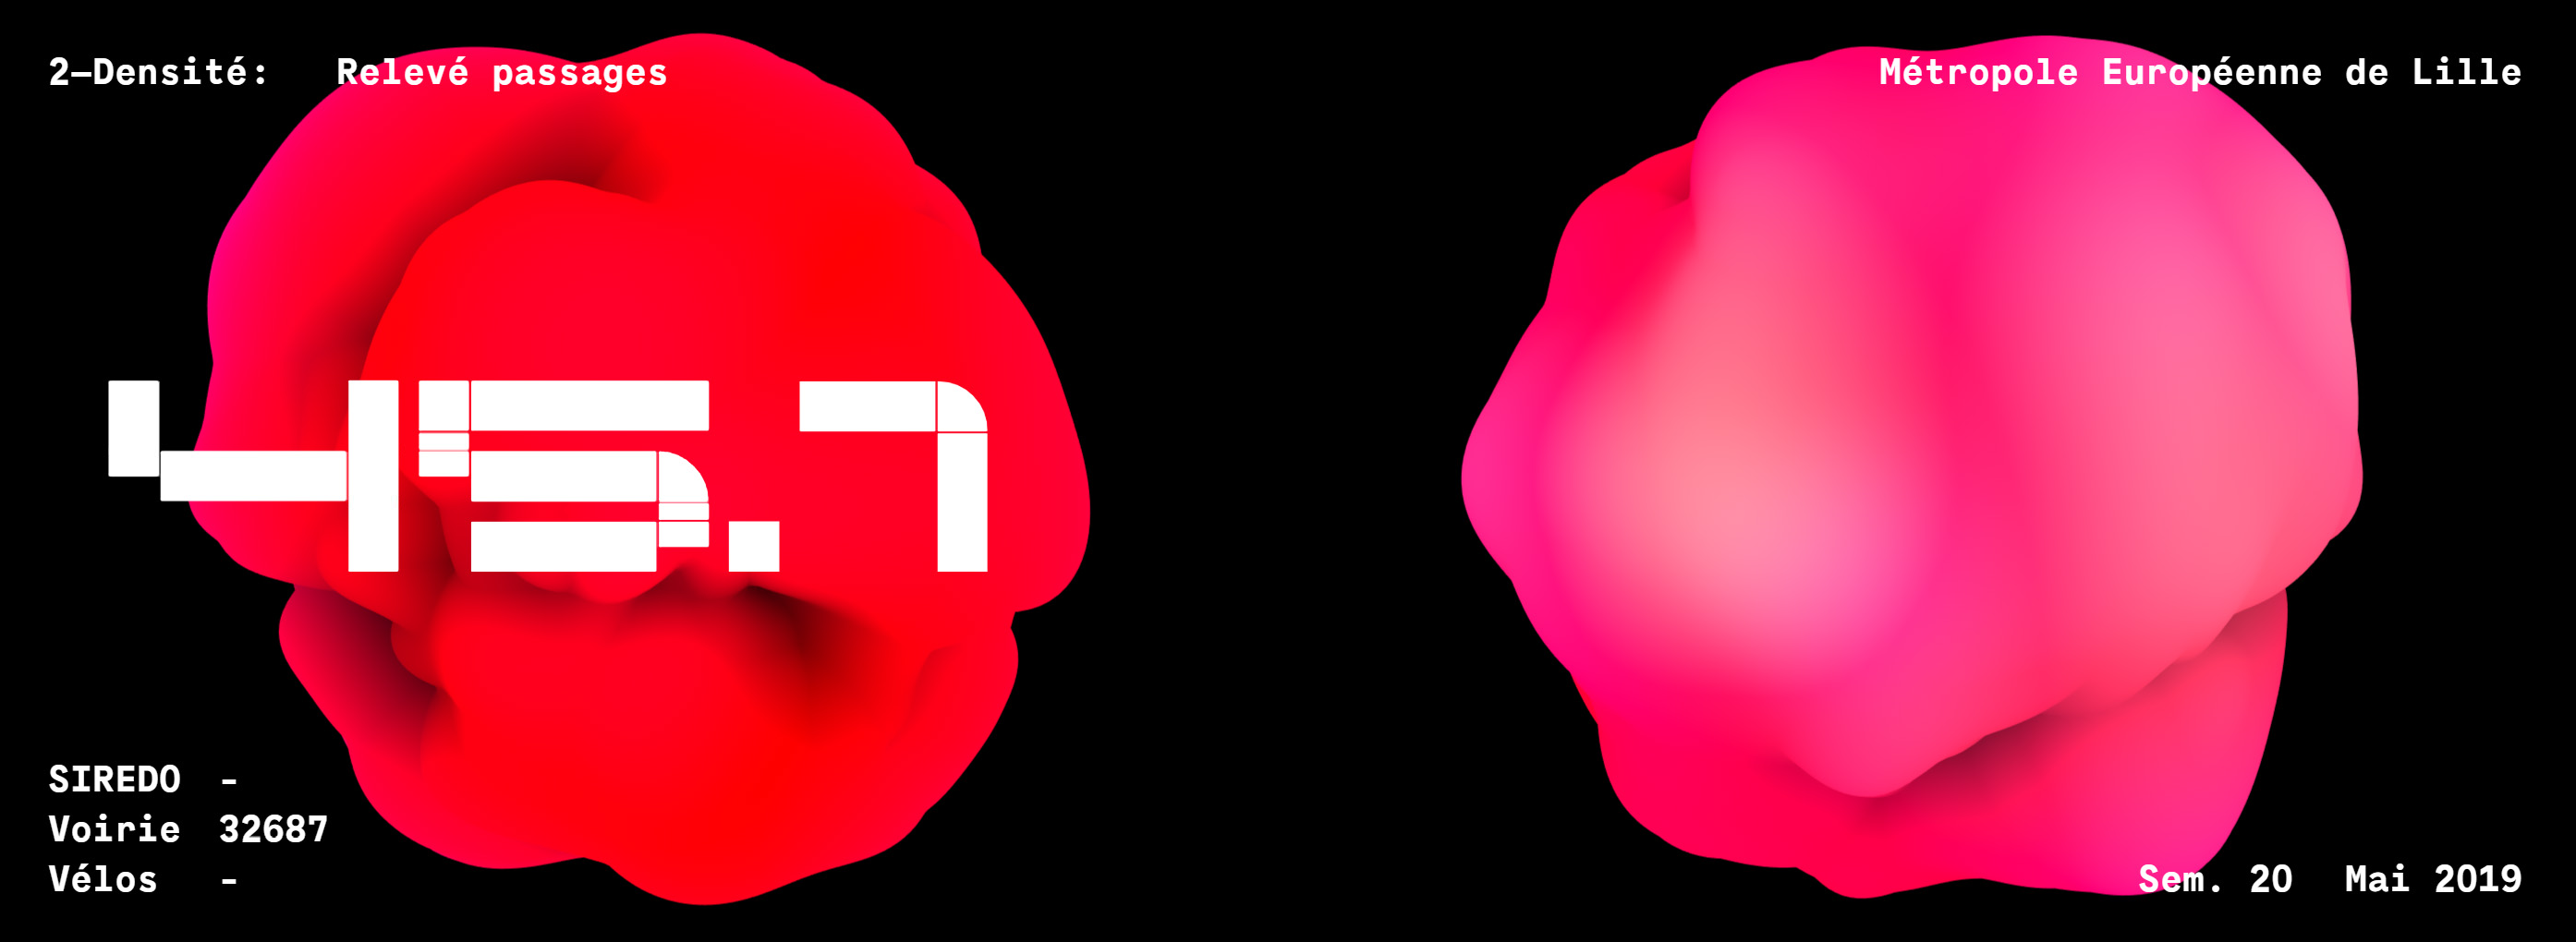
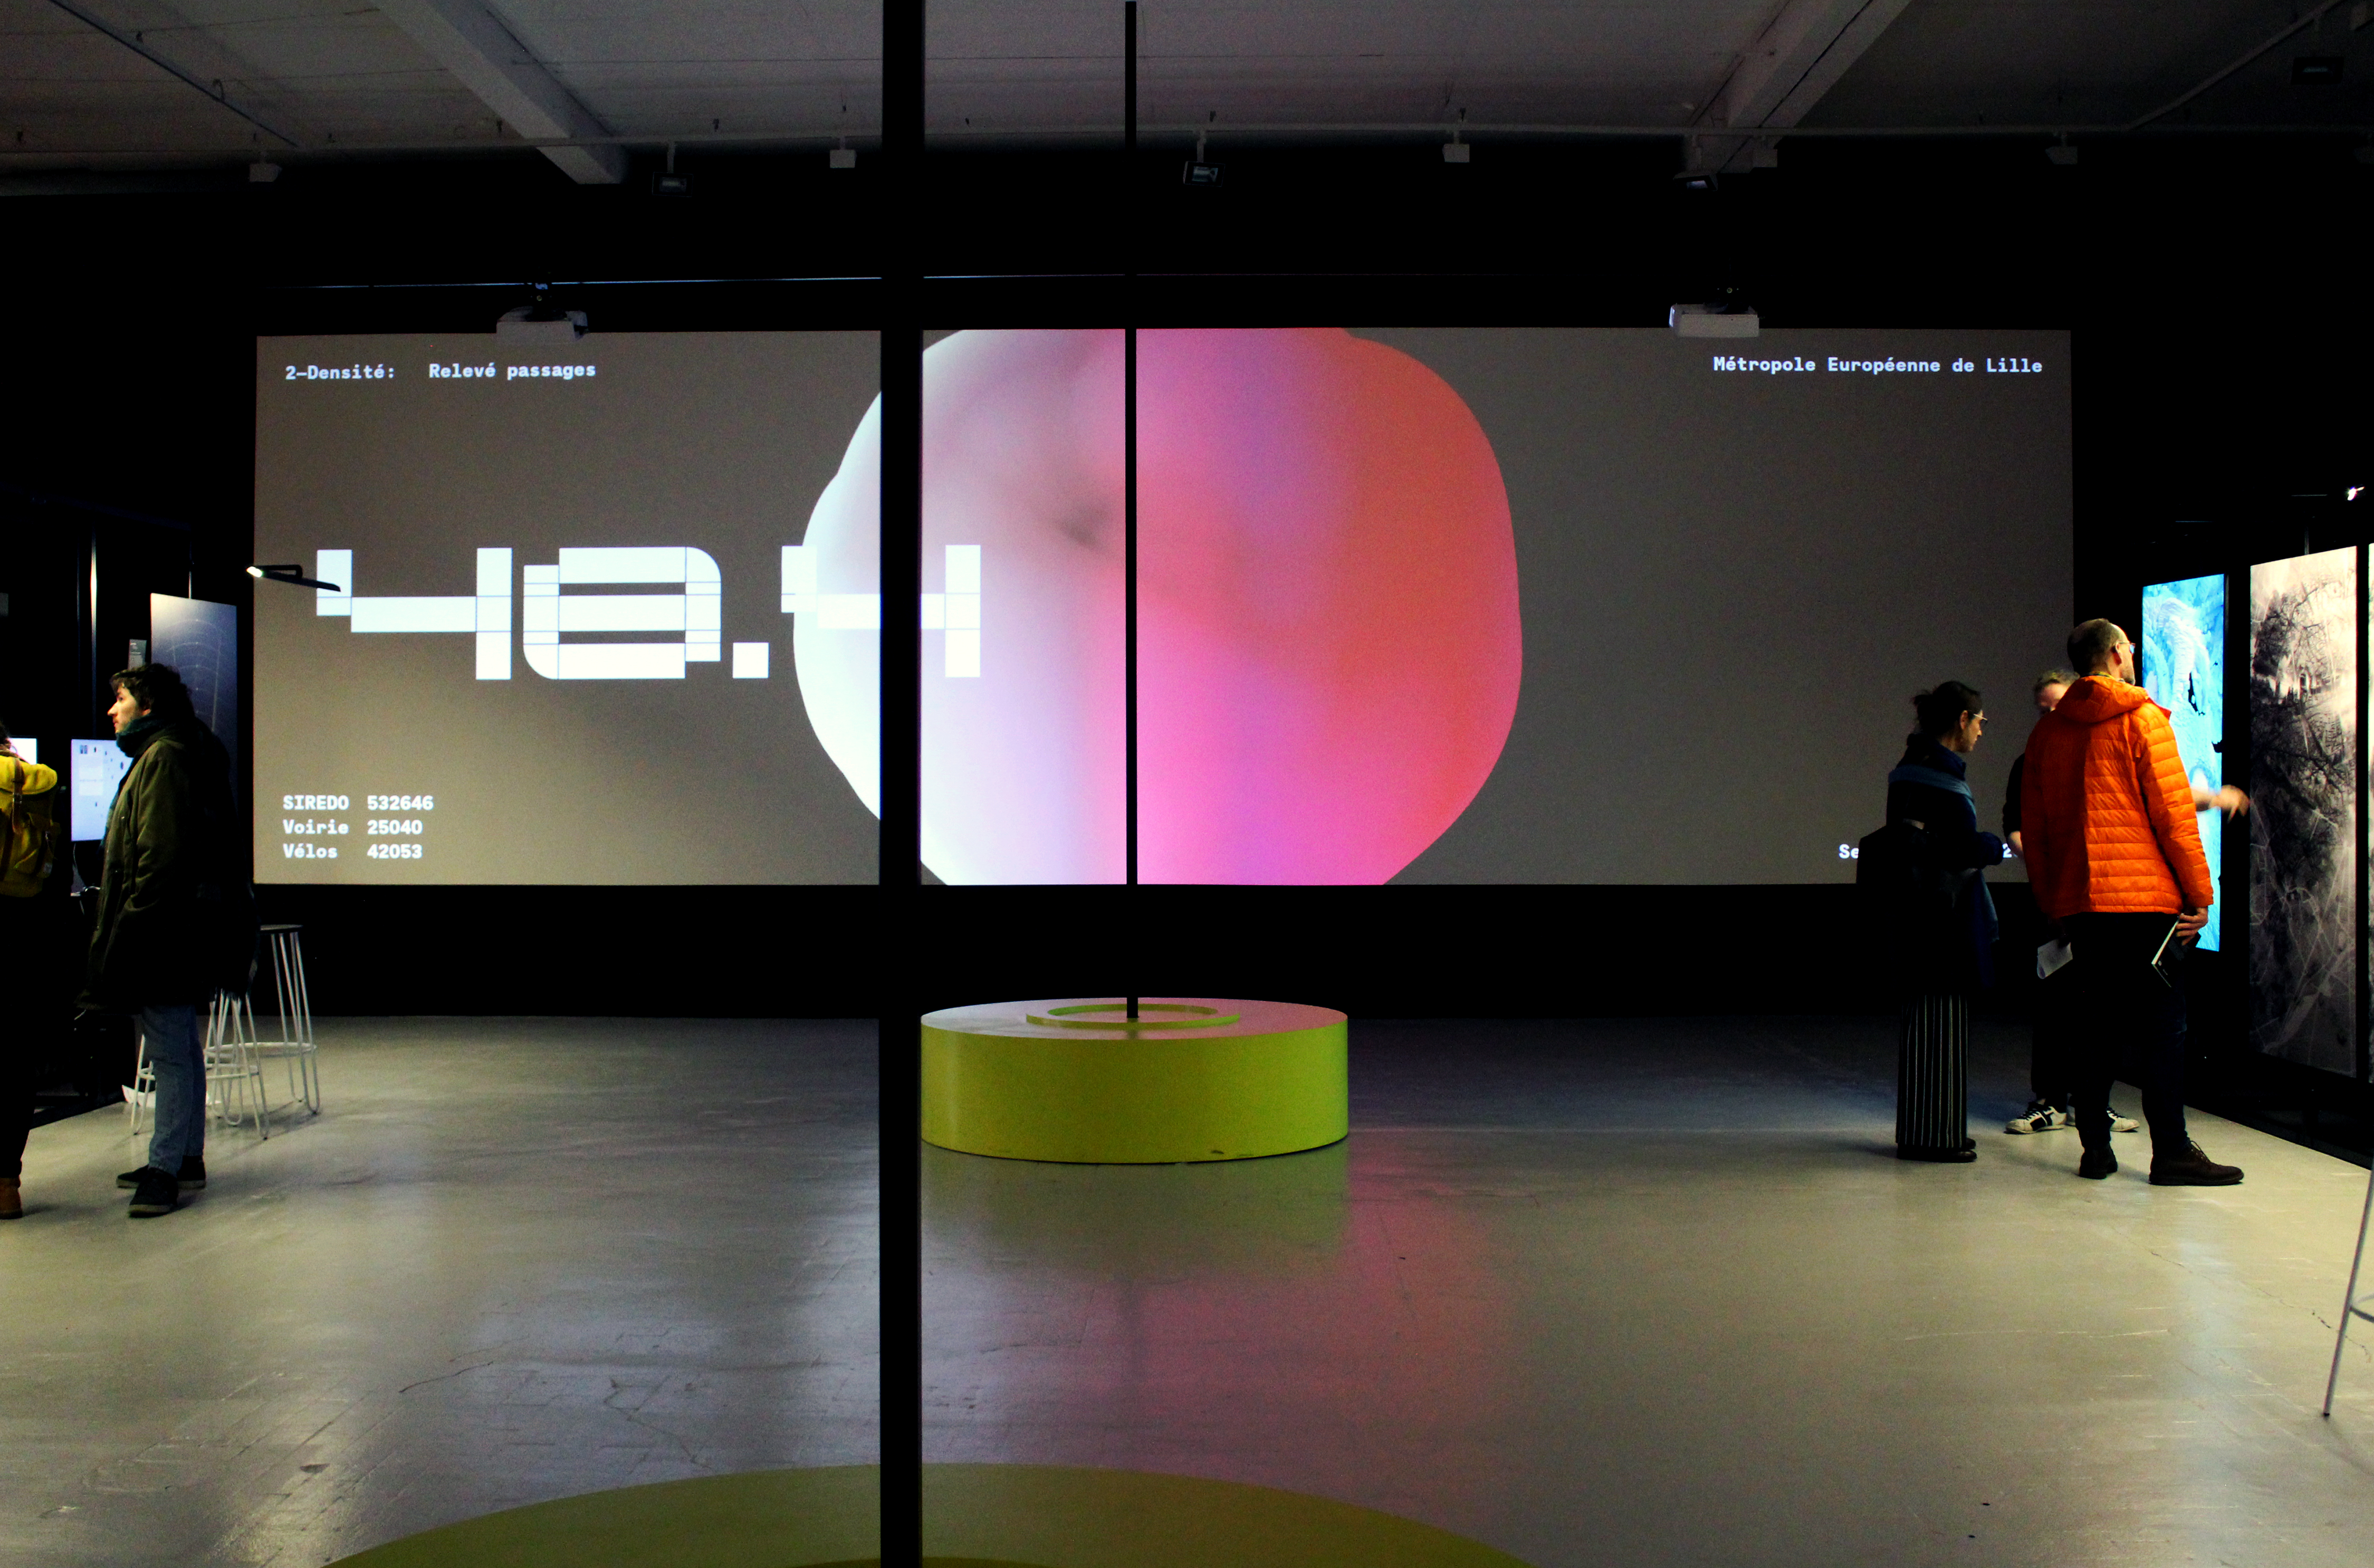
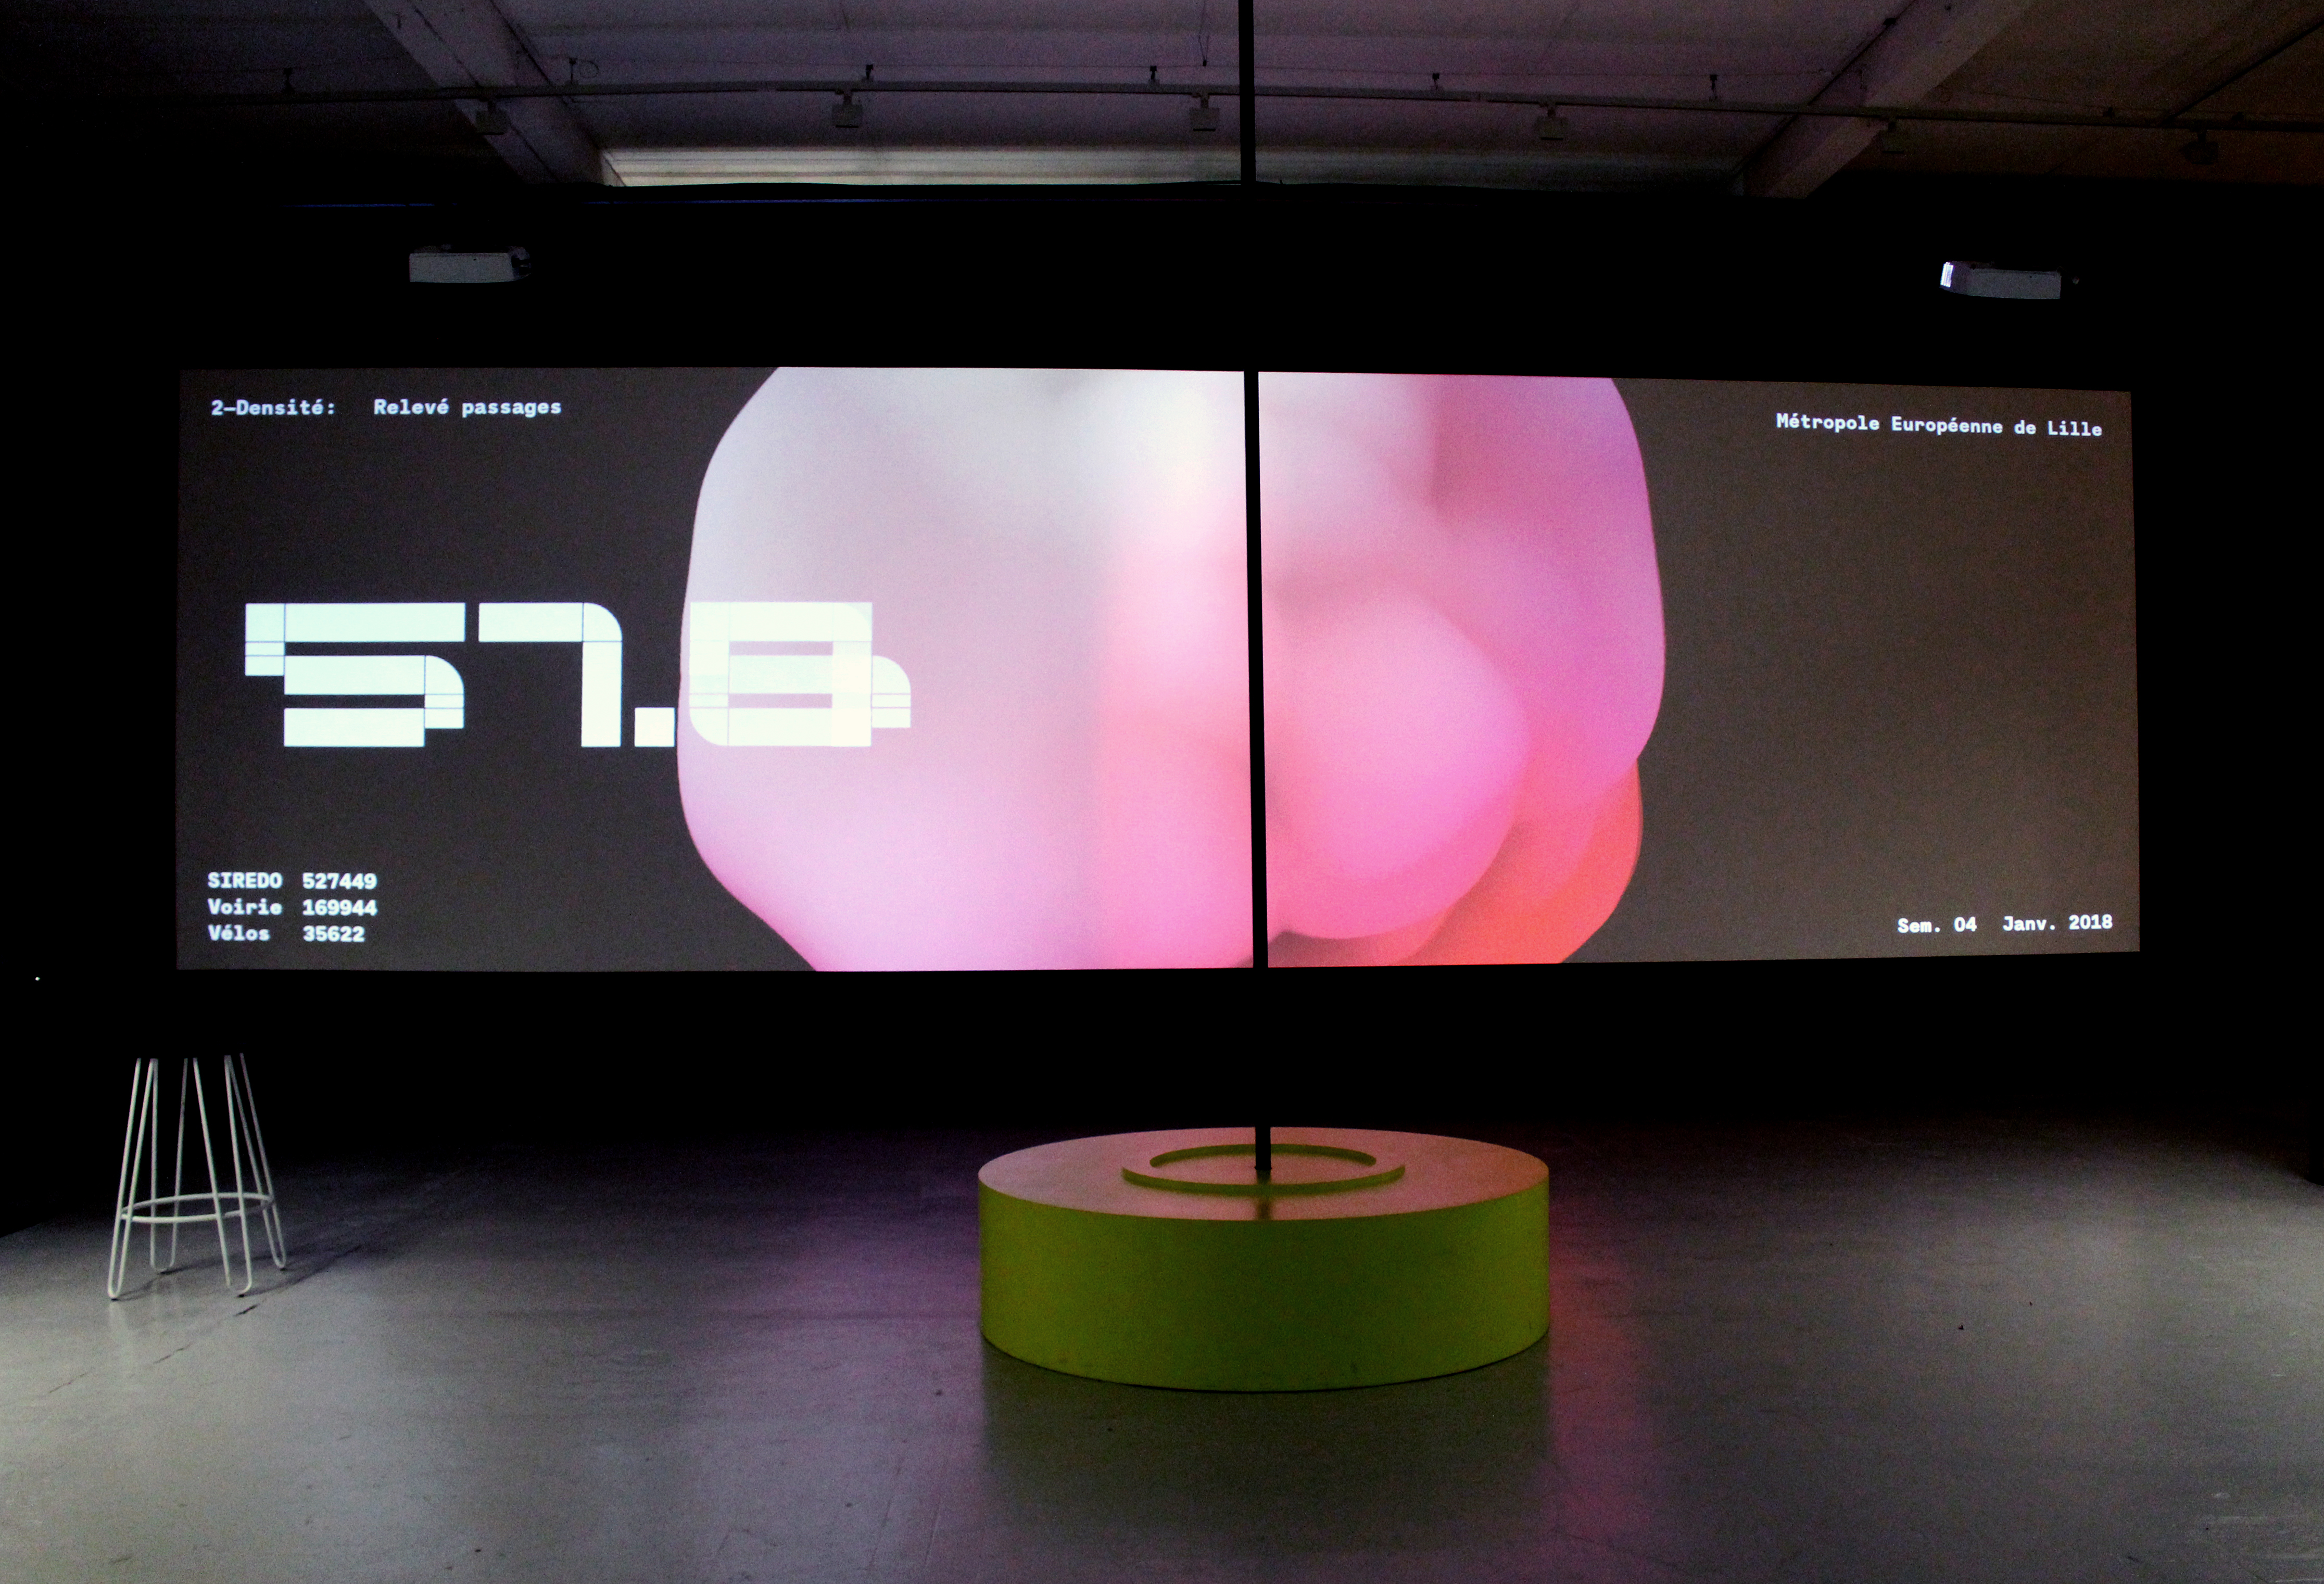
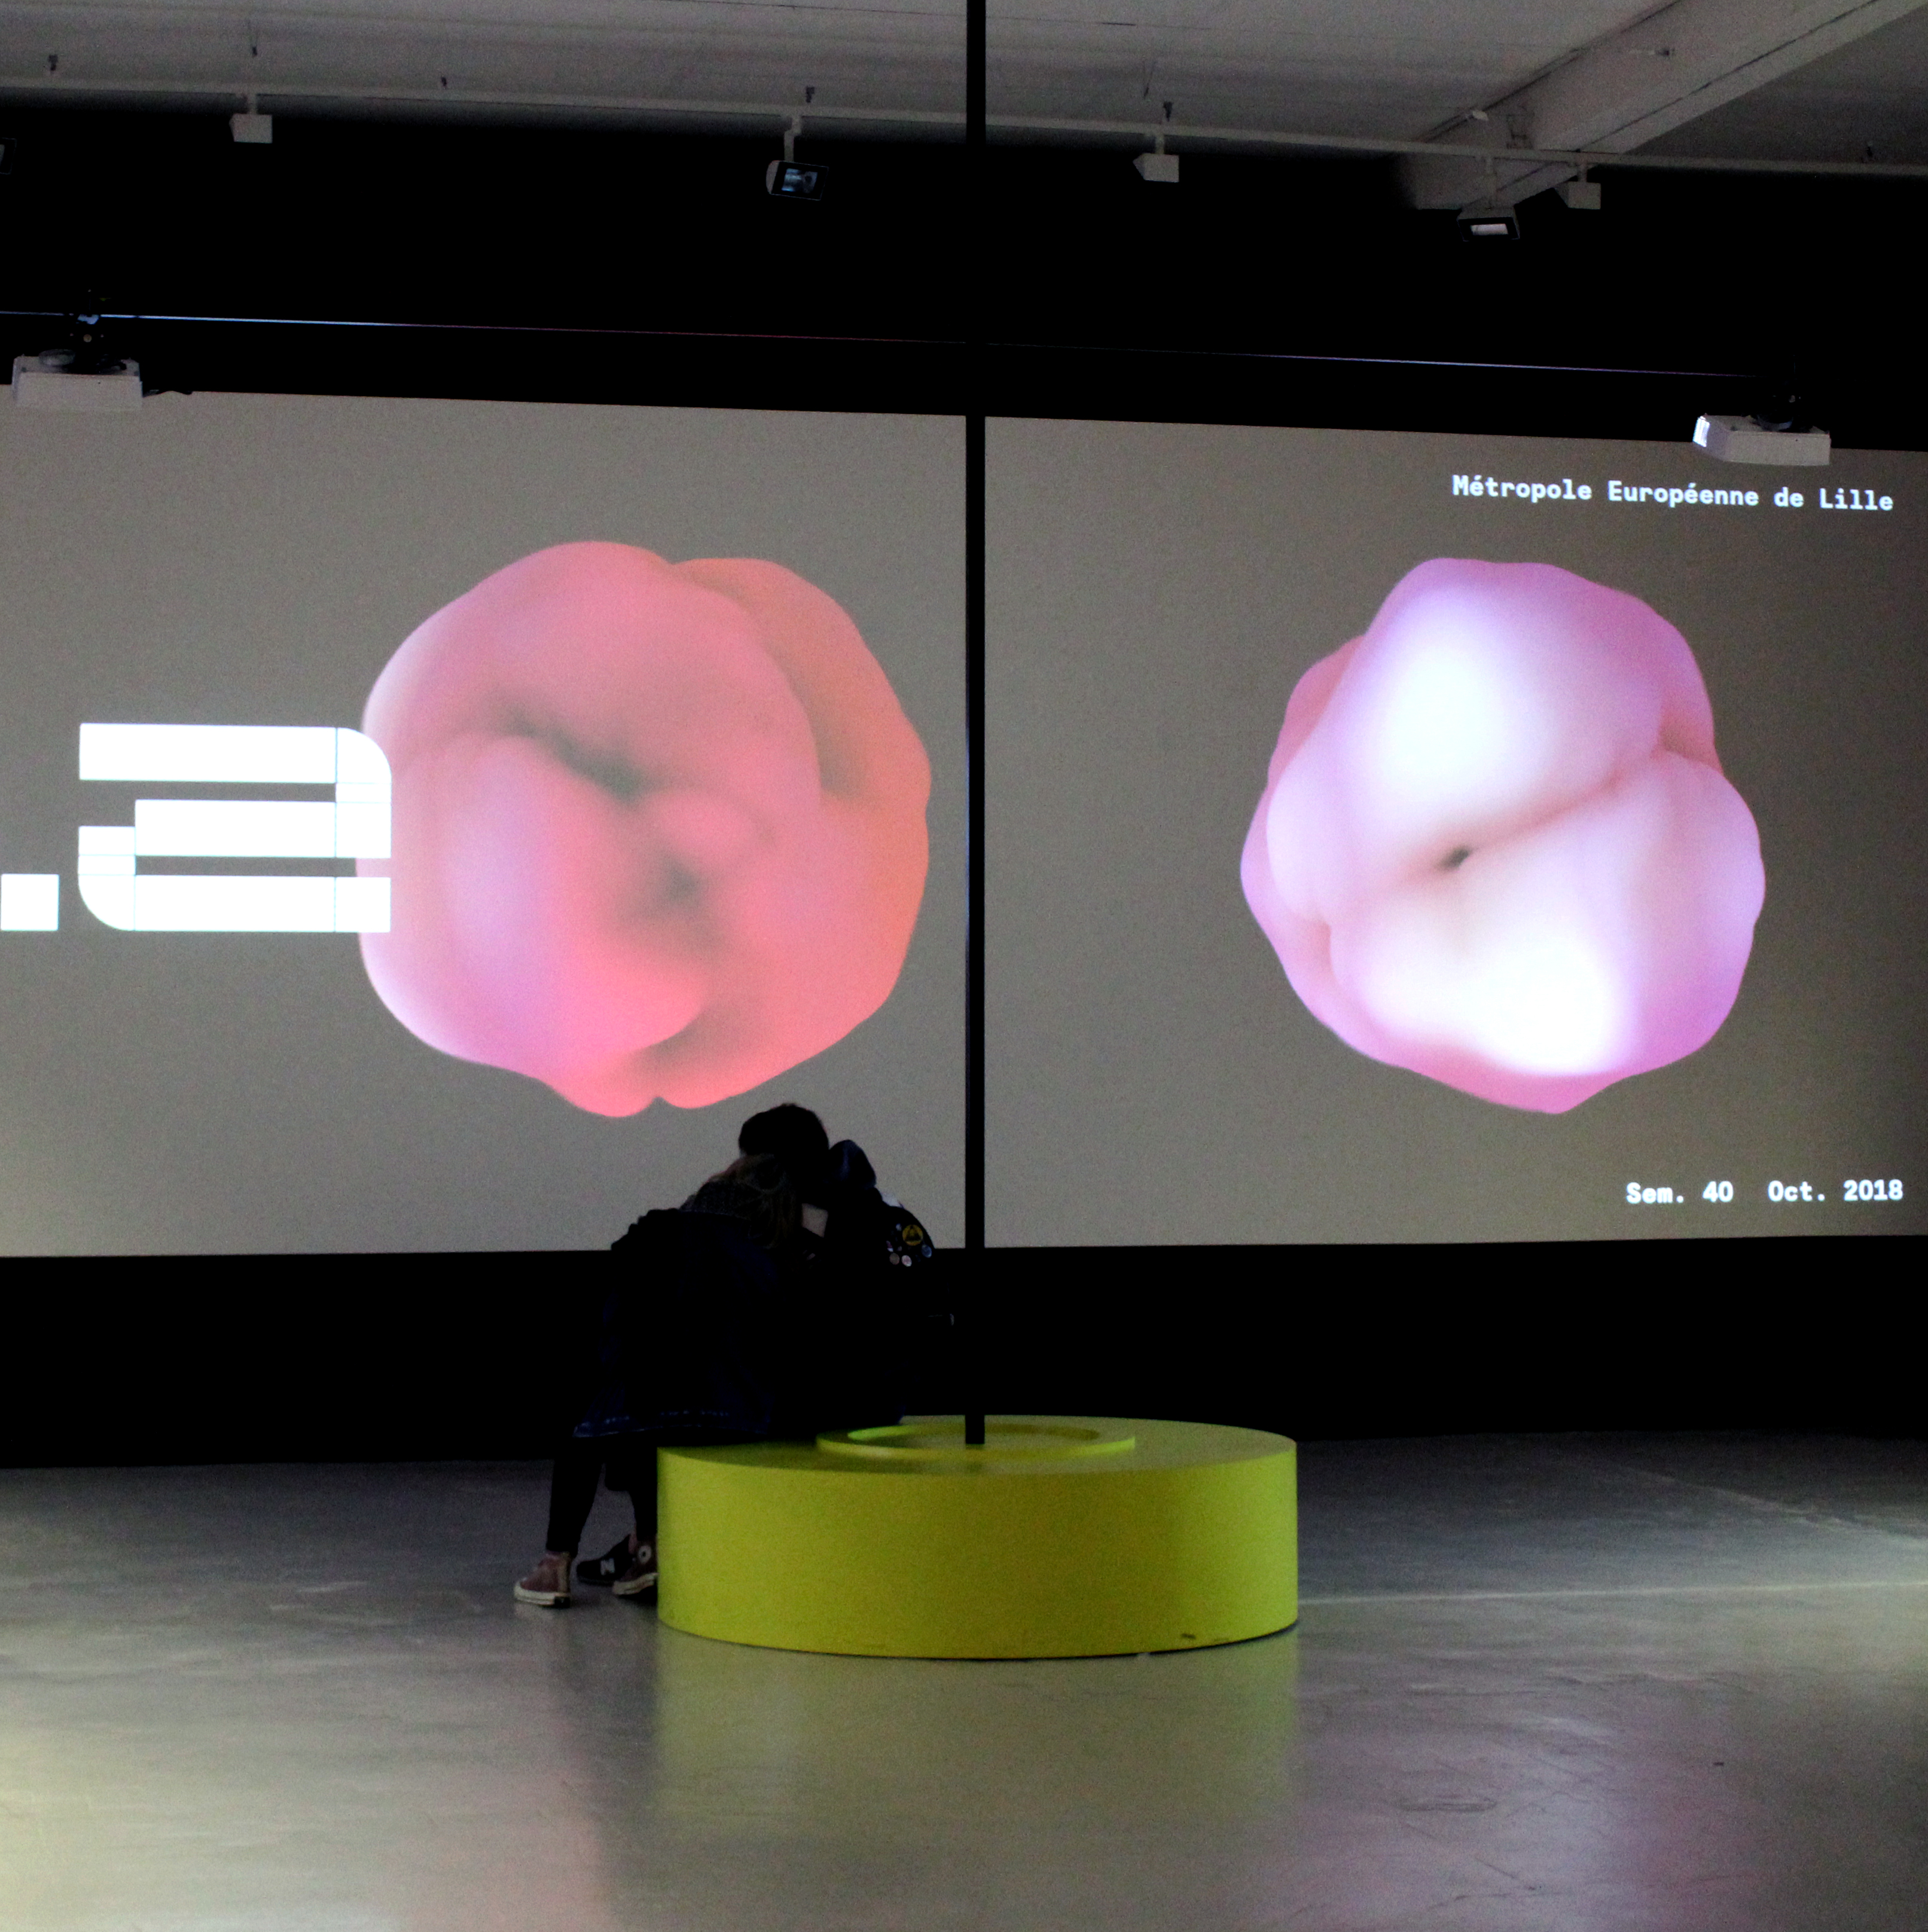
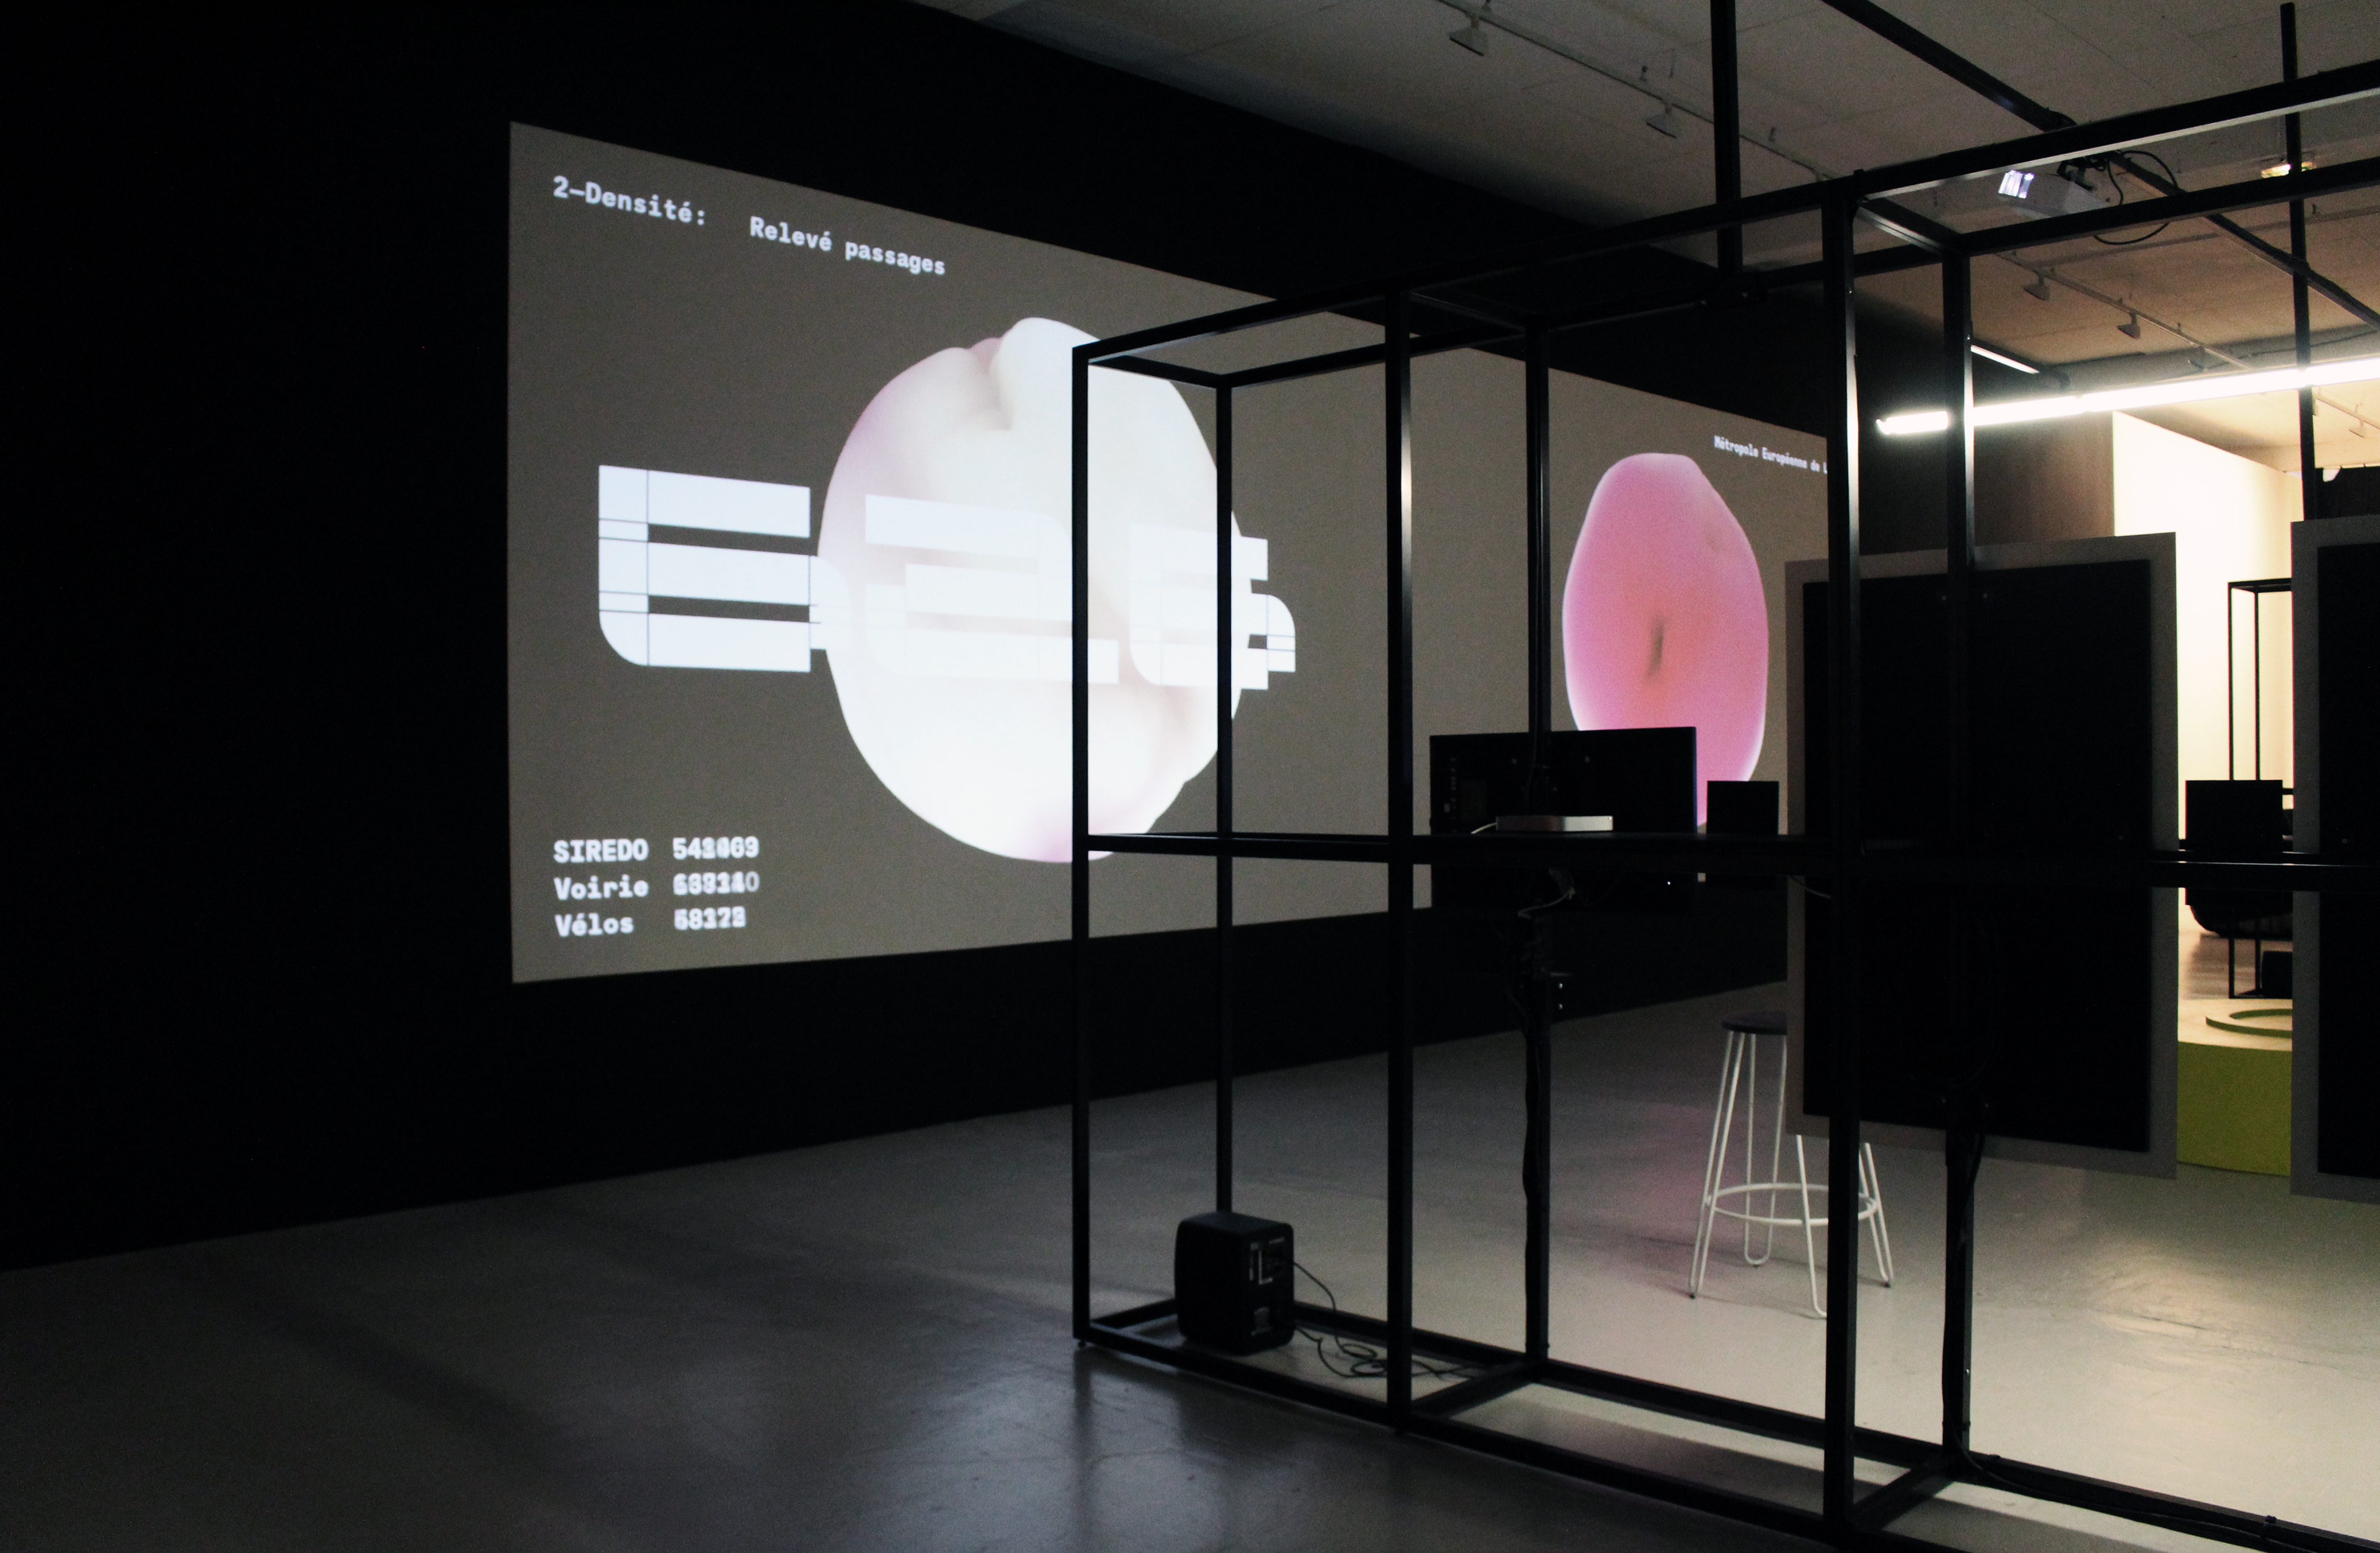
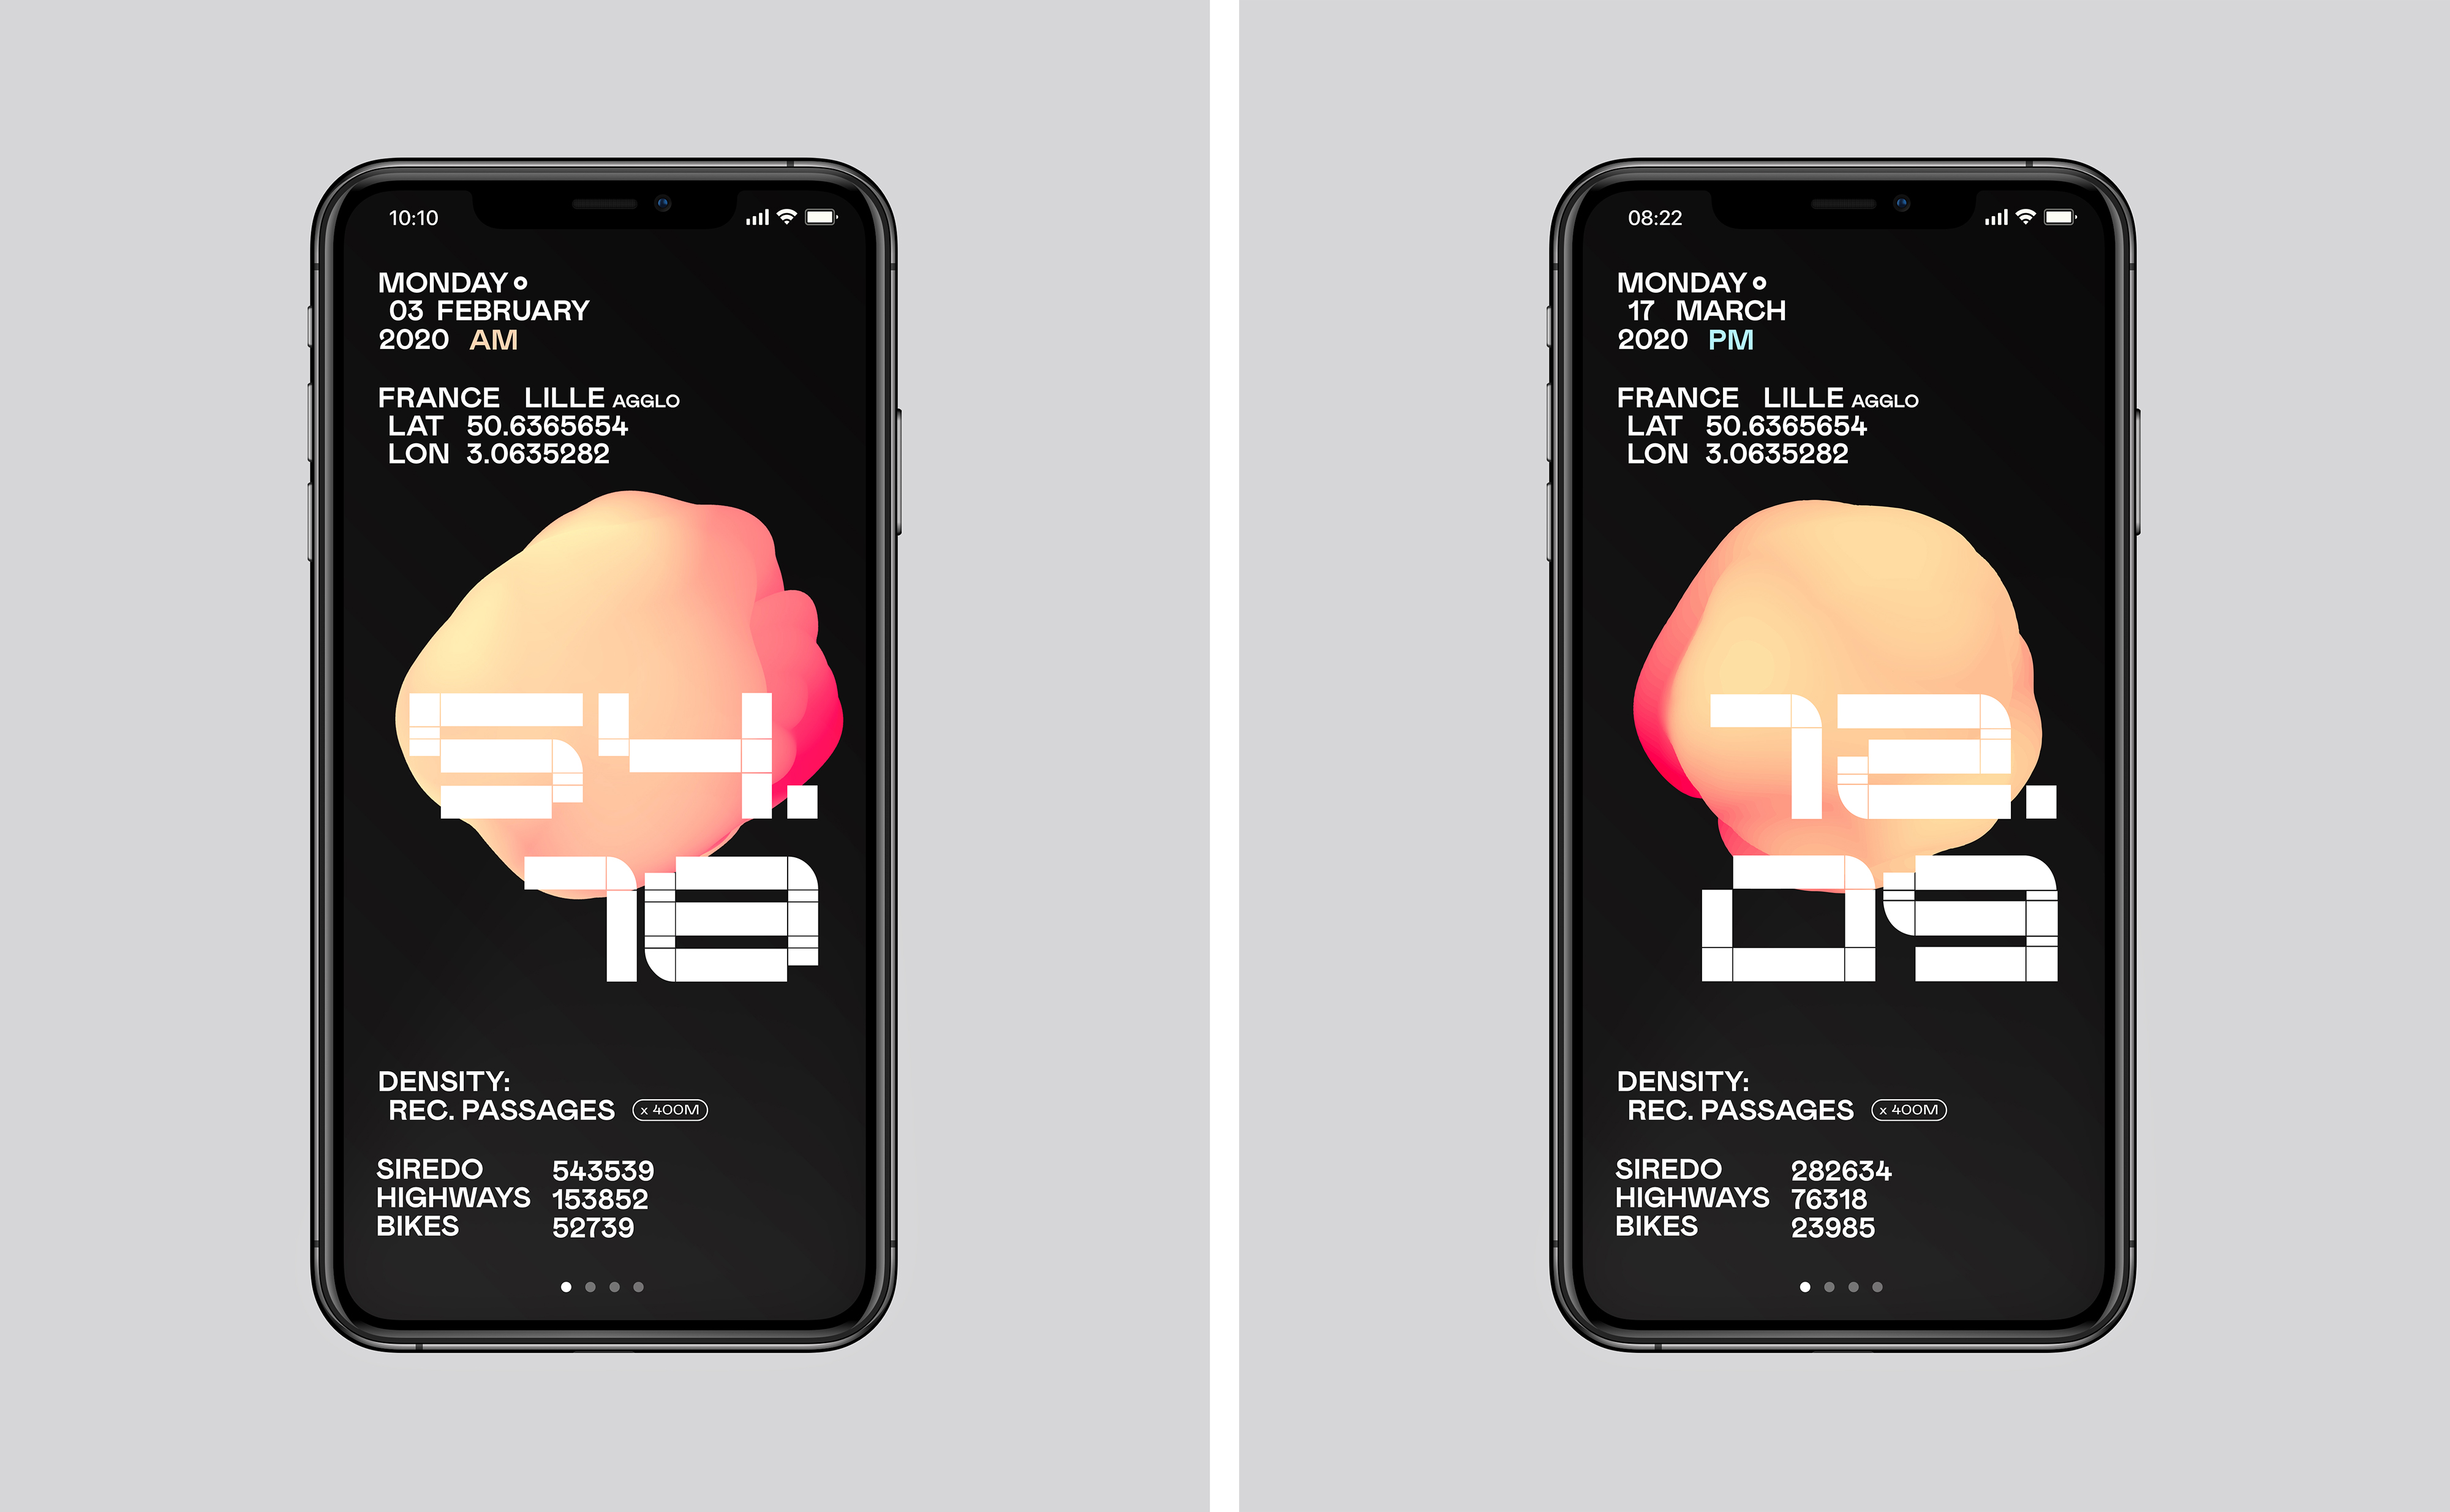
* The second (2) scene titled “Density” proposes to represent the global EML’s Motorized and Nonmotorized Vehicles Traffic Flows.
3 main indicators:
- « SIREDO » (SIREDO-type Road Traffic Counting System),
- « Voirie » (EML’s Highway Traffic Counting),
- « Vélos » (EML’s Bicycle Traffic Counting).
WIP Version:
First-Draft Version:
First Edited Version:
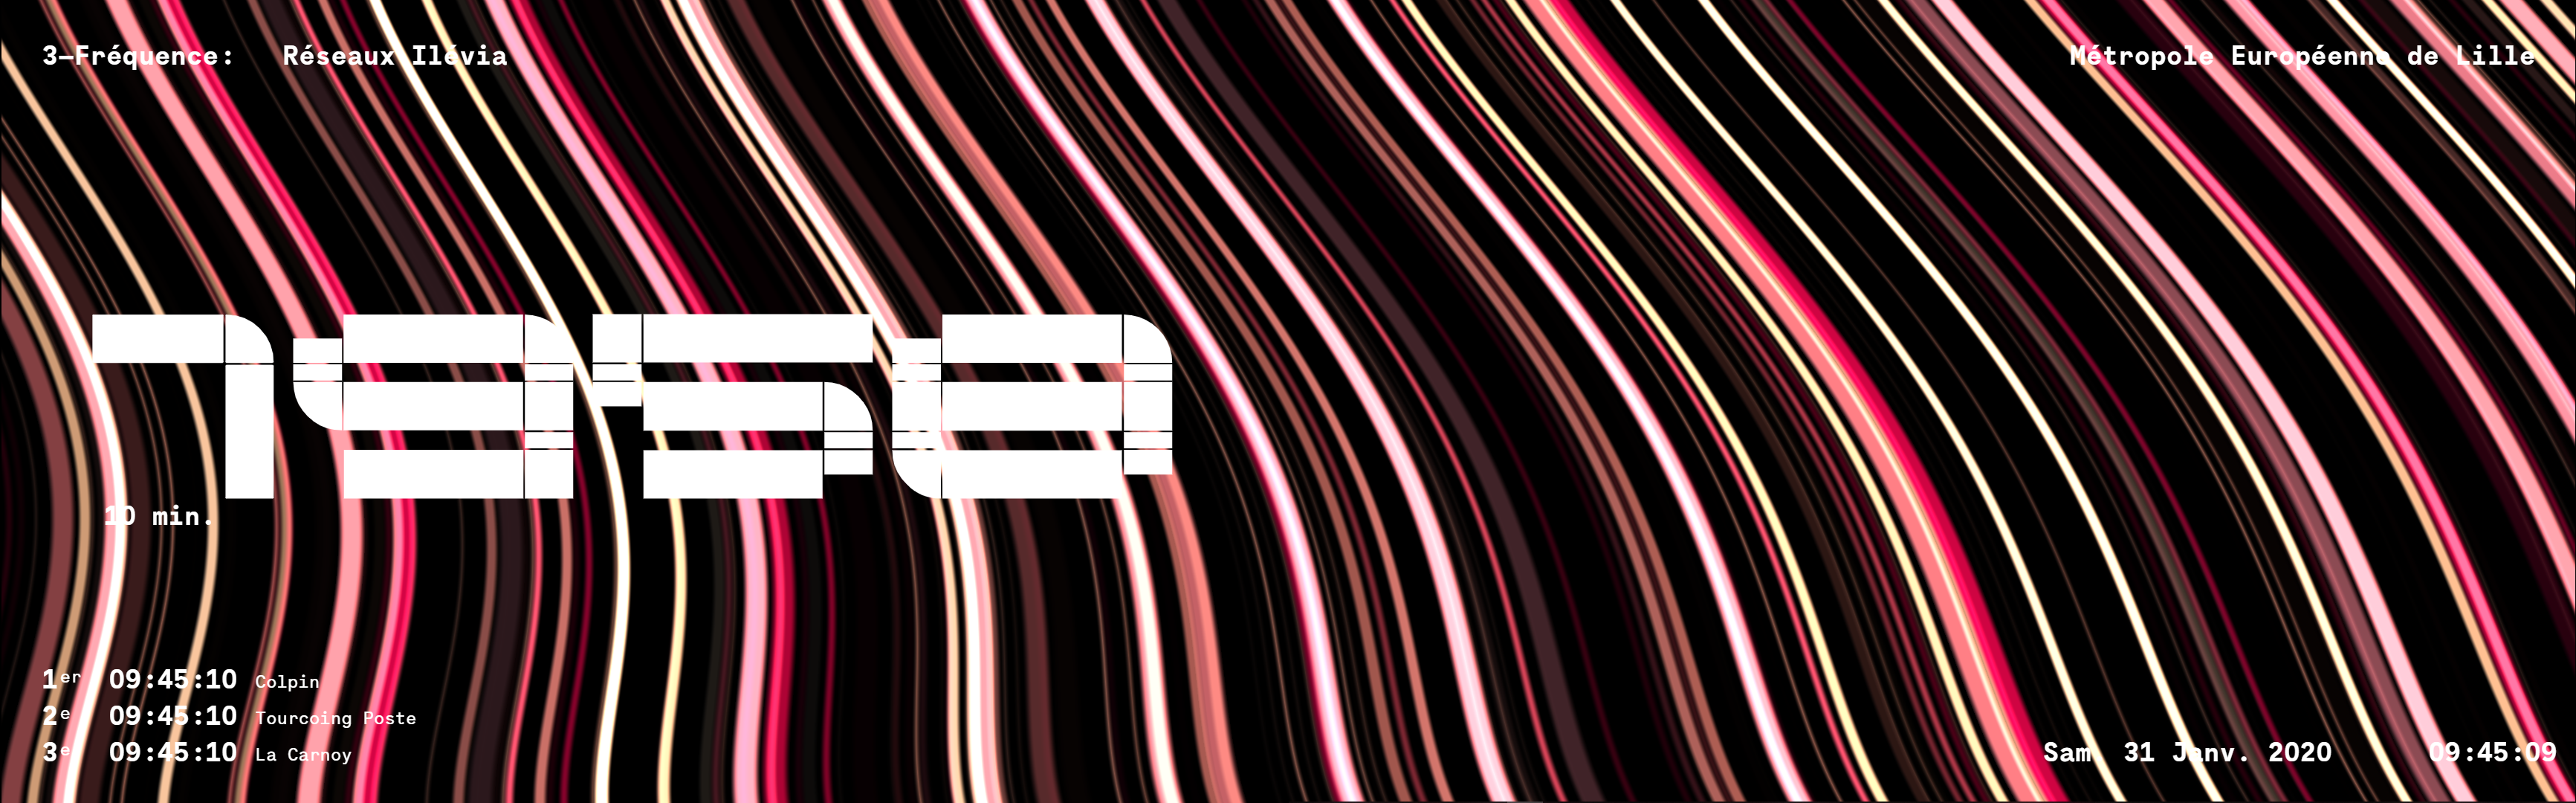
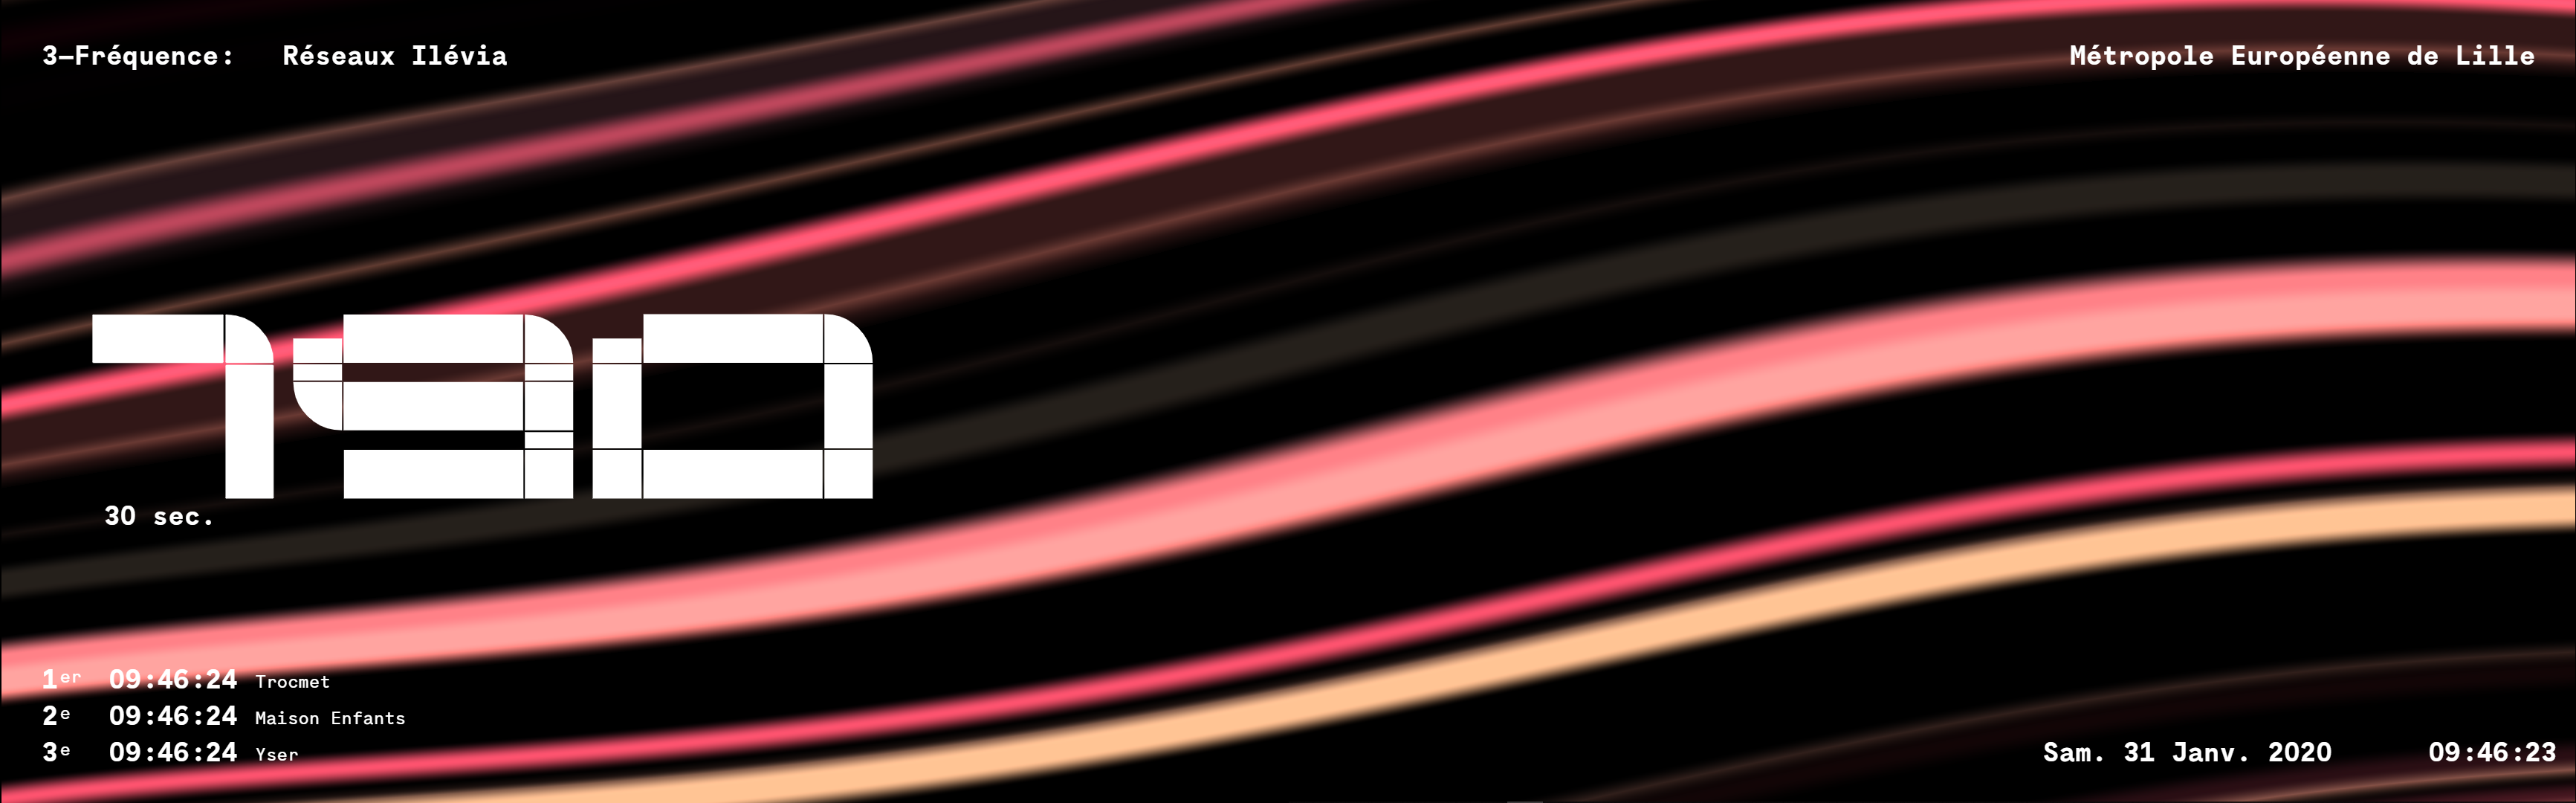
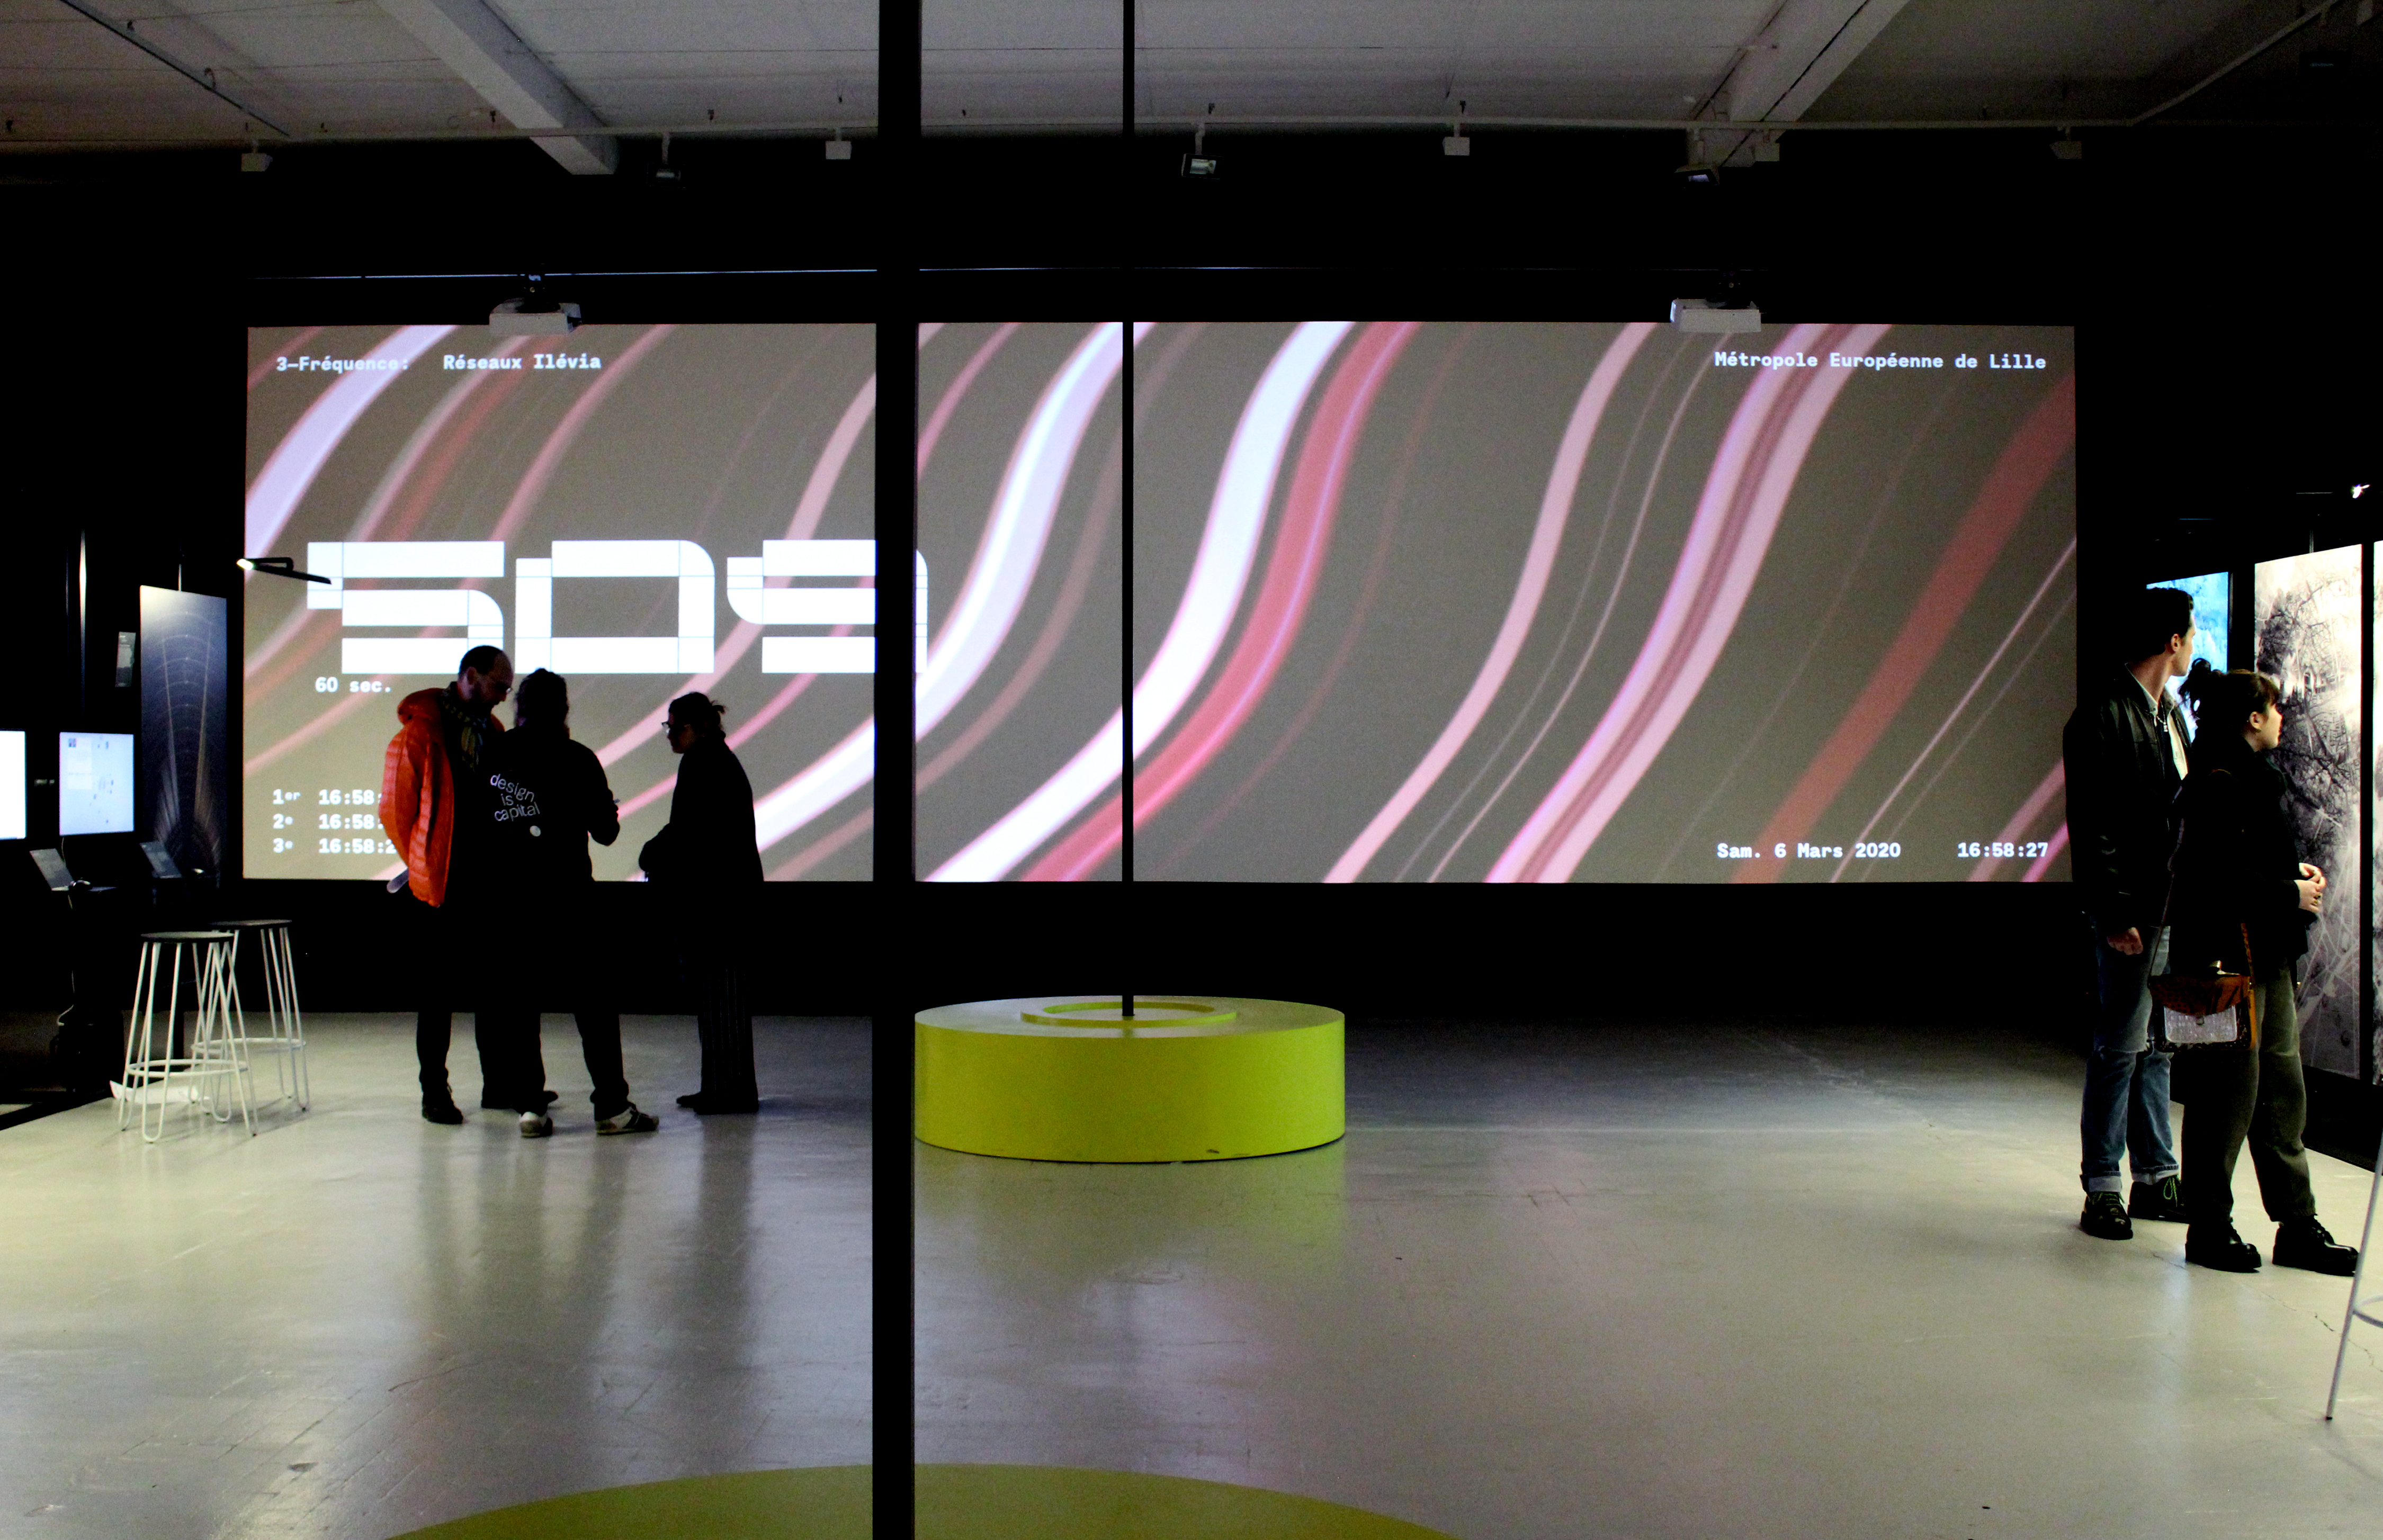
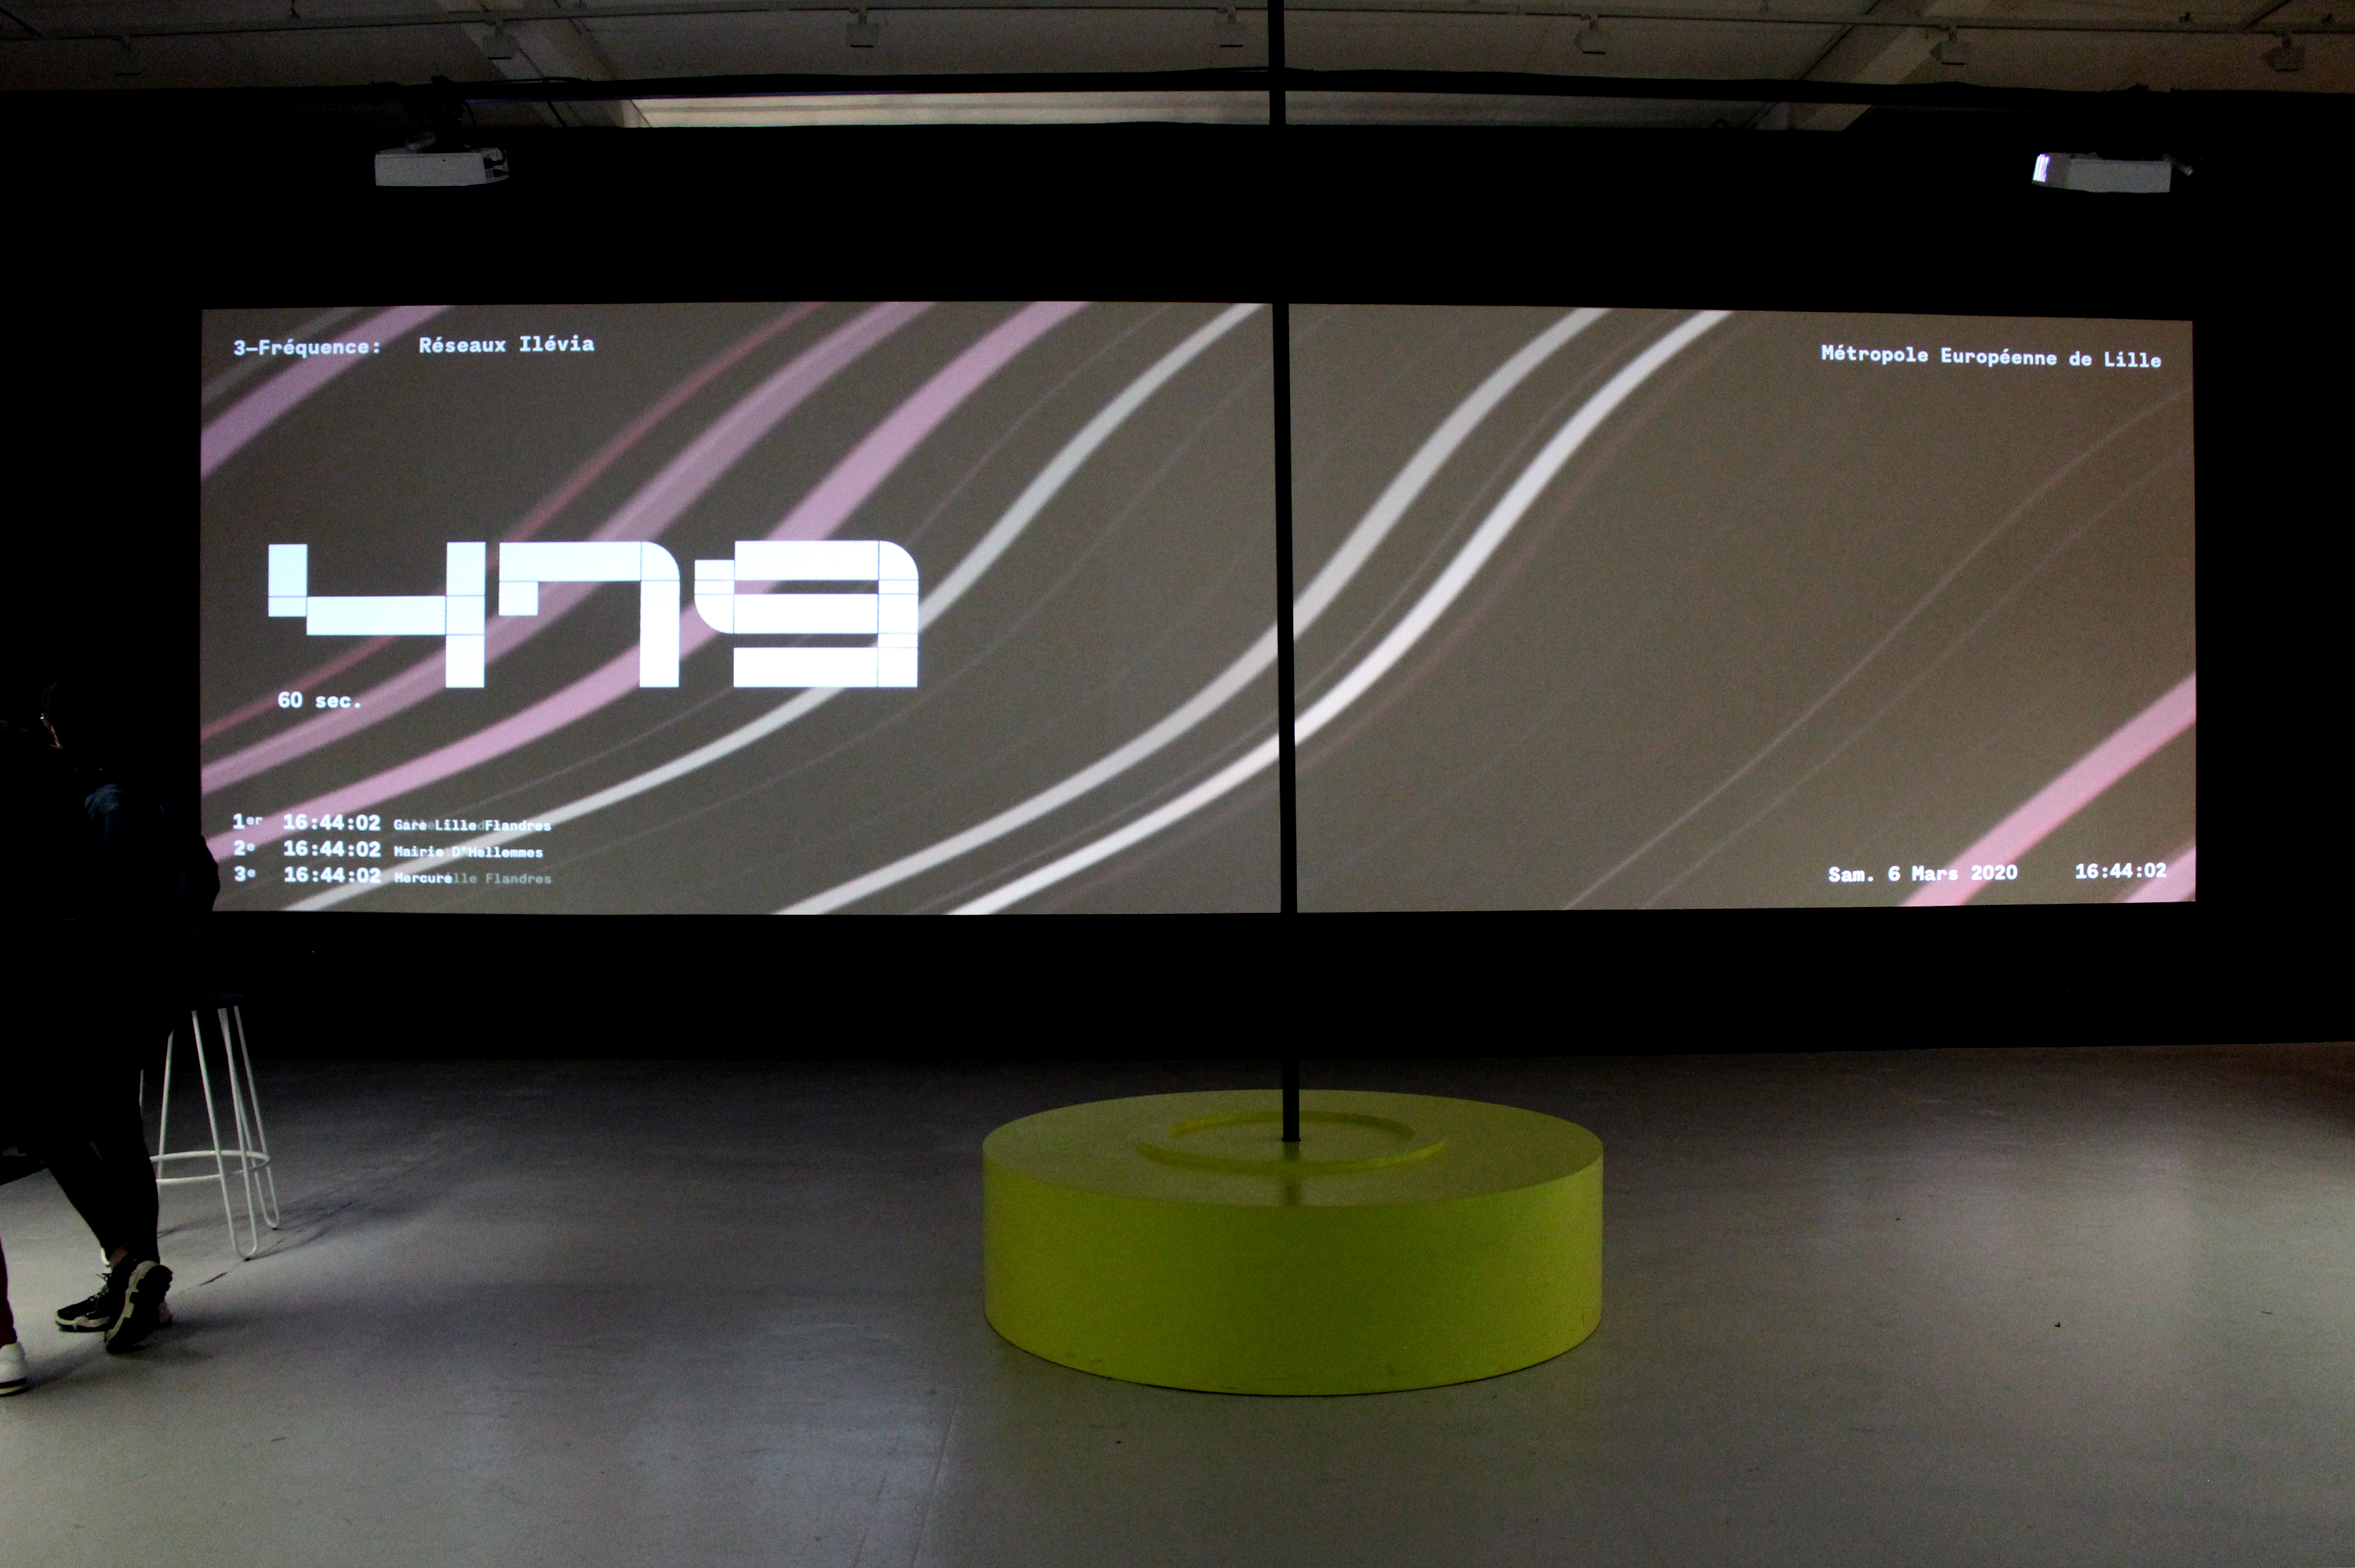
* The third (3) scene titled “Frequency” allows to (quantify, and) visualize in realtime the total Flow of the Illevia’s Network (crossings: bus, tram, metro).
WIP Version:


First-Draft Version:
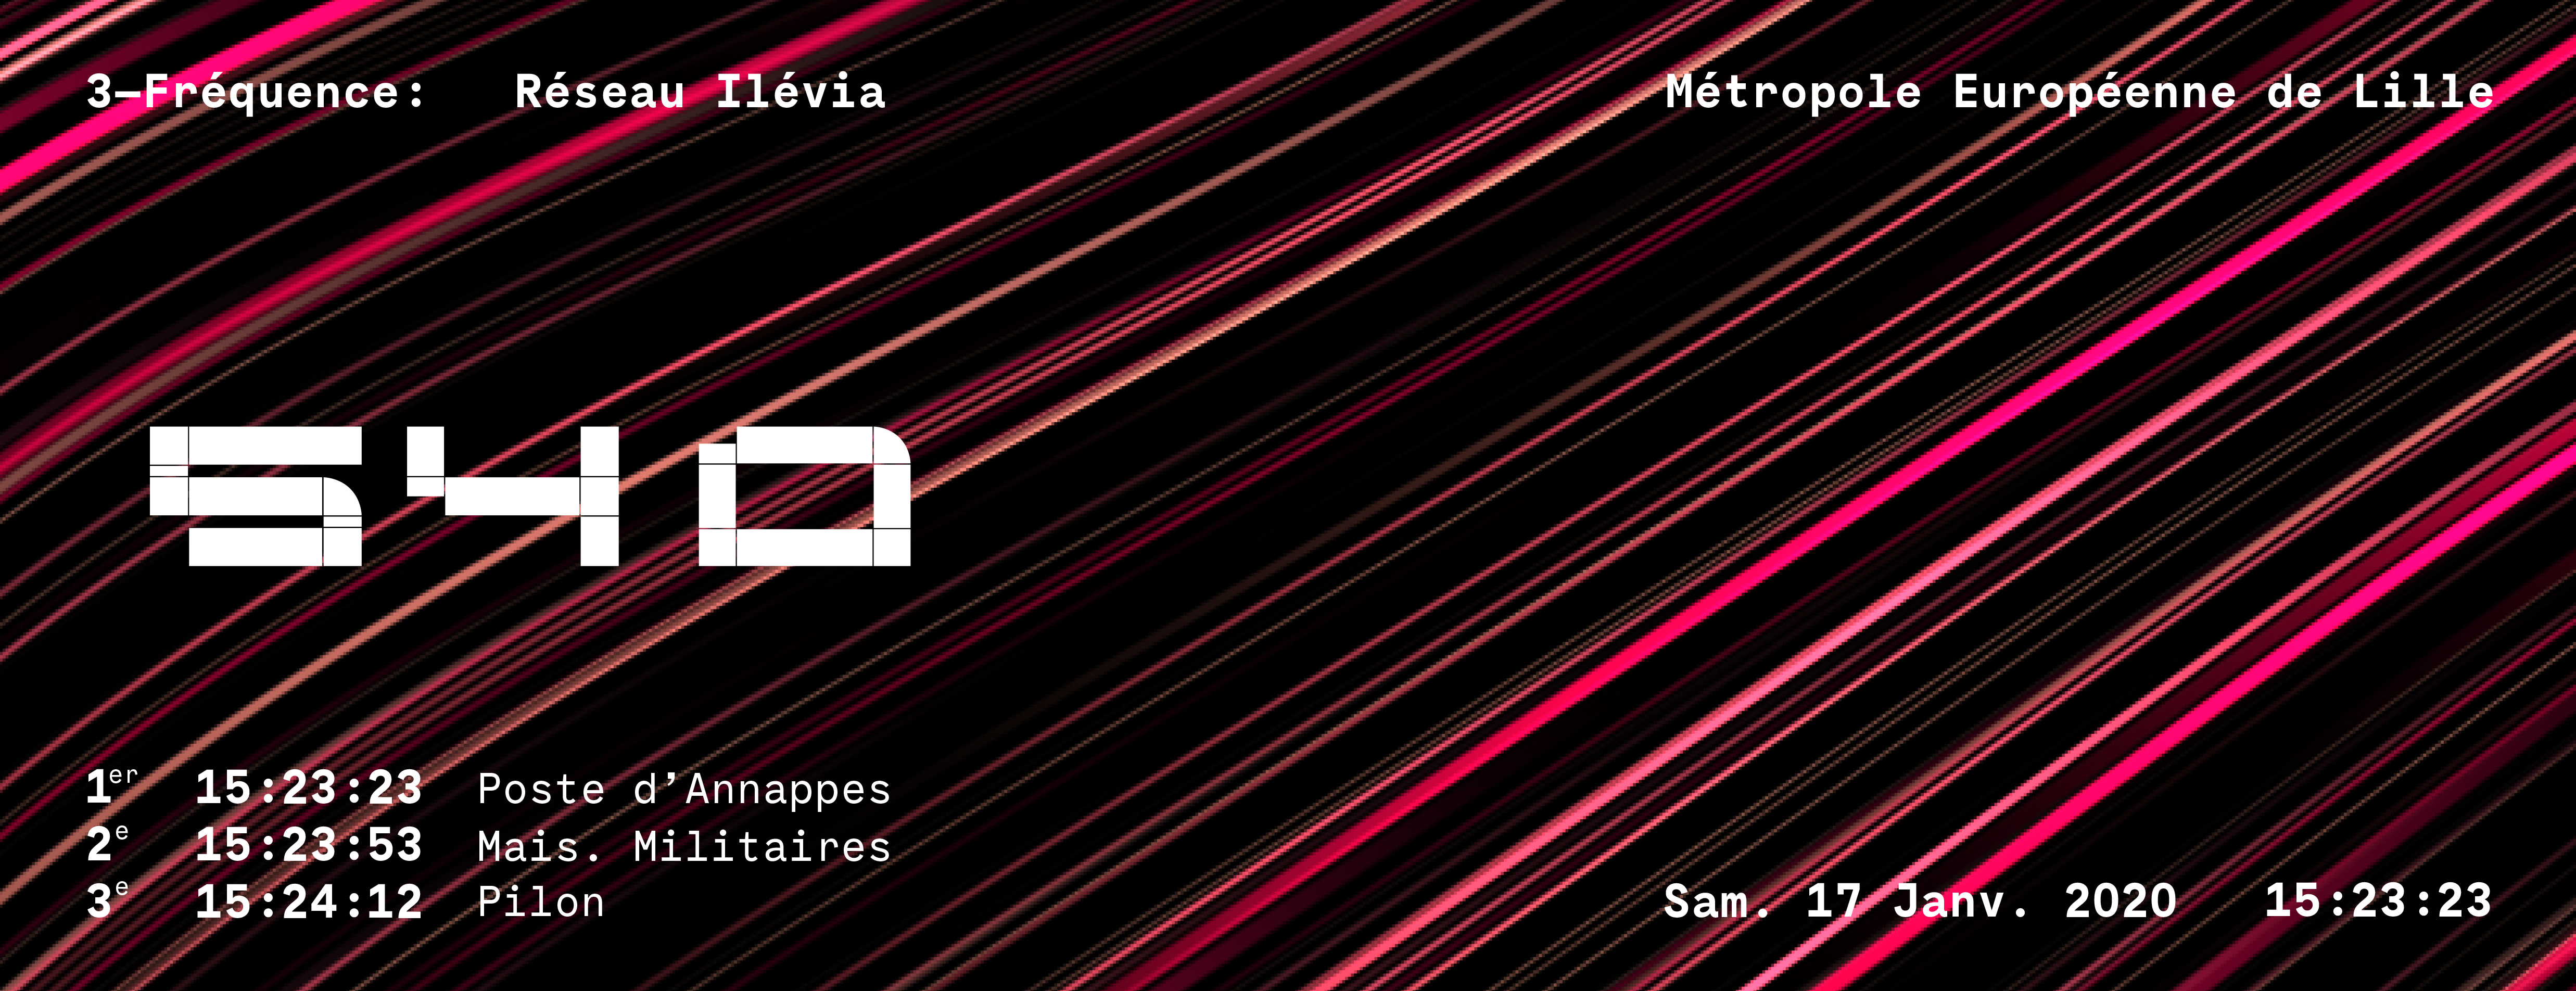
First Edited Version:
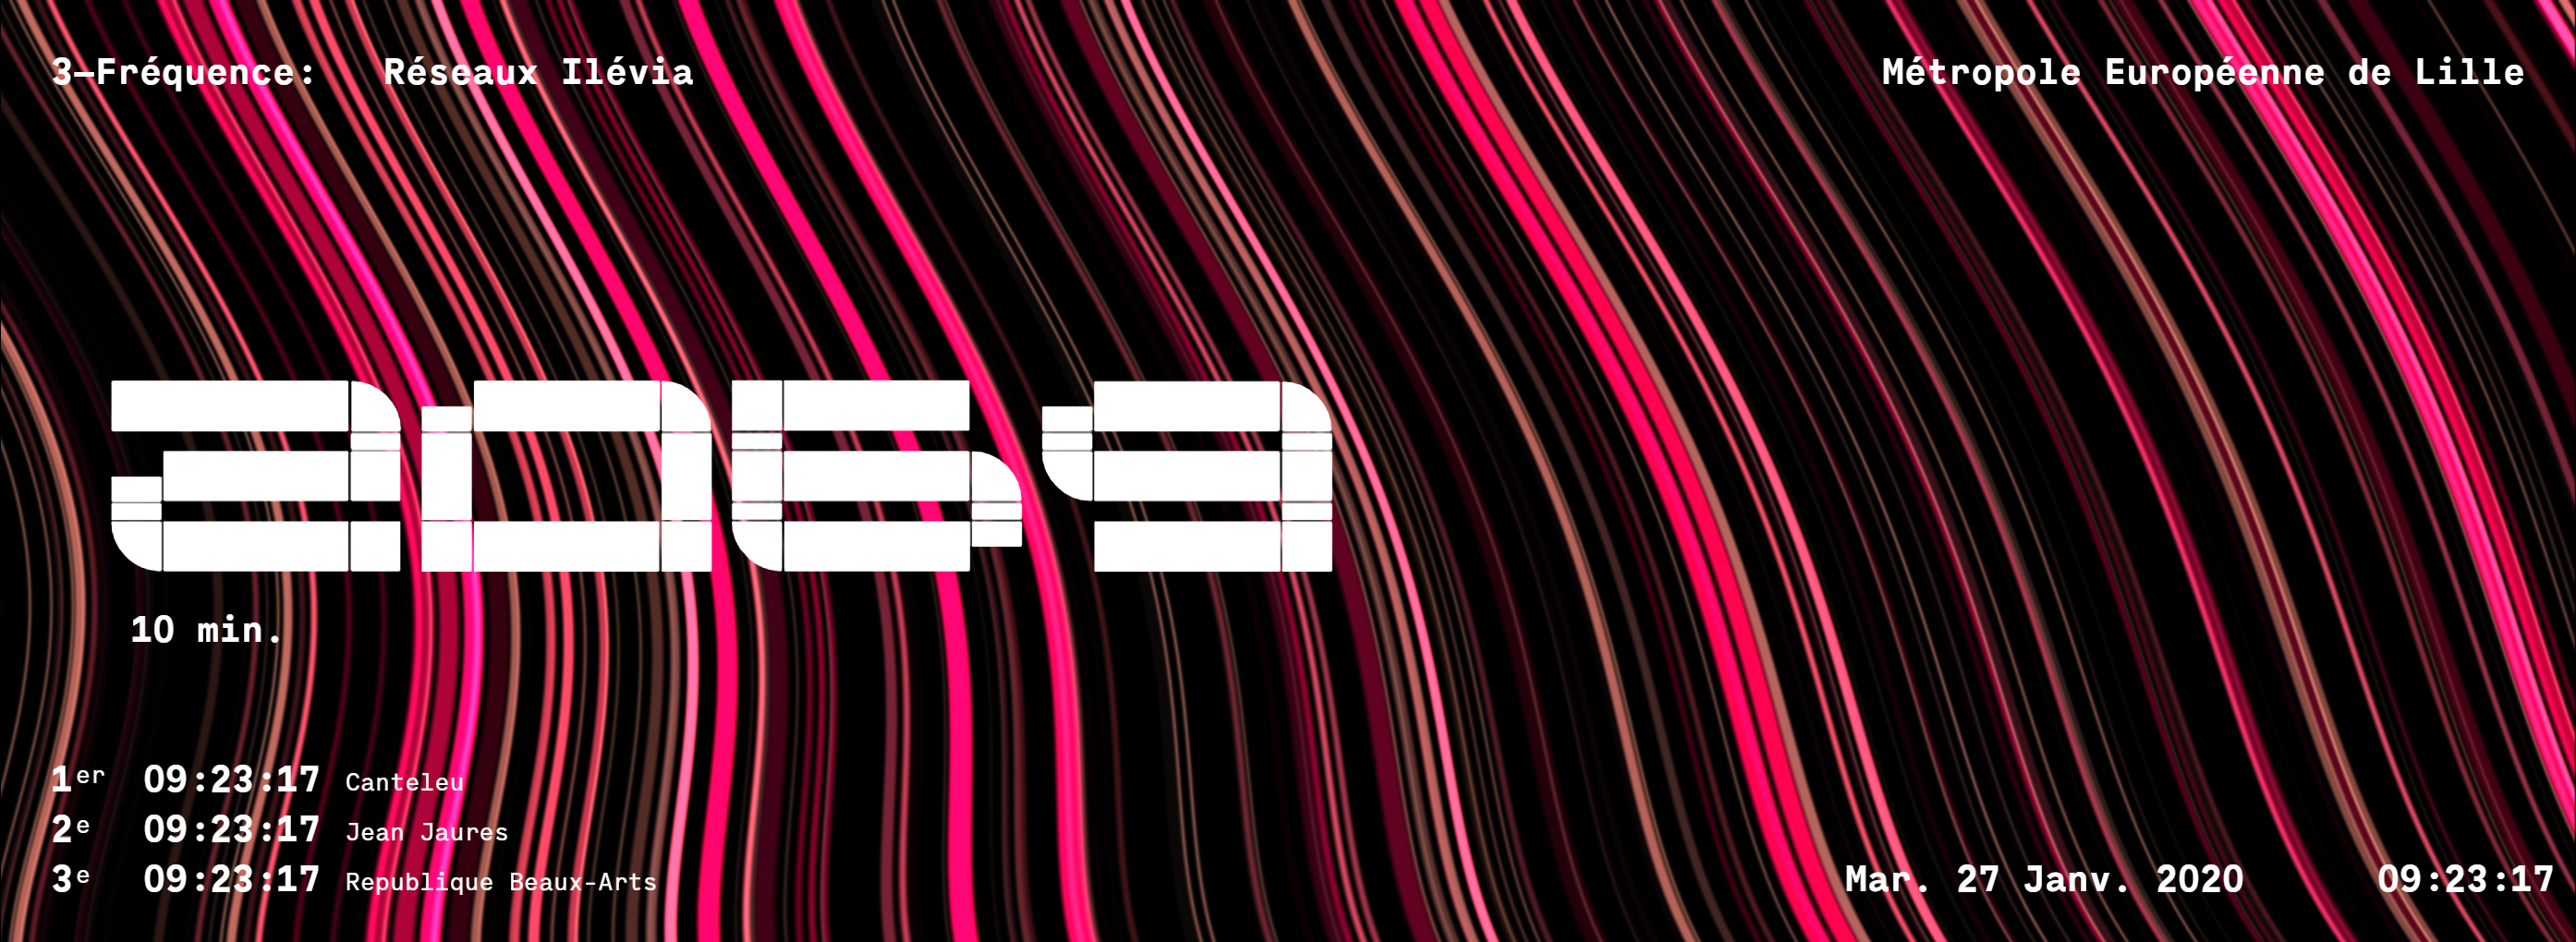
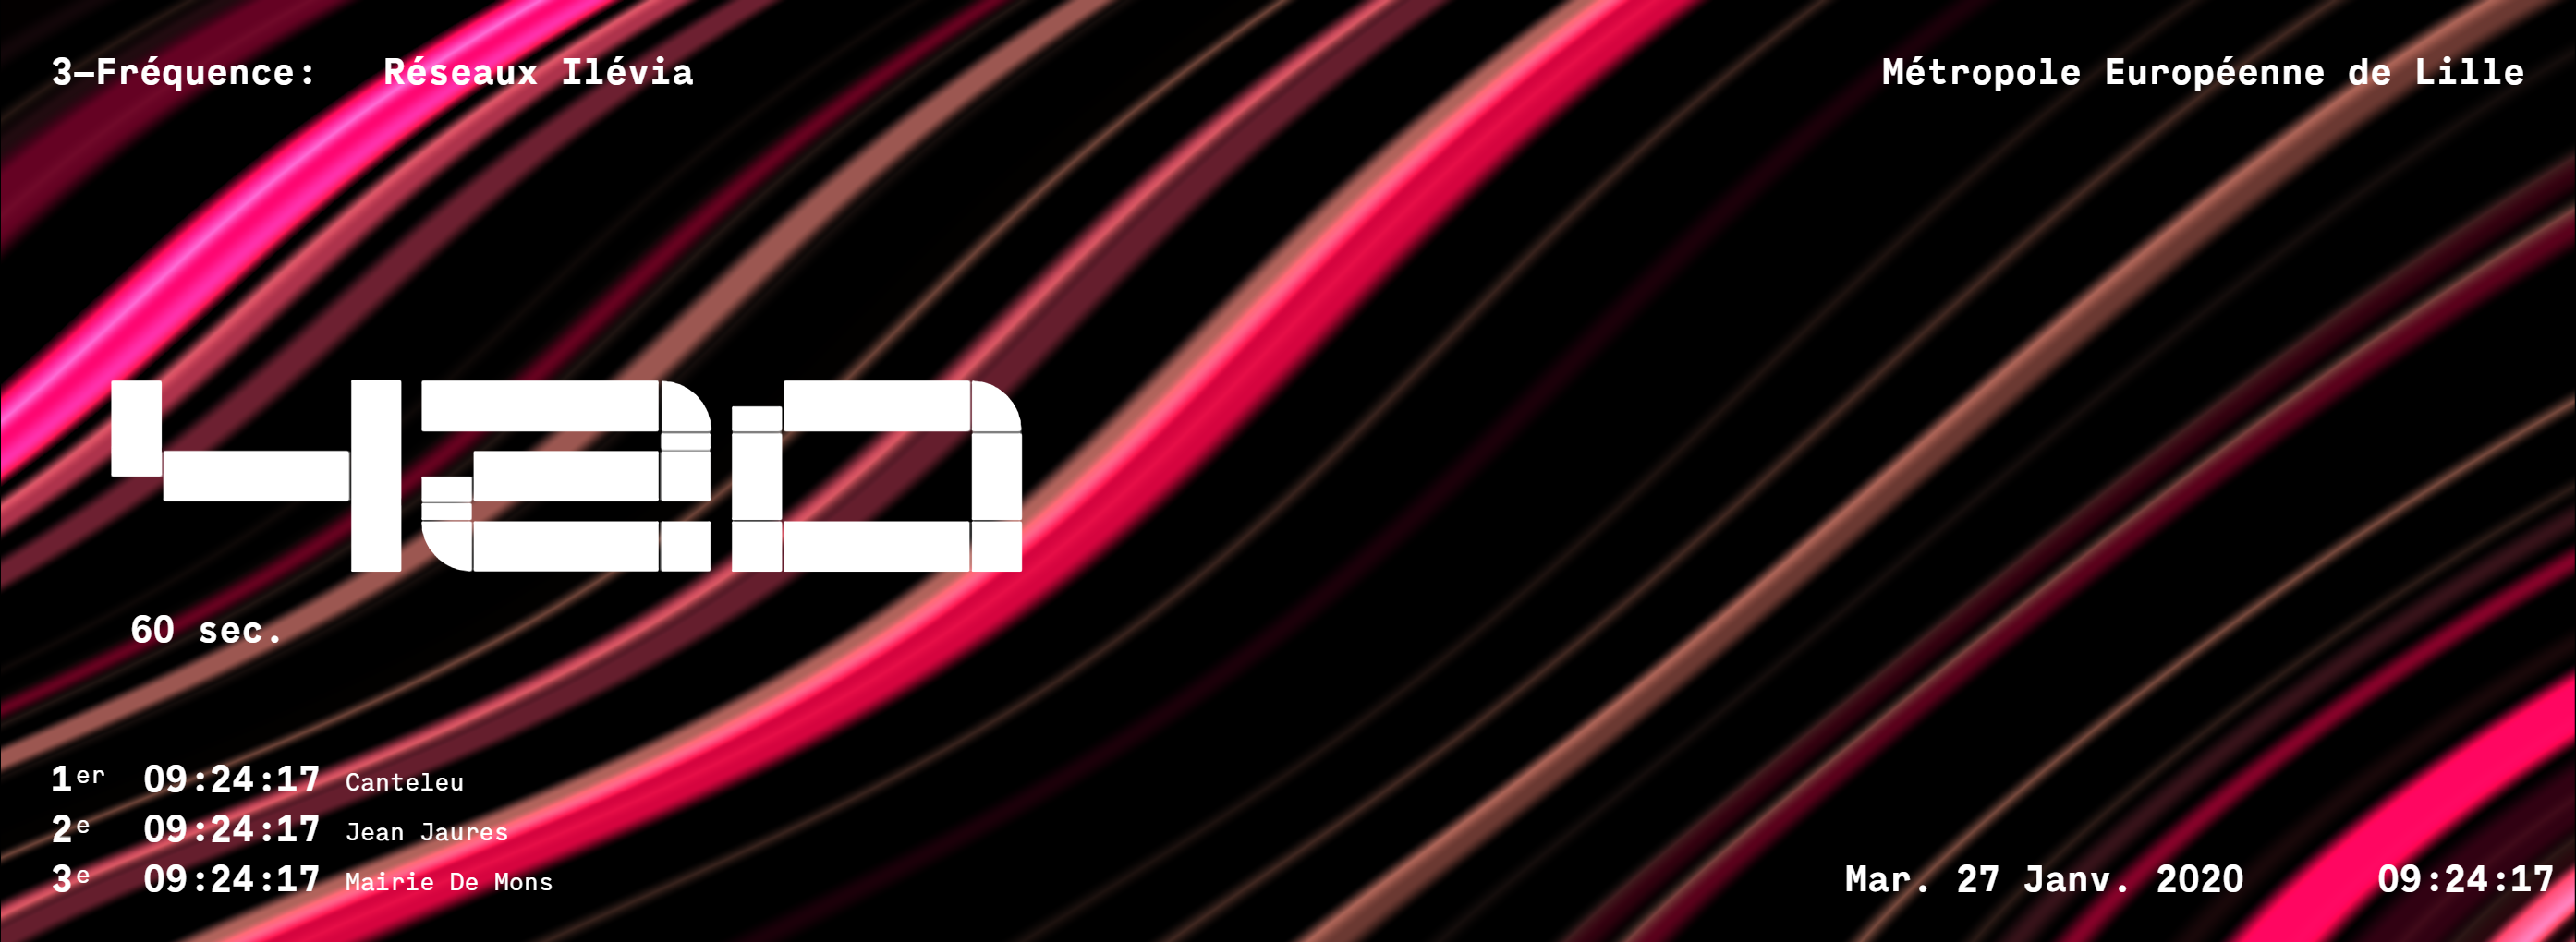
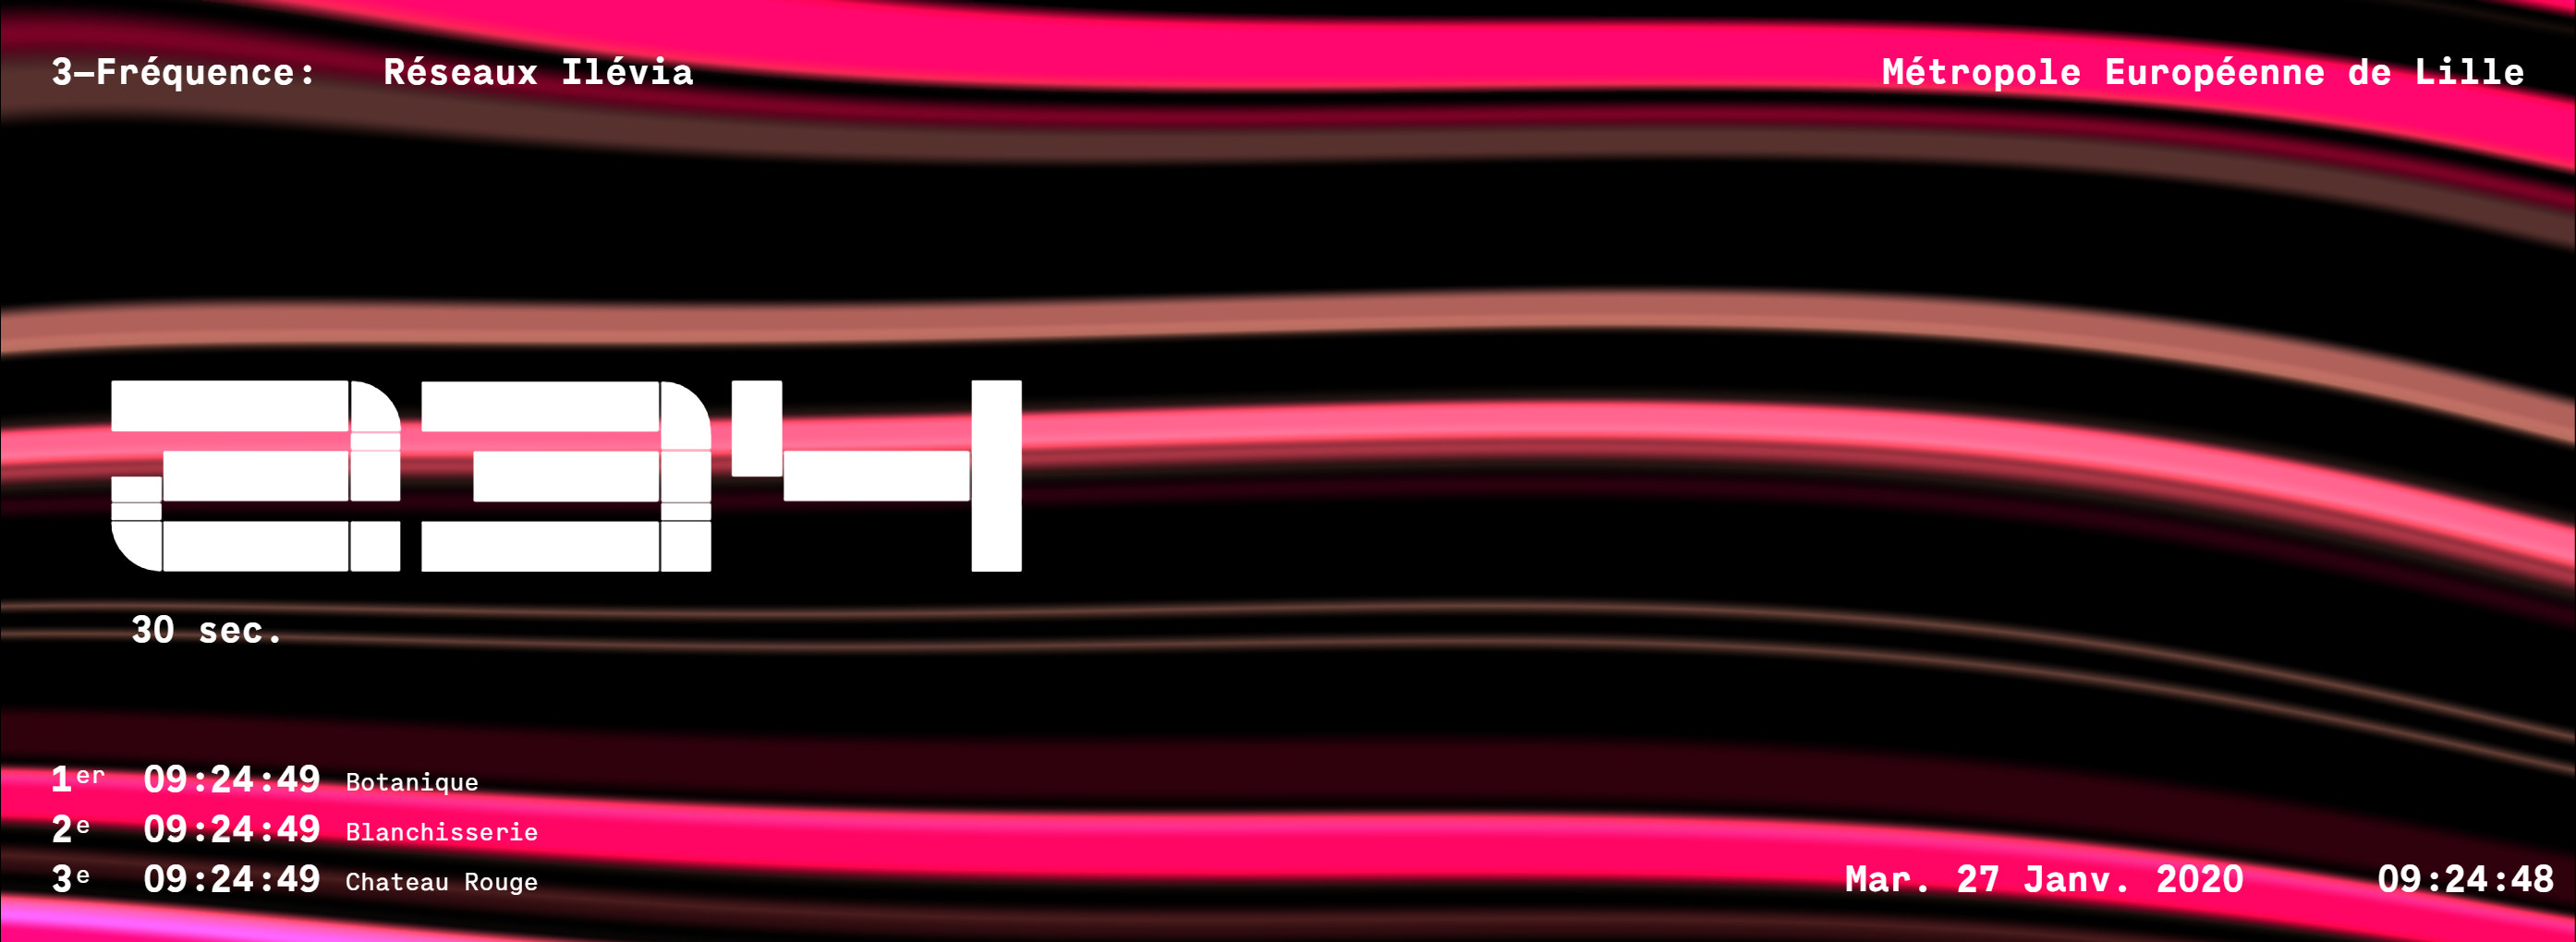
Second Edited Version:
All data have been extracted from the Opendata Lille Metropole portal.
Please note: the typeface (titled “Squared”) used for the Global Mobility Index Numbers was specially designed and published/edited by David Bihanic.
Images in the exhibition area
Video preview
2gApp: a mobile app version
We are examining the possibility to design a dedicated mobile app which processes realtime EML opendata.
Team
This project was designed (data design) and developed (data analysis and programming) with the collaboration of the creative studio Trafik, particularly Pierre Rodière, Joël Rodière, and Anthony Couret.
To mention: David Bihanic, Trafik, “2gather”, February 2020.