Mapping the rainfall accumulation accross the United States during the first half of 2015
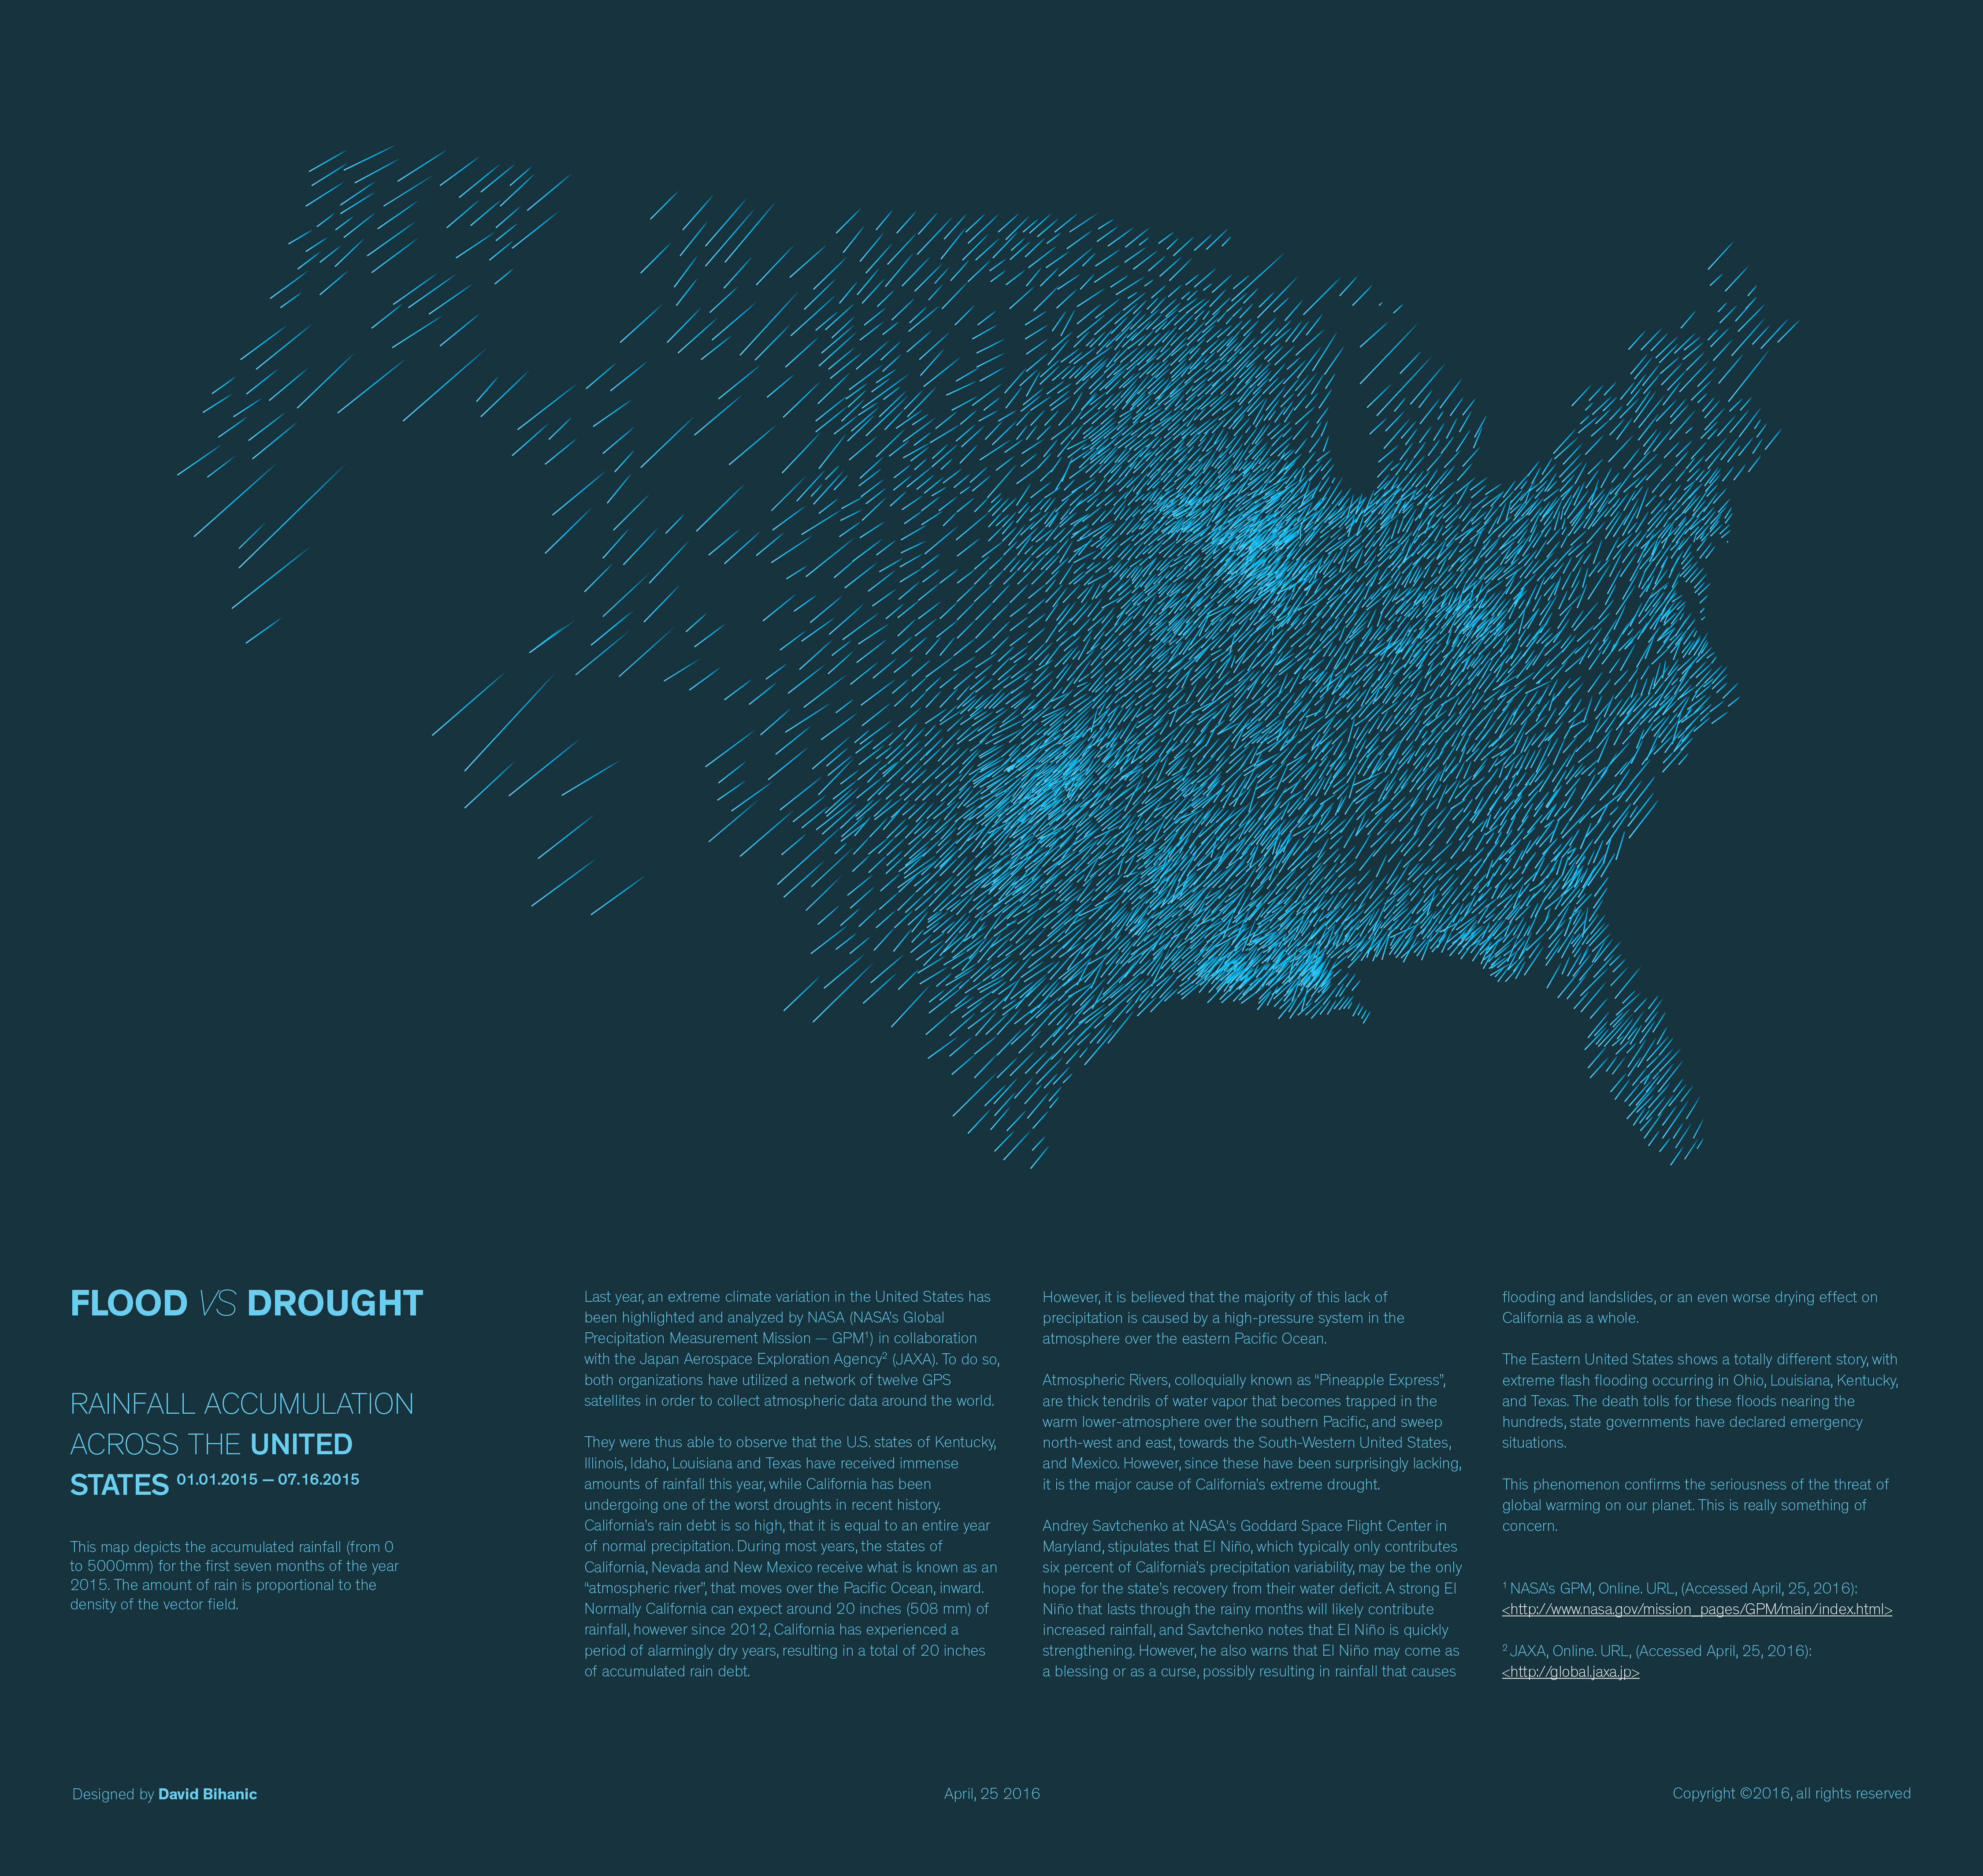
Last year (2015), an extreme climate variation in the United States has been highlighted and analyzed by NASA-GPM* (National Aeronautics and Space Administration’s Global Precipitation Measurement Mission) in collaboration with the Japan Aerospace Exploration Agency** (JAXA). To do so, both organizations have utilized a network of twelve GPS satellites in order to collect atmospheric data around the world. They were thus able to observe that the U.S. states of Kentucky, Illinois, Idaho, Louisiana and Texas have received immense amounts of rainfall this year, while California has been undergoing one of the worst droughts in recent history. California’s rain debt is so high, that it is equal to an entire year of normal precipitation. During most years, the states of California, Nevada and New Mexico receive what is known as an “atmospheric river”, that moves over the Pacific Ocean, inward. Normally California can expect around 20 inches (508 mm) of rainfall, however since 2012, California has experienced a period of alarmingly dry years, resulting in a total of 20 inches of accumulated rain debt. However, it is believed that the majority of this lack of precipitation is caused by a high-pressure system in the atmosphere over the eastern Pacific Ocean. Atmospheric Rivers, colloquially known as “Pineapple Express”, are thick tendrils of water vapor that becomes trapped in the warm lower-atmosphere over the southern Pacific, and sweep north-west and east, towards the South-Western United States, and Mexico. However, since these have been surprisingly lacking, it is the major cause of California’s extreme drought. Andrey Savtchenko at NASA’s Goddard Space Flight Center in Maryland, stipulates that El Niño, which typically only contributes six percent of California’s precipitation variability, may be the only hope for the state’s recovery from their water deficit. A strong El Niño that lasts through the rainy months will likely contribute increased rainfall, and Savtchenko notes that El Niño is quickly strengthening. However, he also warns that El Niño may come as a blessing or as a curse, possibly resulting in rainfall that causes flooding and landslides, or an even worse drying effect on California as a whole. The Eastern United States shows a totally different story, with extreme flash flooding occurring in Ohio, Louisiana, Kentucky, and Texas. The death tolls for these floods nearing the hundreds, state governments have declared emergency situations. In Texas and Oklahoma alone, the May 2015 flooding will likely have caused damages in excess of three billion US Dollars. The city of Corsicana, Texas saw ten inches of rainfall in three hours, which resulted in flash floods, killing one man and injuring numerous others. This phenomenon confirms the seriousness of the threat of global warming on our planet. This is really something of concern. Based on a GPM-IMERG (a data processing method known as Integrated Multi-satellitE Retrievals) satellite-based precipitation dataset produced by the NASA-GPM, I’ve drawn this graphical reinterpretation using D3.js. The vector field (which depicting the rains) is a dynamic conversion of the accumulated rainfall (from 0 to 5000mm) for the first seven months of the year 2015. The amount of rain is here proportional to the density of the vector field.
* NASA’s GPM, Online. URL, (Accessed April, 25, 2016): click here
** JAXA, Online. URL, (Accessed April, 25, 2016): click here
(Click to enlarge image)
This data visualization was designed and coded by David Bihanic (2016).
Animation
Animation coding (C++, OpenGL) by Trafik (2019).
Exhibition
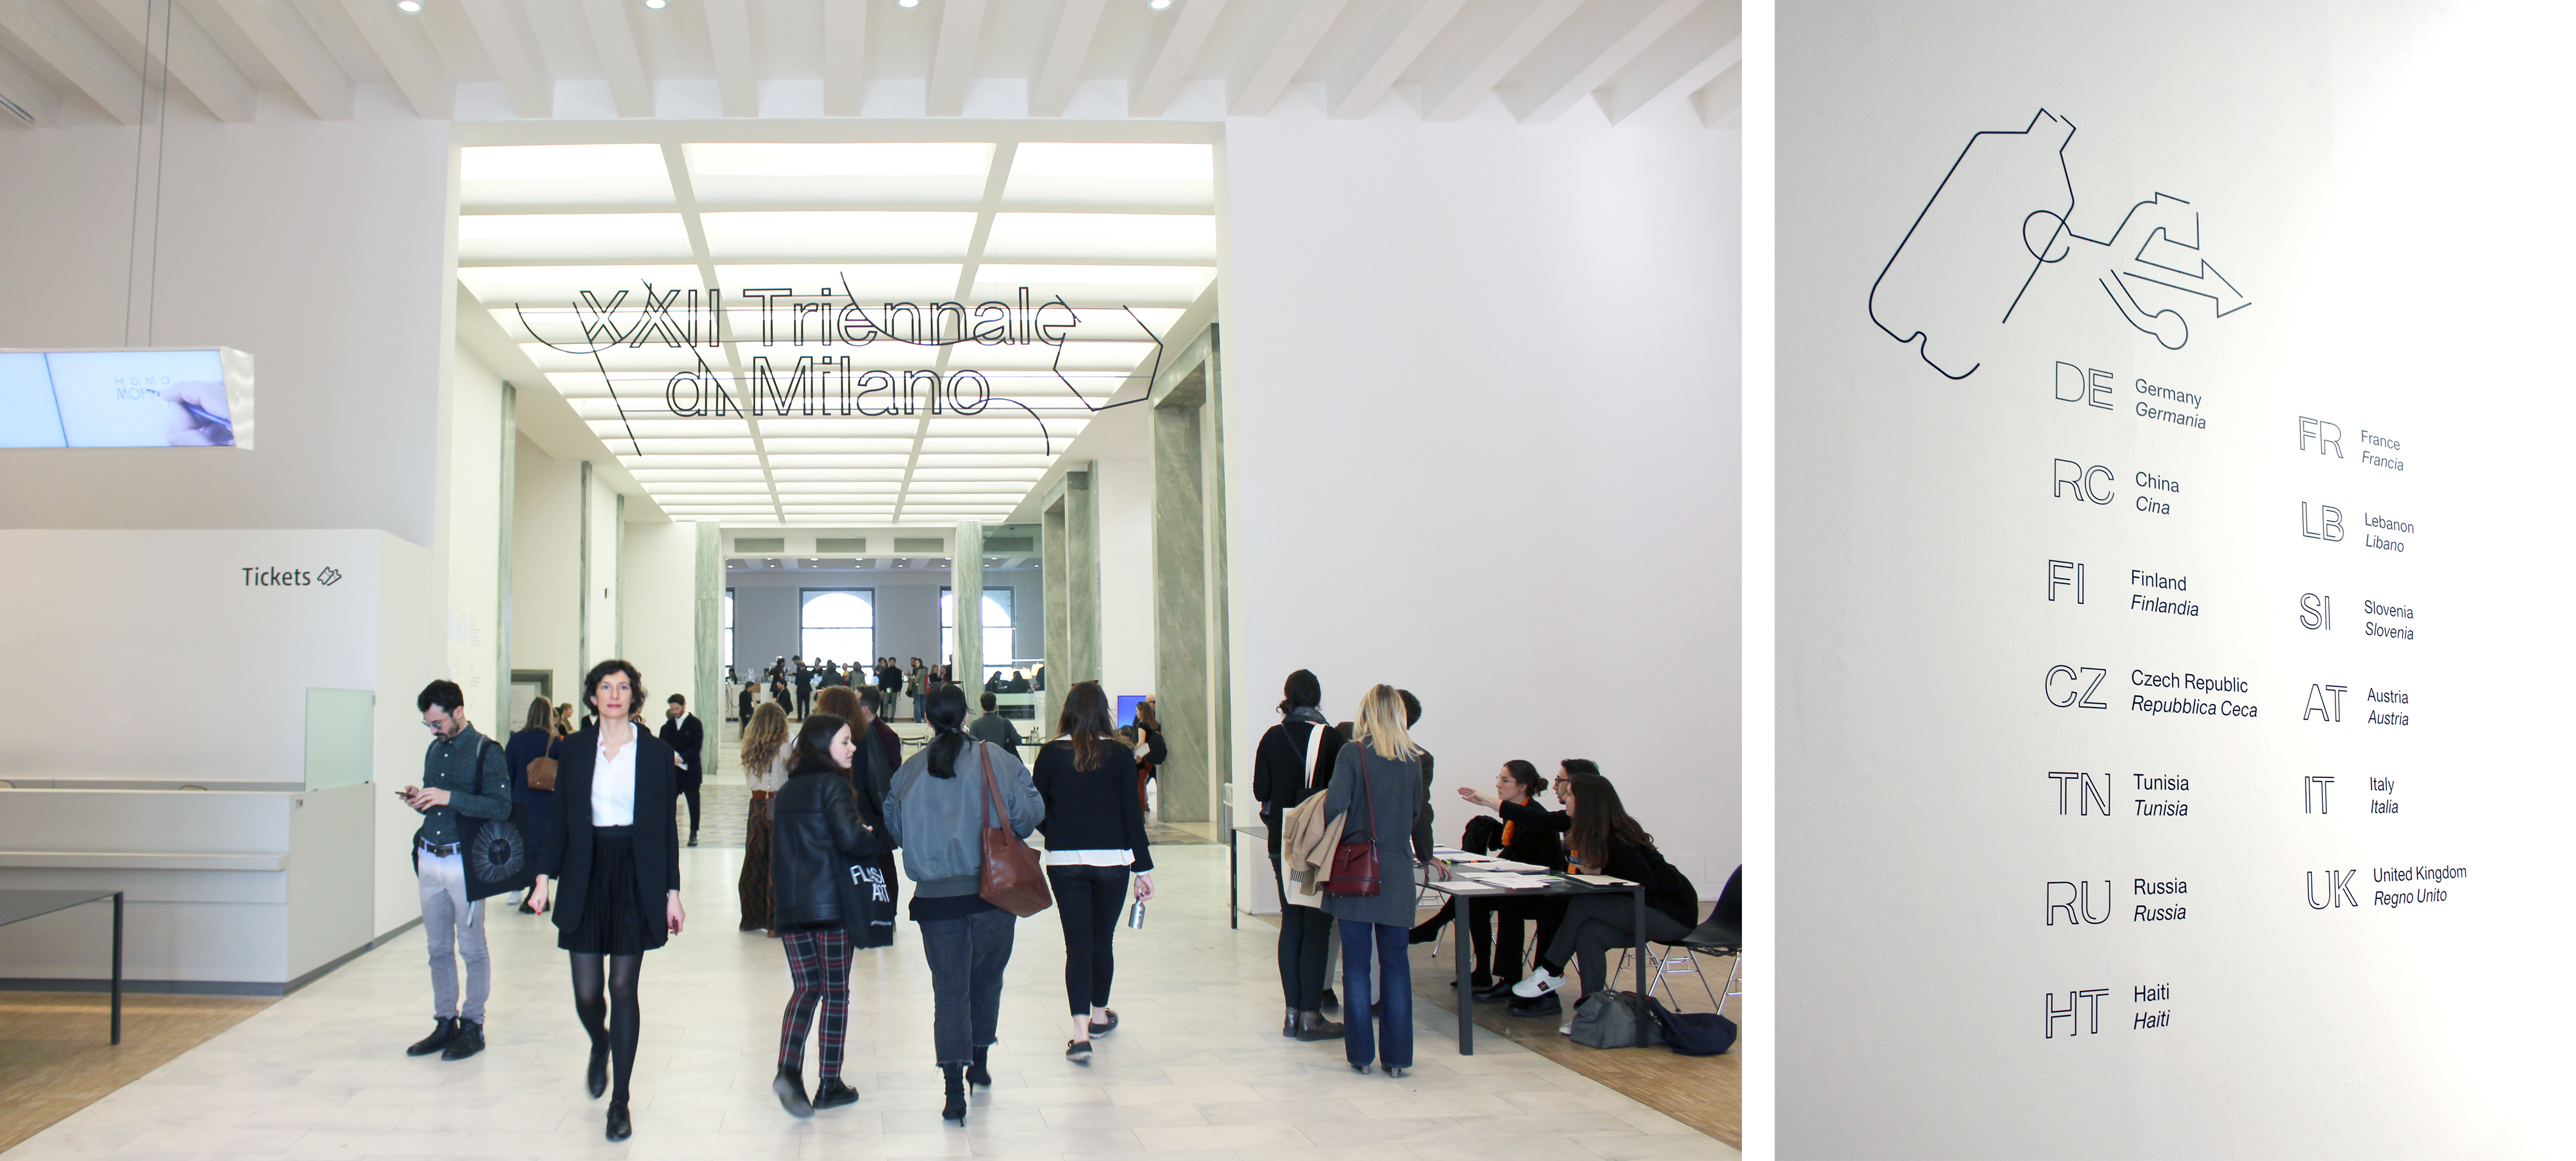
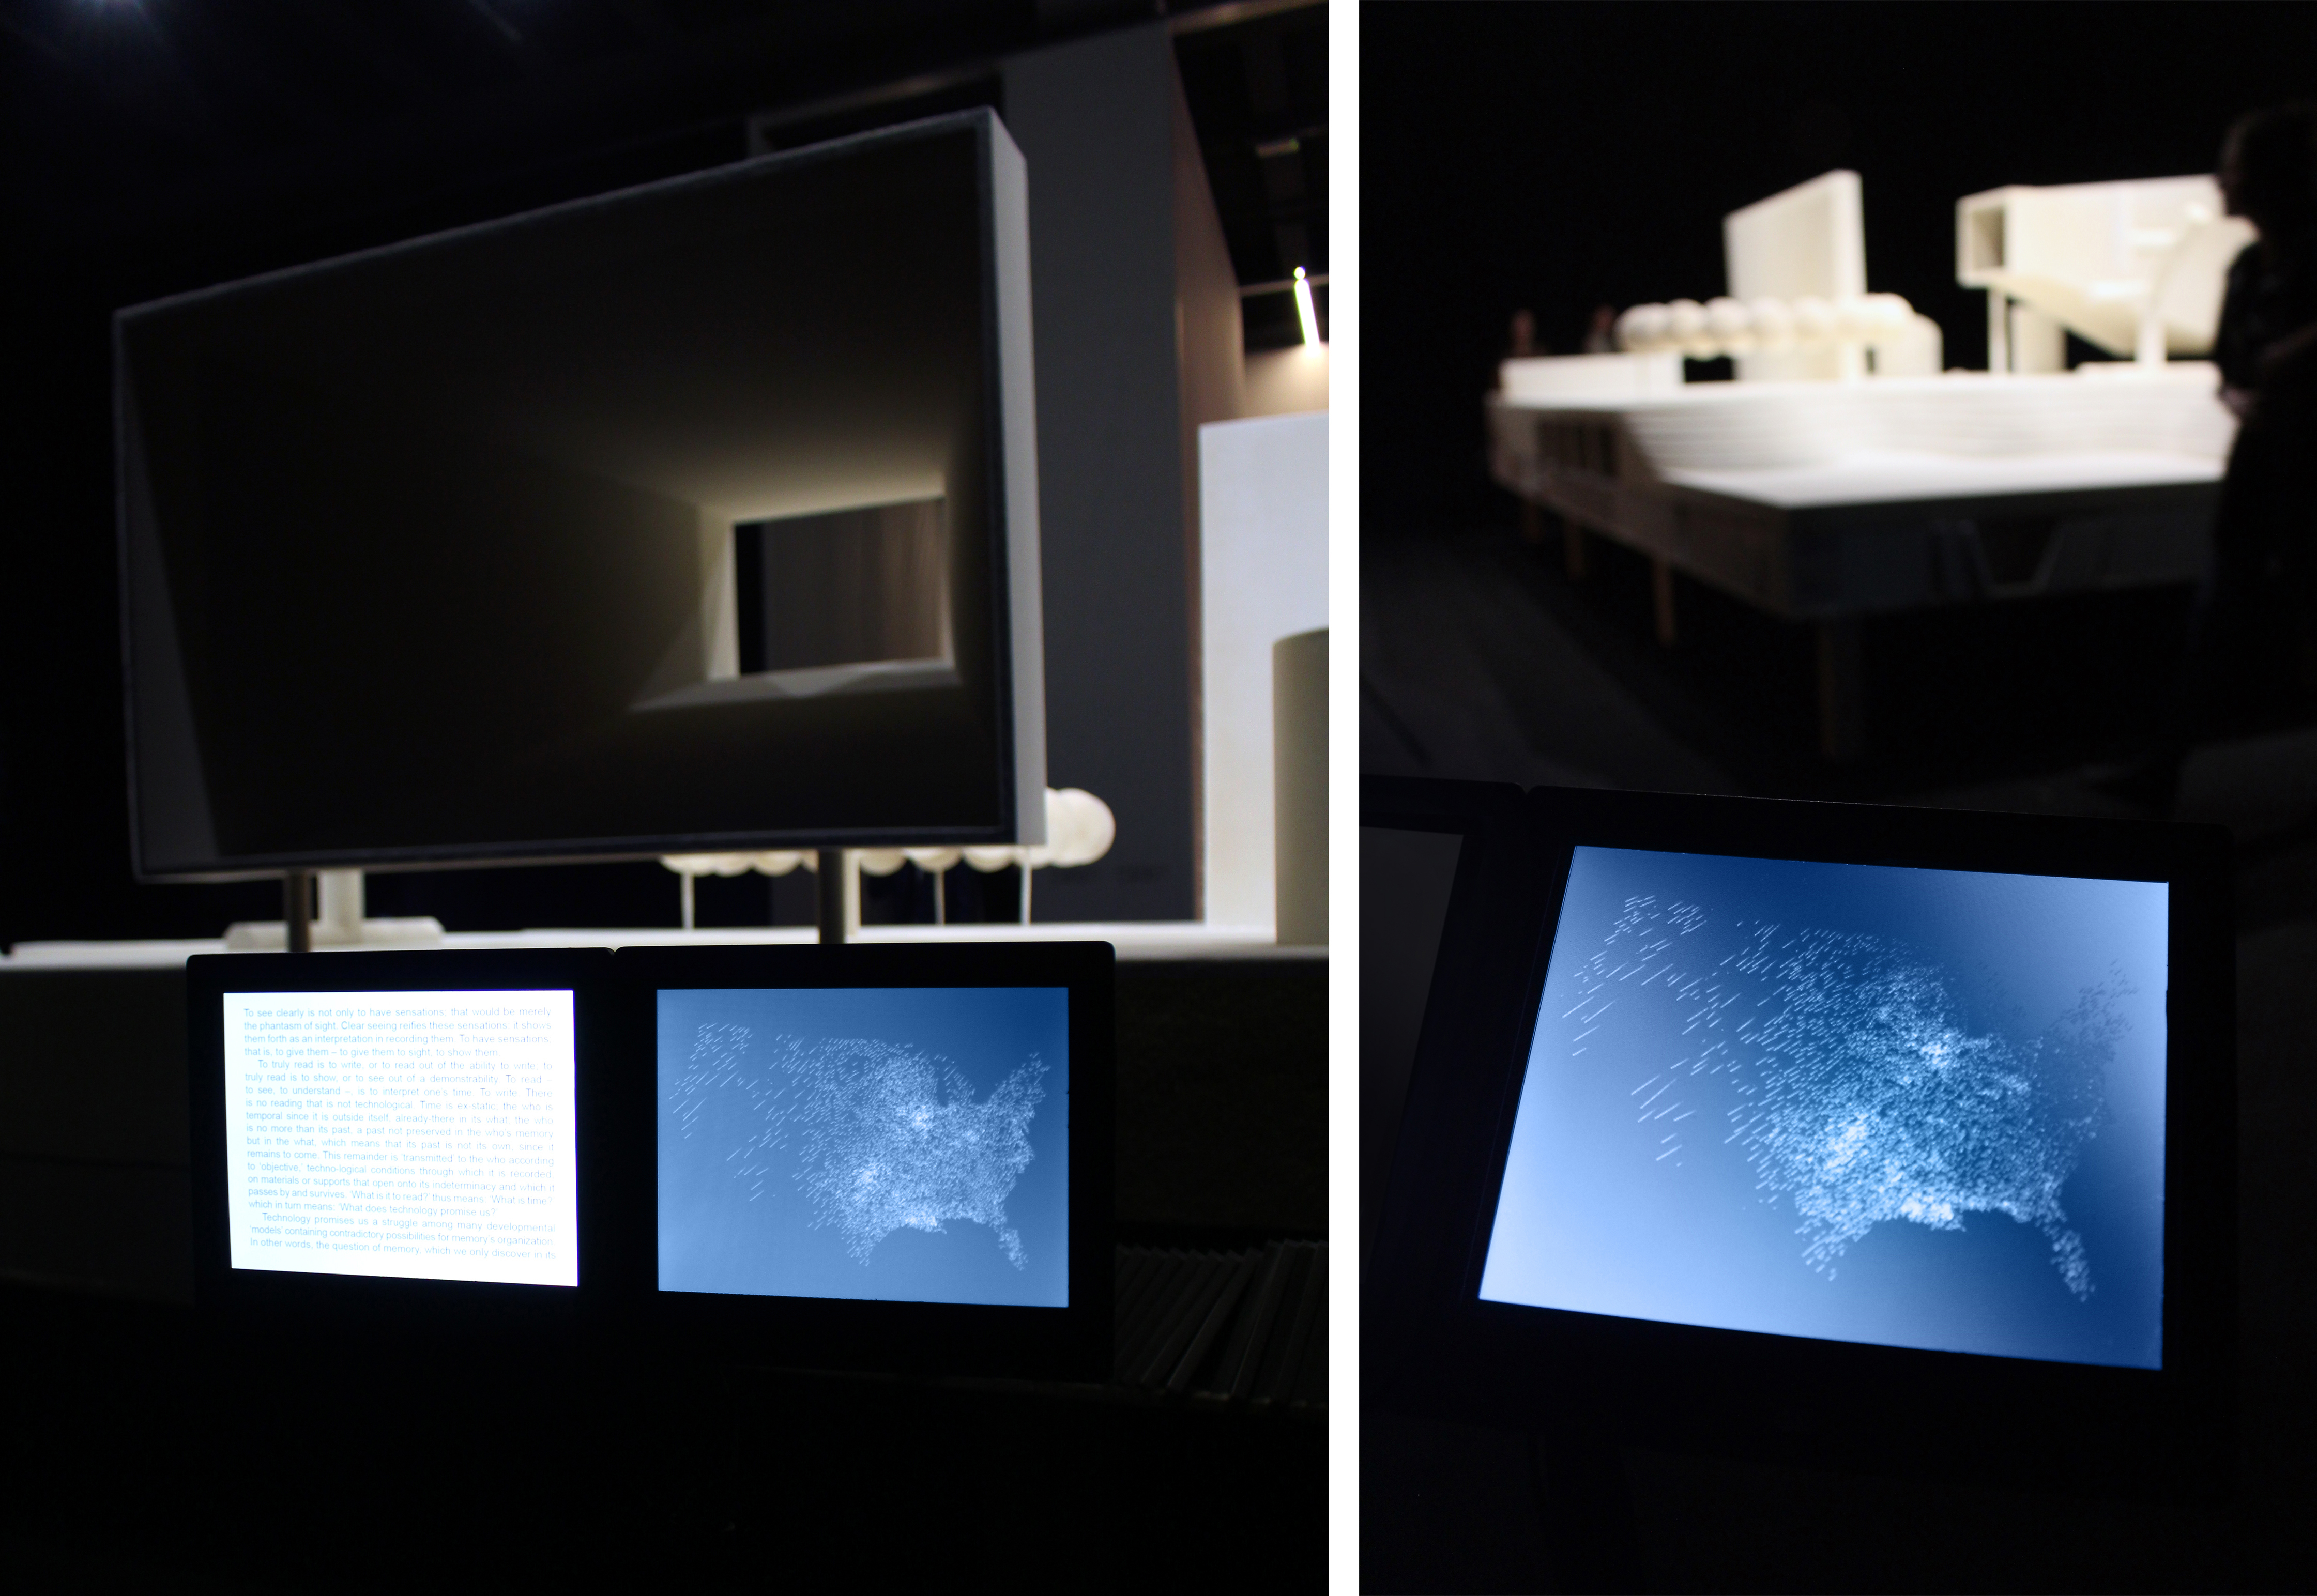
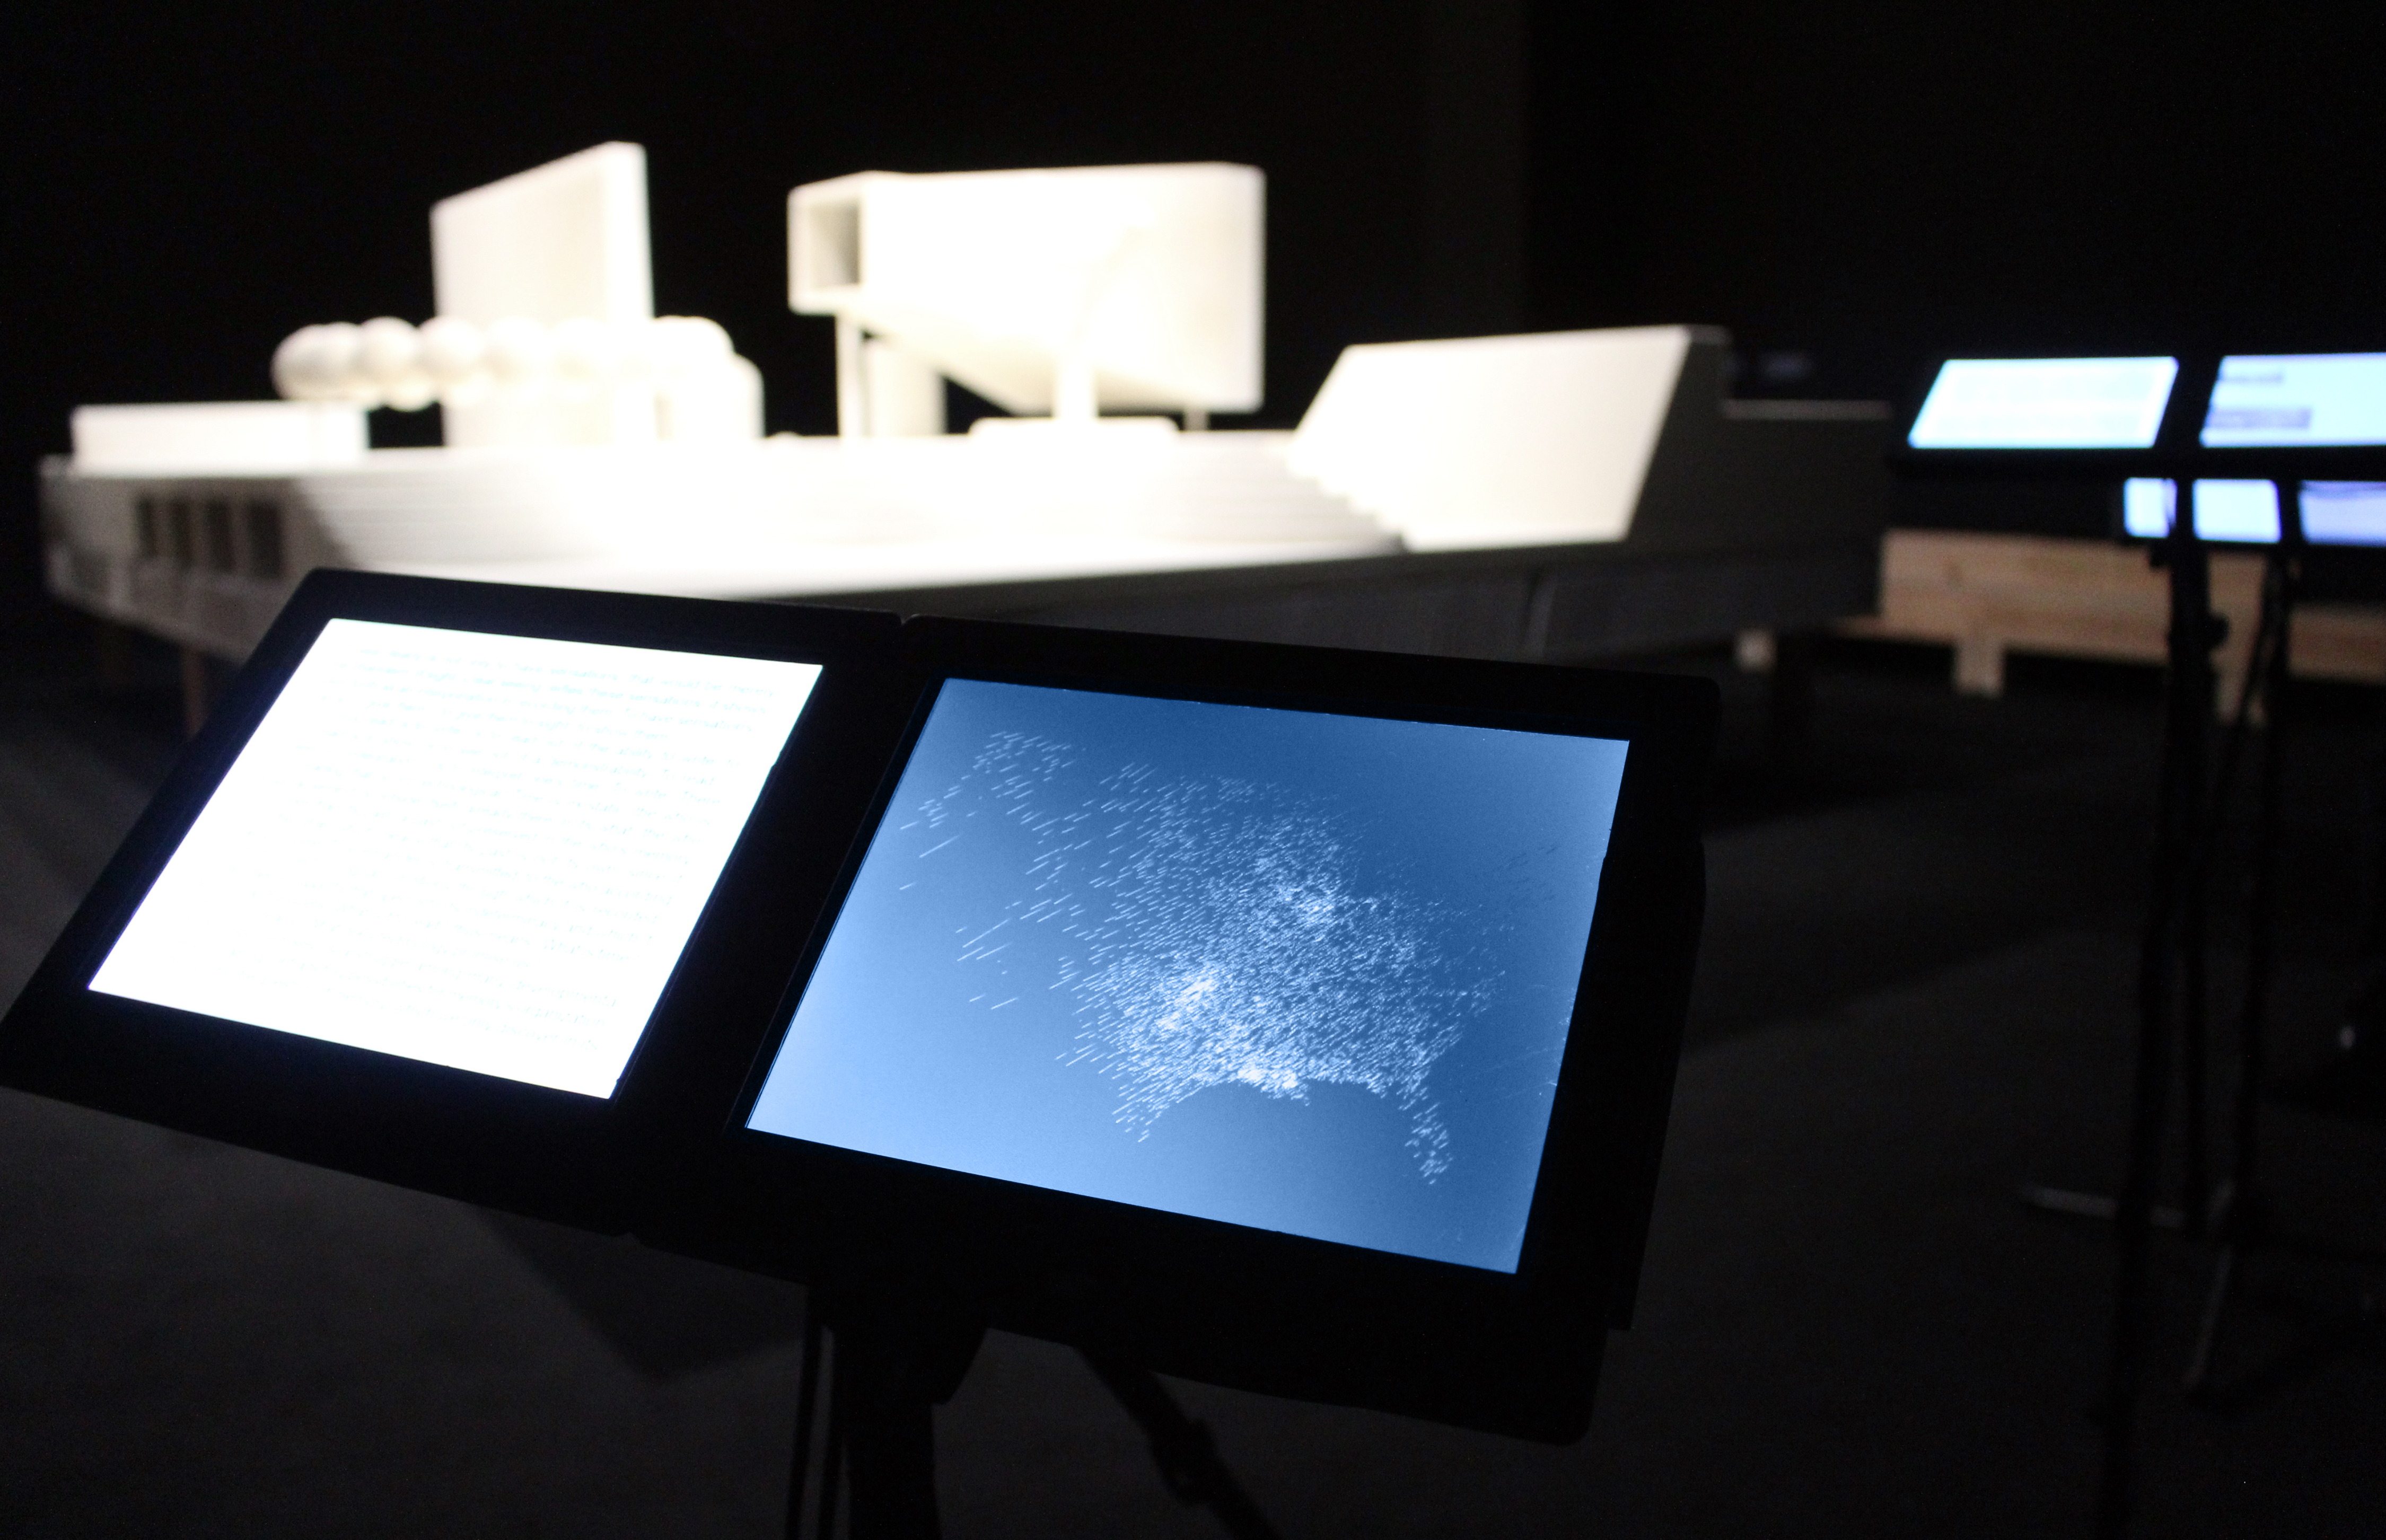
The “Flood vs Drought” project have been part of the design selection for the French pavilion at the XXII Triennale Milano 2019, under the theme of Broken Nature. The Triennale’s main exhibition is directed by Paola Antonelli, senior curator of the MoMA and director of its R&D accompanied by Ala Tannir, Laura Maeran, Azzura Muzzonigro, and Erica Petrillo. The French pavilion, curated by Catherine Geel, was entitled: “From thought to visible. Design As A Large Ring”; it is among 25 national pavilions.
French pavilion at the XXII Triennale Milano: From March 1rst to September 1rst 2019
De la pensée au visible. Design As A Large Ring
Curator and head of programs: Catherine Geel
Coordination research committee, study days and designers: Lola Carrel
Executive Producer: Marie Lejault, T&P Work UNit
Website: David Bihanic and Trafik
Police de caractères: Unit R © Karl Nawrot, 2011
Pavilion
Designers exhibited: Marie-Sarah Adénis (PILI), David Bihanic, Astrid de la Chapelle, Émile De Visscher, David Enon, Juliette Gelli, Sarah Garcin, Raphaël Pluvinage, Samy Rio, Justinien Tribillon, TVK.
Young researchers committee: Sarah Dulac, Clément Gaillard, Elizabeth Hale, Thomas Havet, Anthony Masure, Tiphaine Kazi-Tani, Océane Ragoucy.
Model and book layout : Karl Nawrot assisted by Thomas Hanus
Design: Sophie Breuil
Architects: Block Architectes
Vidéo: Designers
Public program (Case Study Days, Evenings, Encounters)
Advisory Board : Catherine Geel, Ensa Nancy et ENS Paris-Saclay, Claire Brunet, ENS Paris-Saclay, Emanuel Mahé, Head of Research EnsadLab-PSL, Olivier Peyricot, Head of Research, Cité du design, Clémence Seurat (Gaité Lyrique).
Producers: Institut Français, Maison des Sciences de l’Homme Paris-Saclay, Gaité Lyrique,
Partners: Cité du design, EnsadLab. T&P Wotk UNit.


Publication
This visualisation was published in the book “Design. From Nature to Environnement. New Definitions” edited by Catherine Geel, and published by T&P Publishing with the support of the French Ministries of Culture and Foreign Affairs, also the Organising Committe of La Triennale di Milano 2019.
David Bihanic (2019), “Flood vs Drought”, In Design. From Nature to Environnement. New Definitions (Catherine Geel ed.). T&P Publishing, Paris, pp. 49-76.
This chart have been also published and described by journalist of the french scientific news magazine entitled ‘Pour La Science’‘ : « Où est passé l’ananas express ? », Pour La Sciences (Hors-Série), Mai 2019, N° 103, pp. 114-115. Available online, URL, http://www.pourlascience.fr/…

To mention:
David Bihanic, “Flood vs Drought (Infographics)”, April 2016. Retrieved from davidbihanic.com/i0416f.jpg
