The Starlink Project in Contrast with the StarInk Perspective
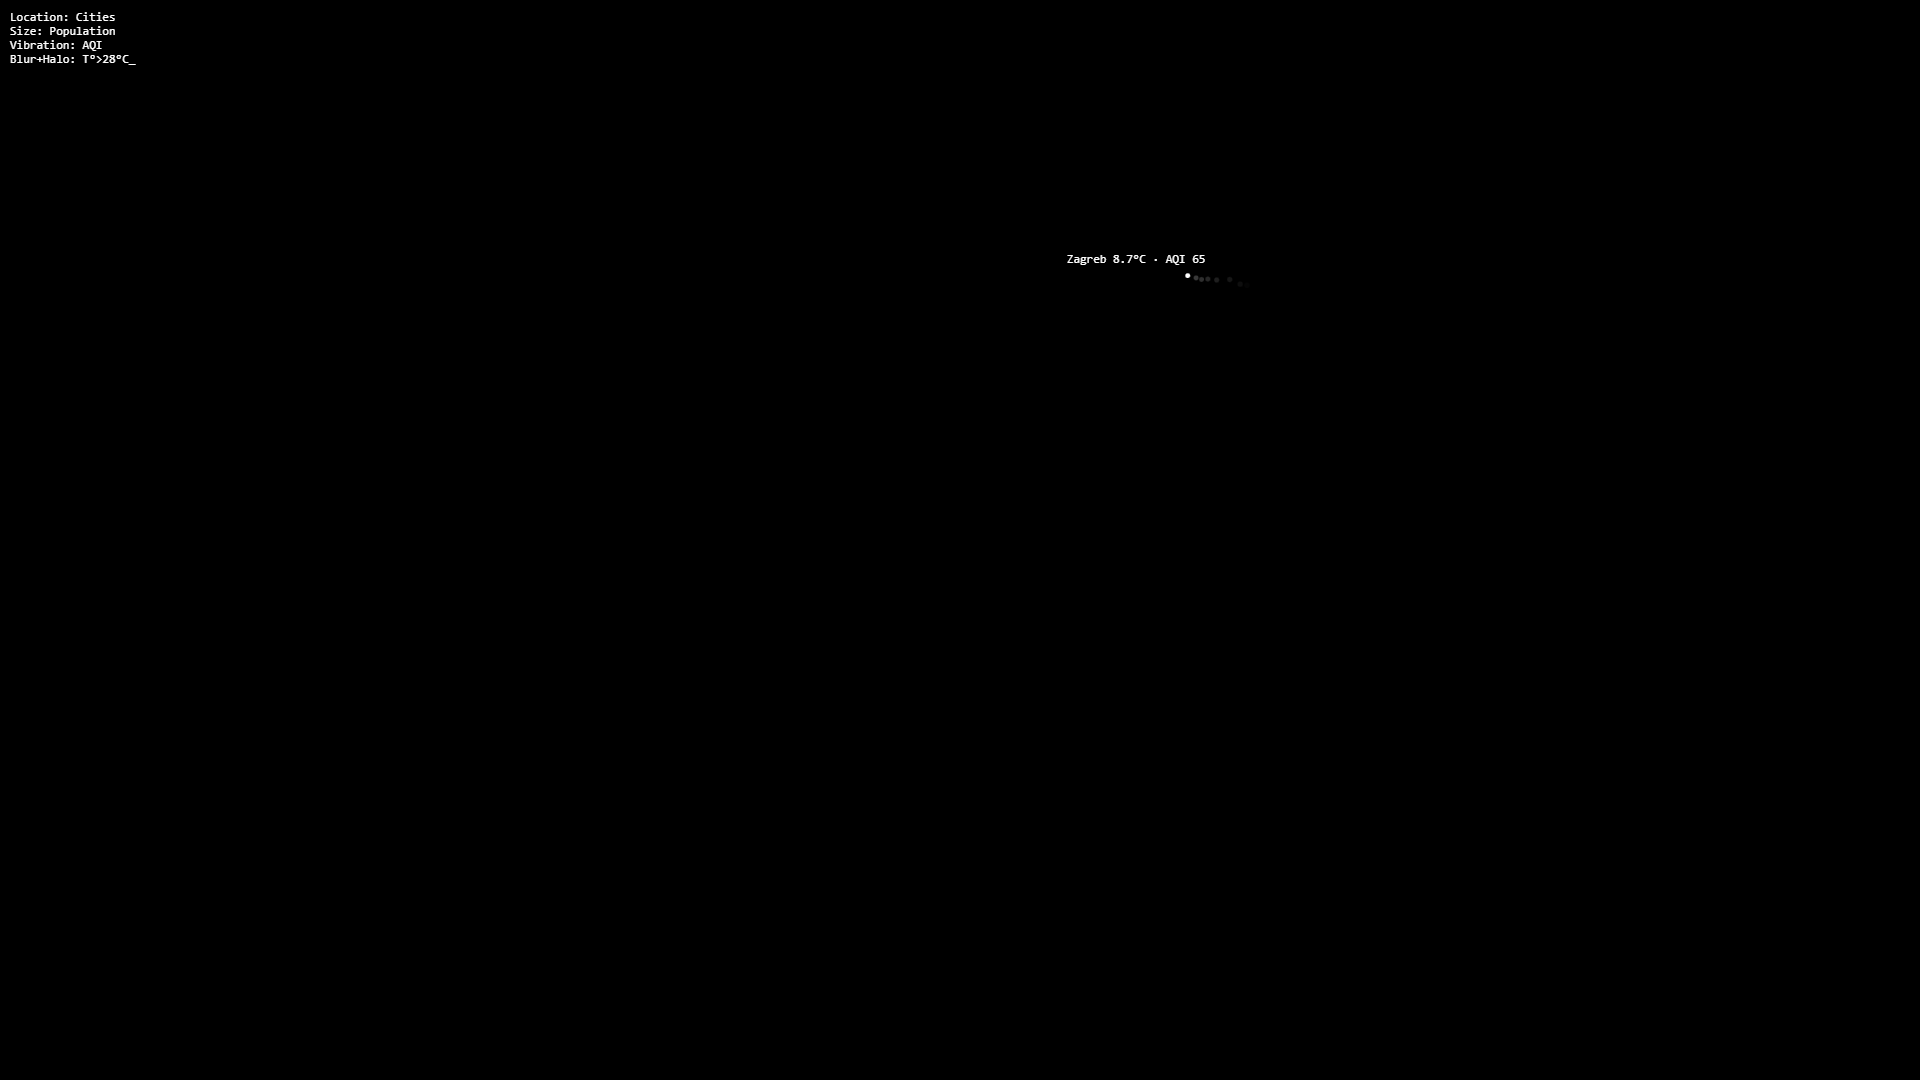
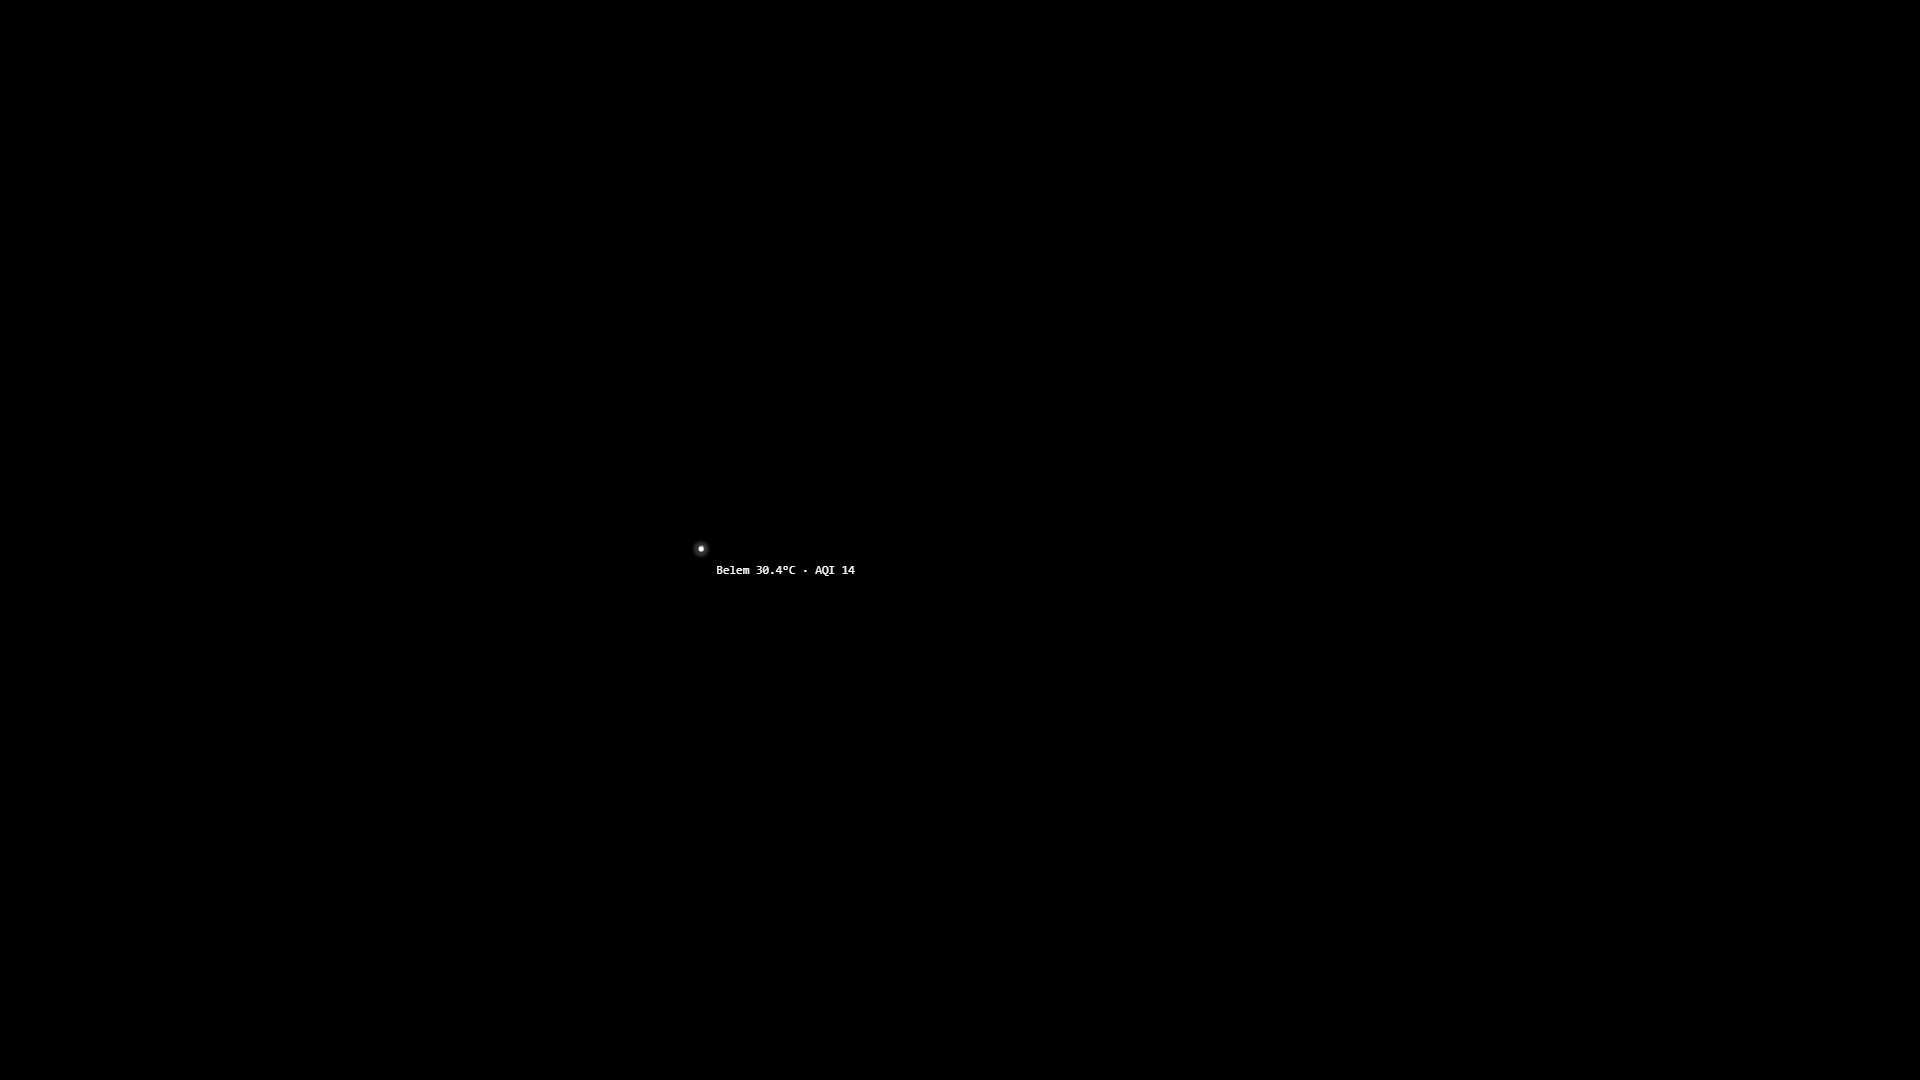
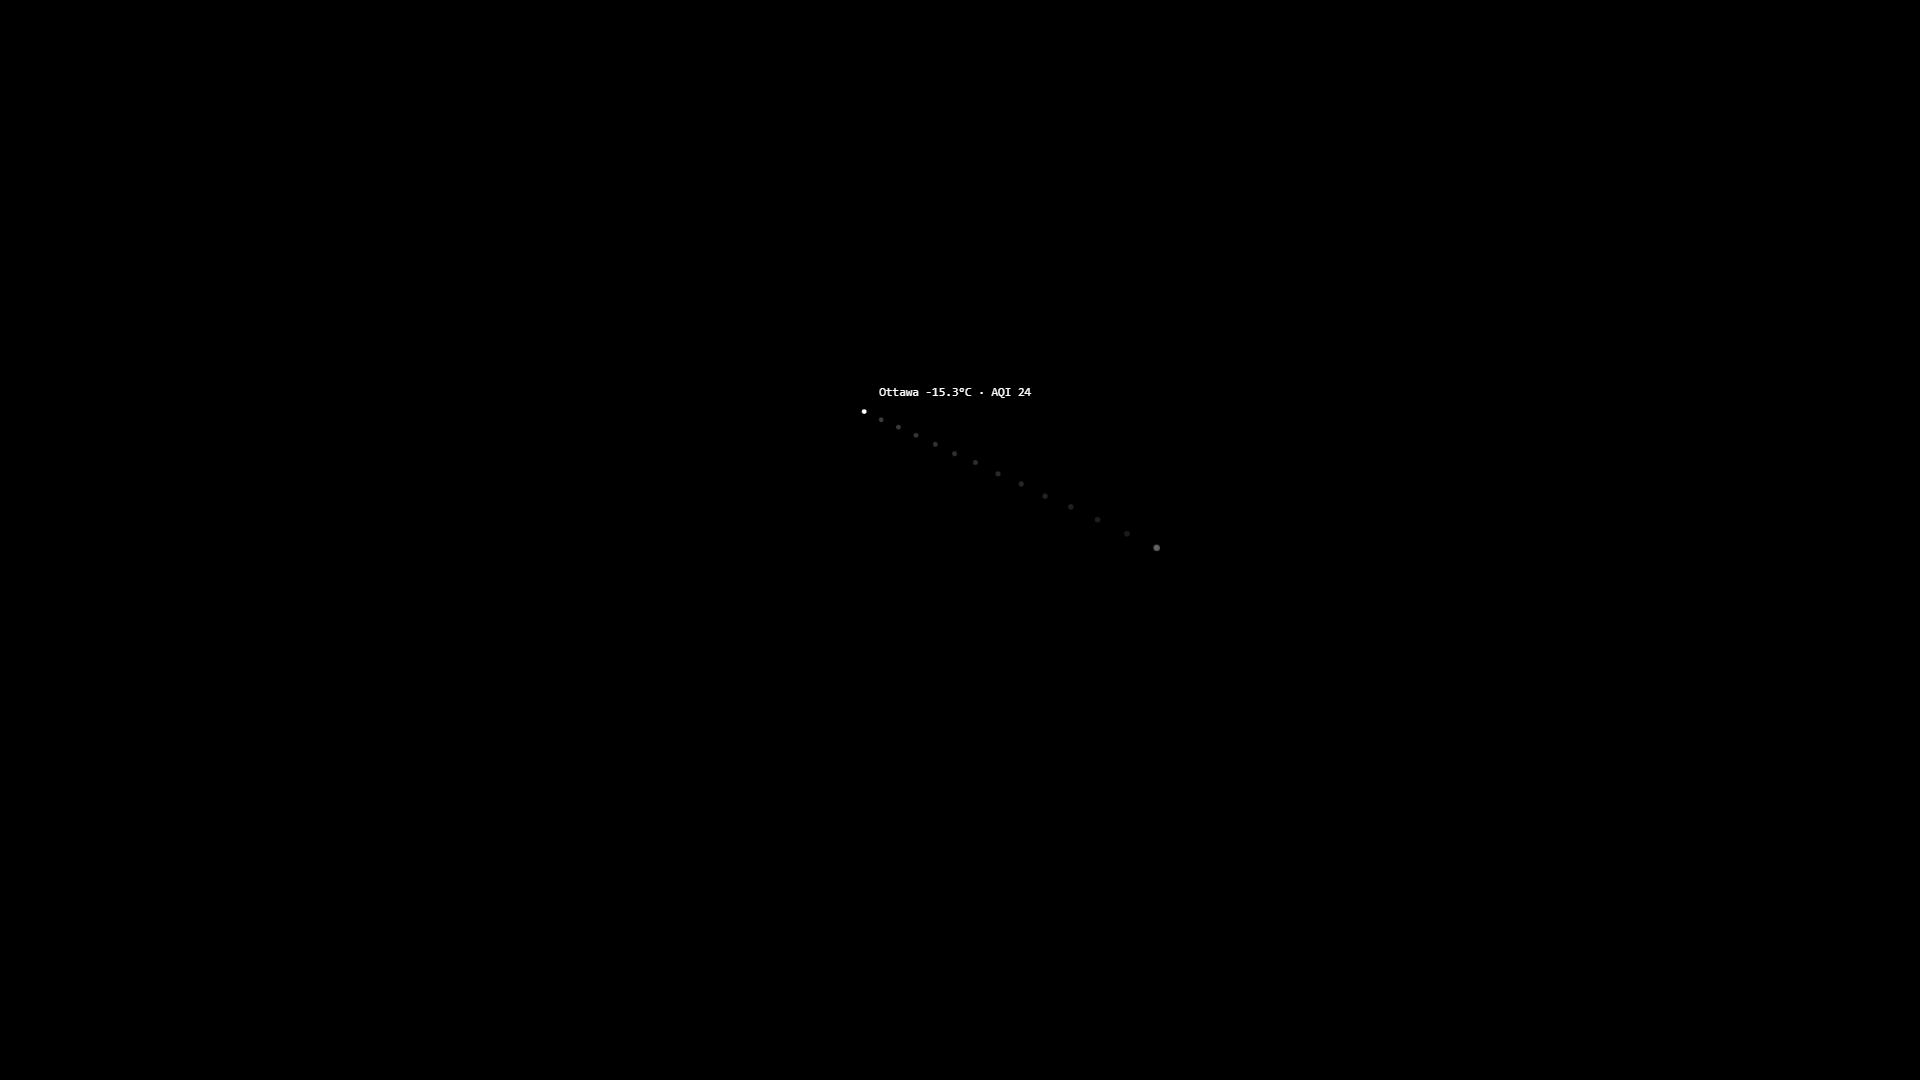
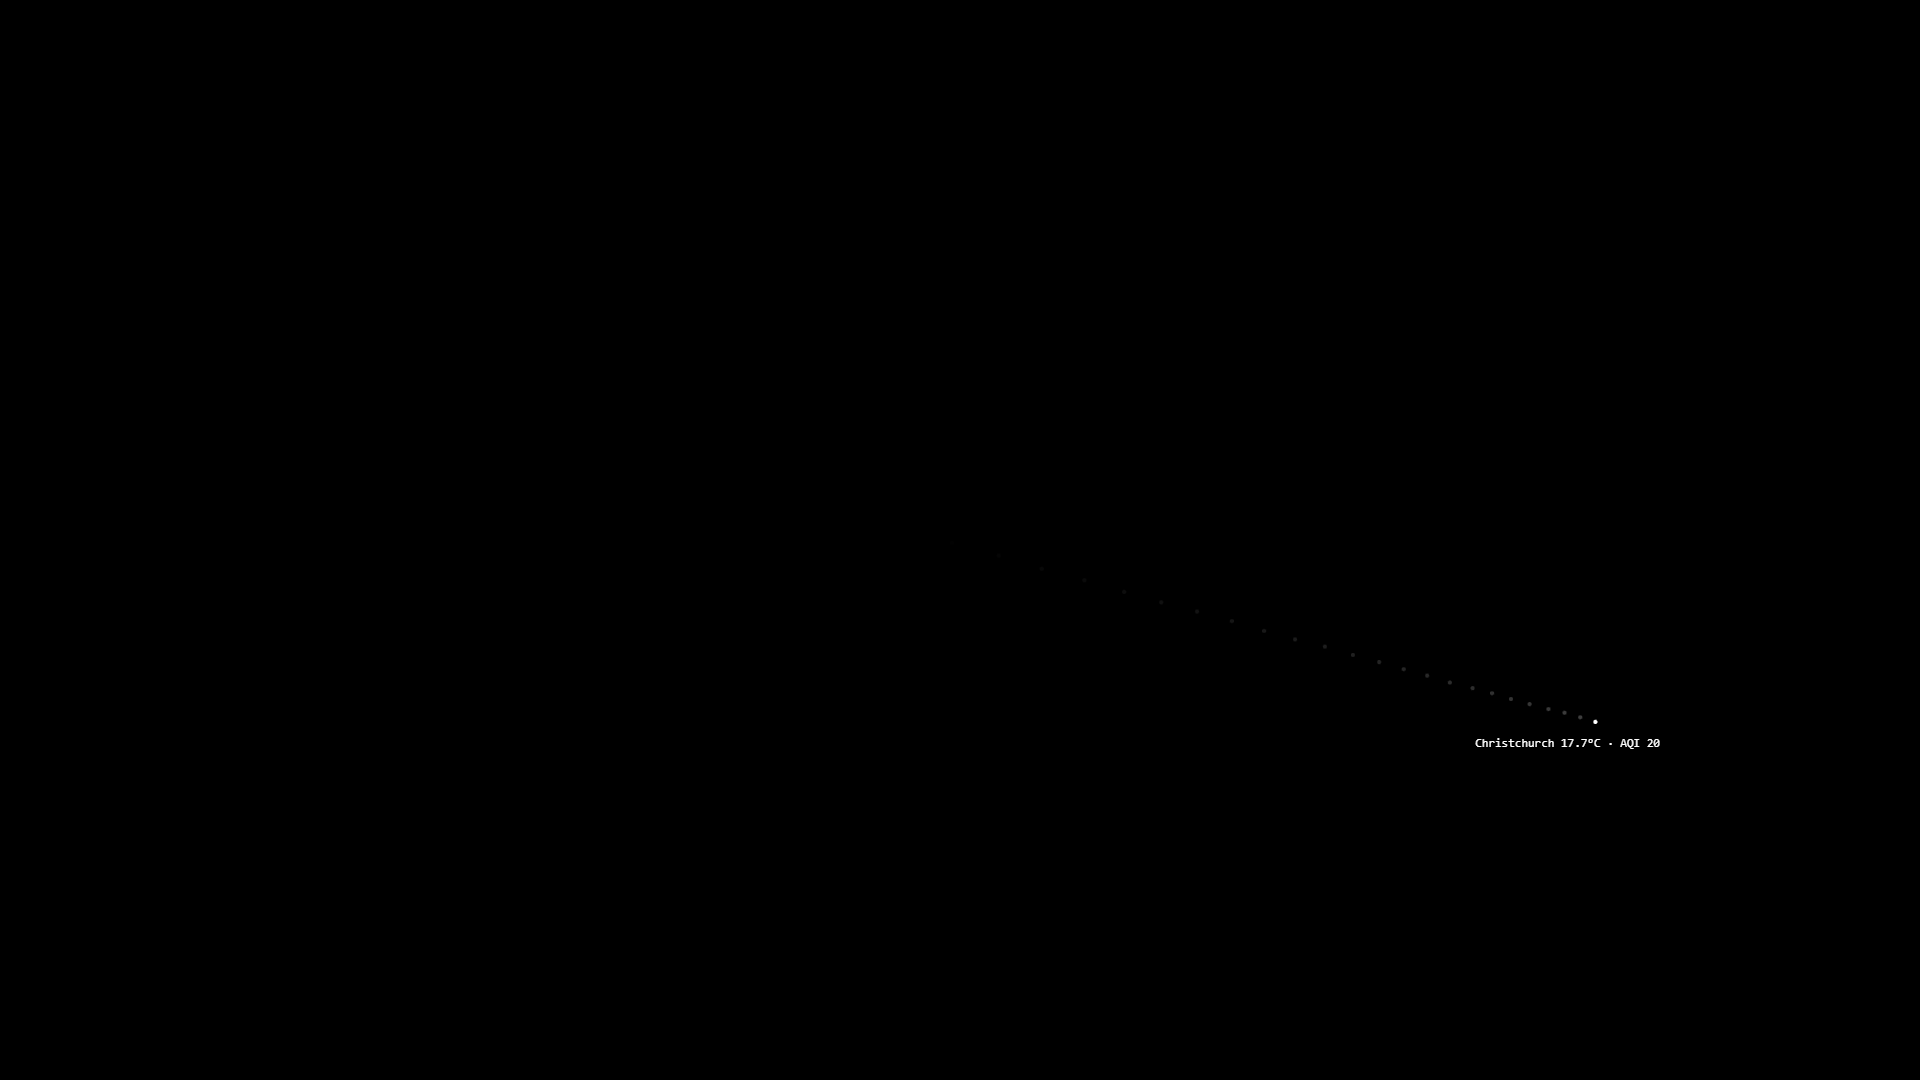
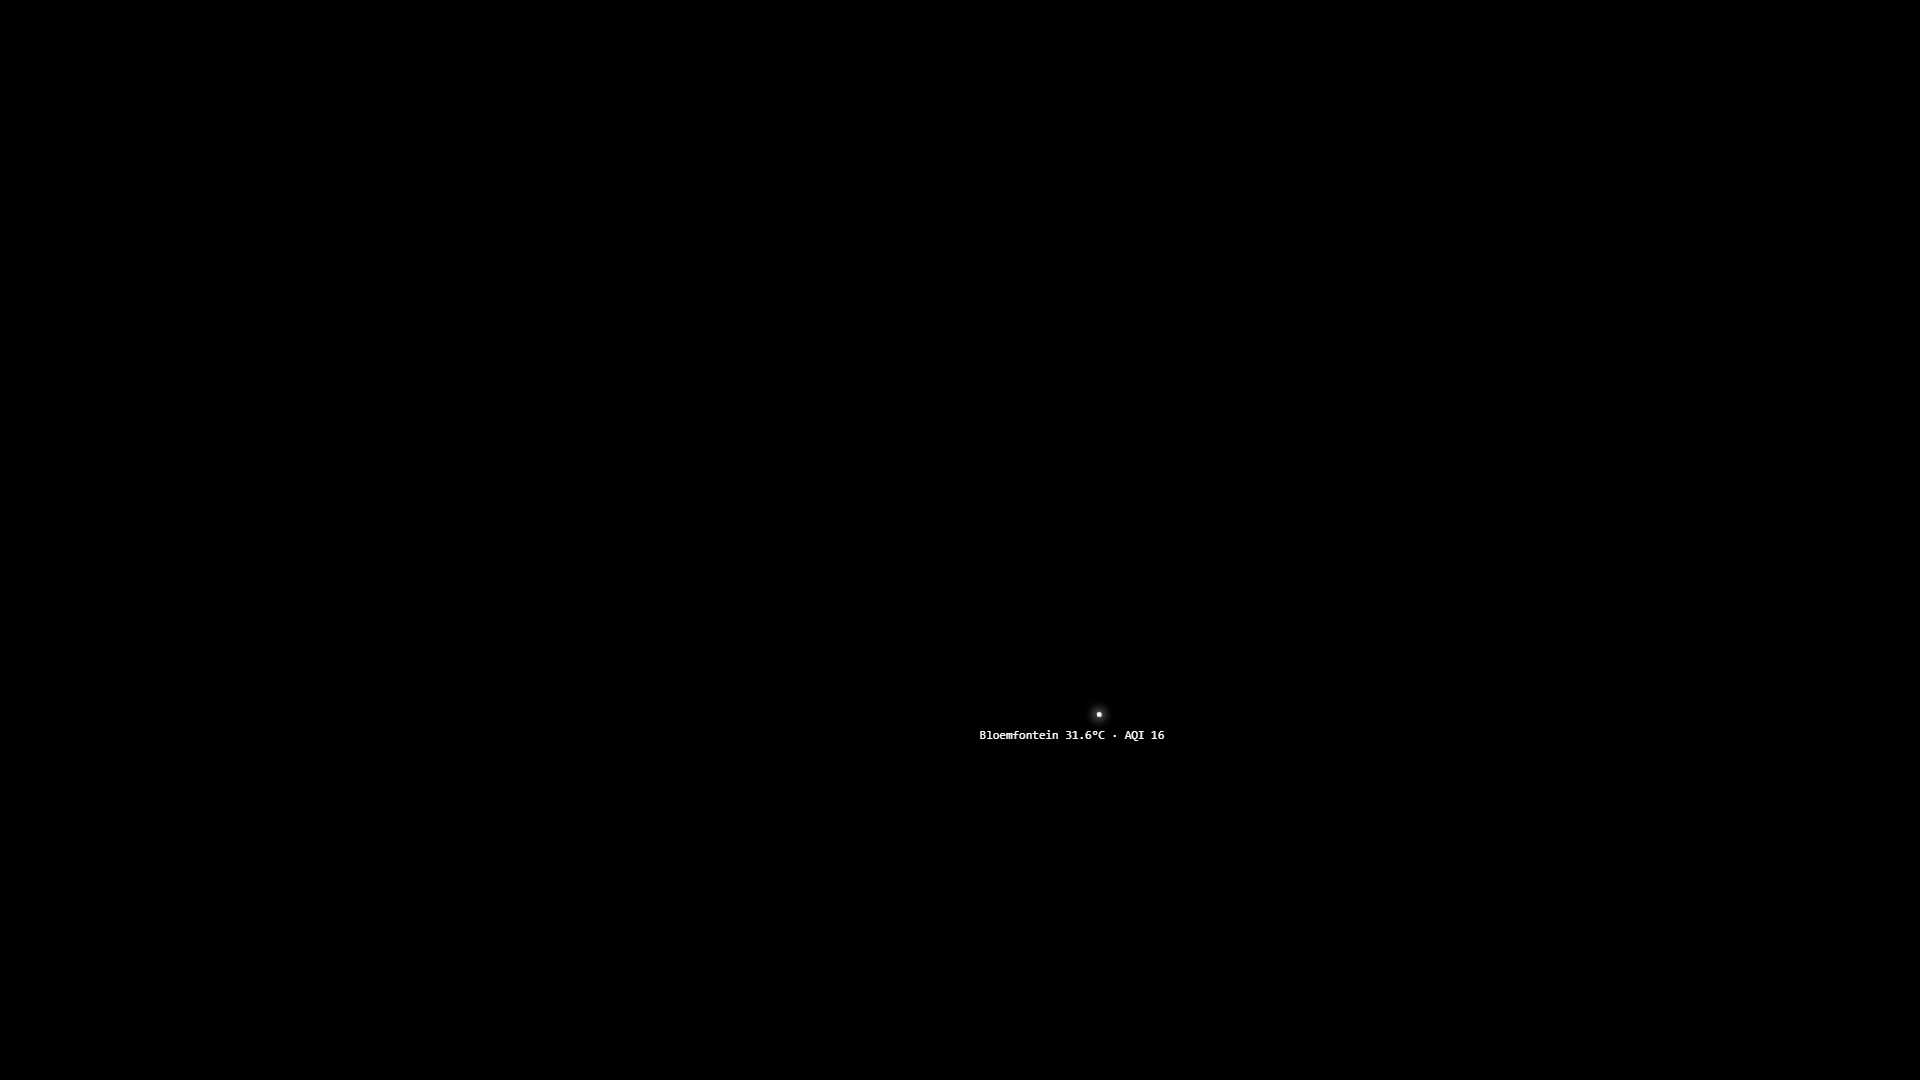
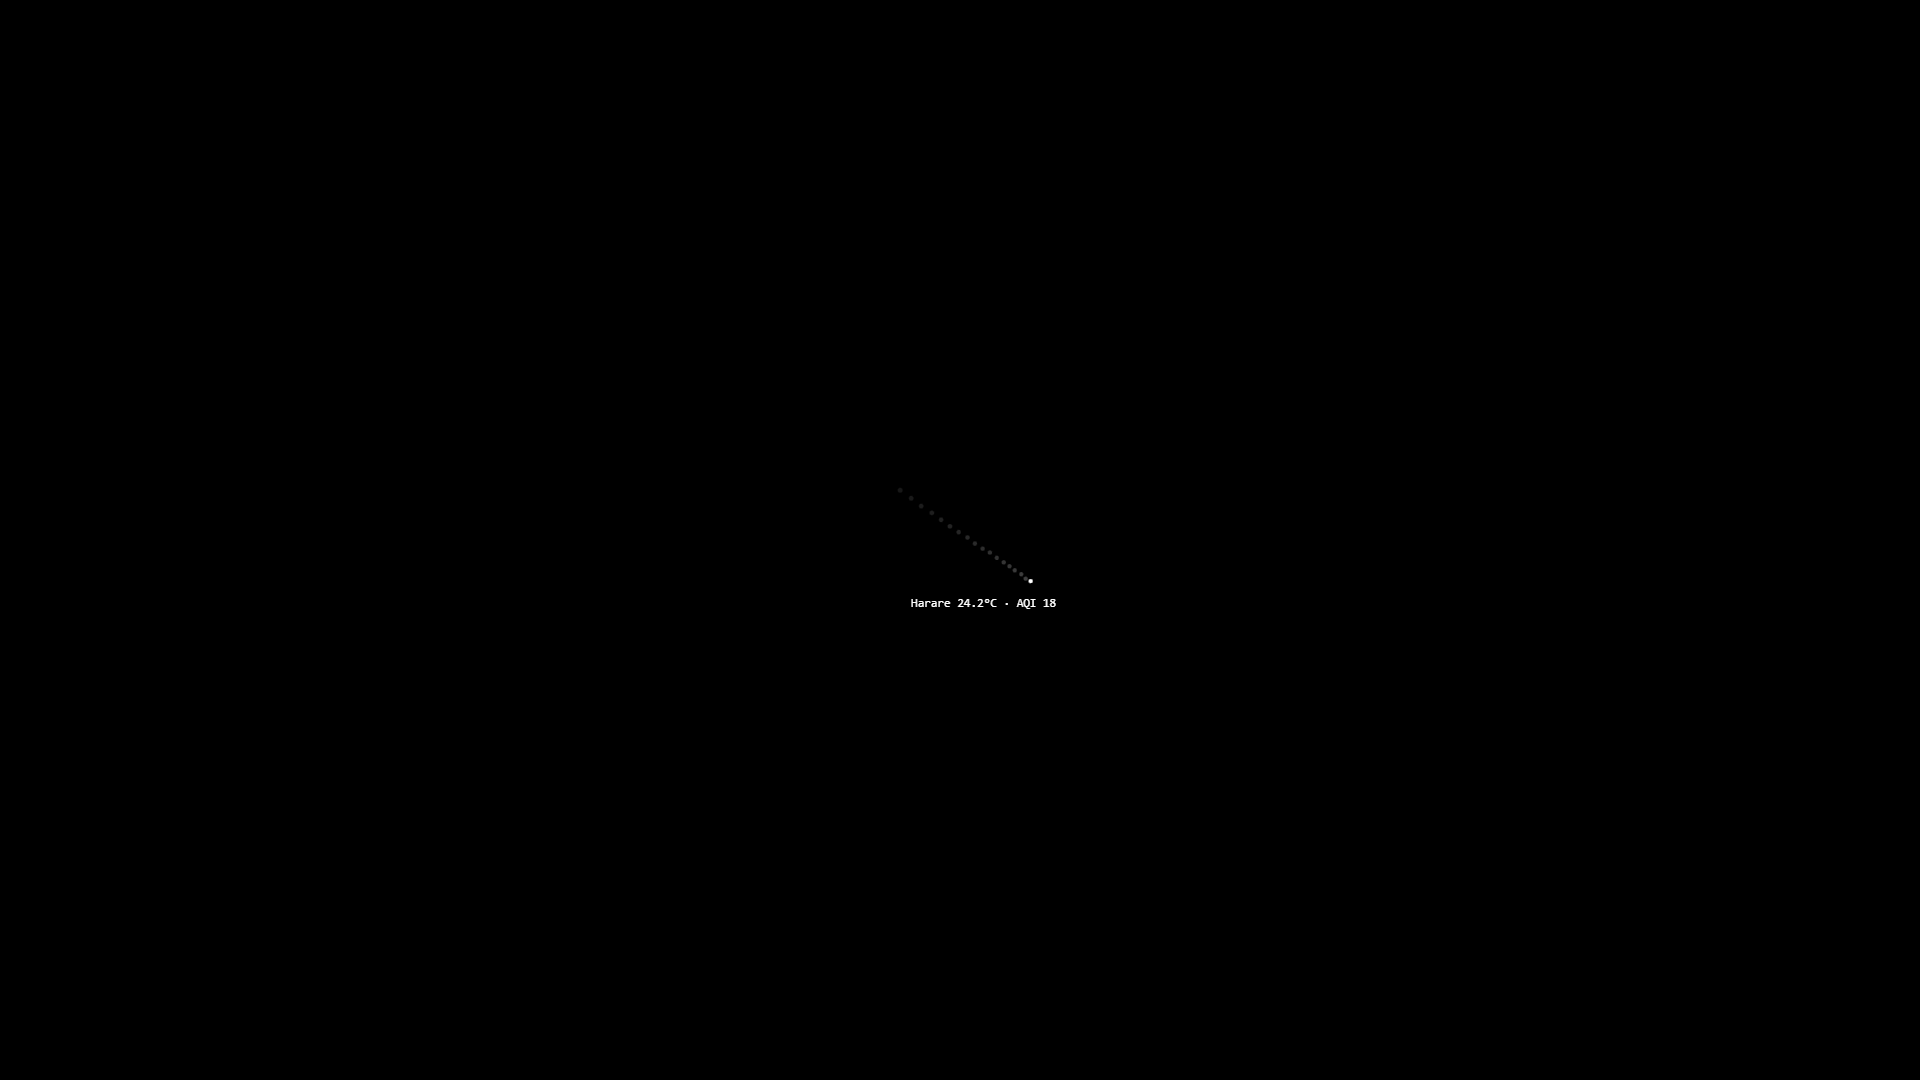
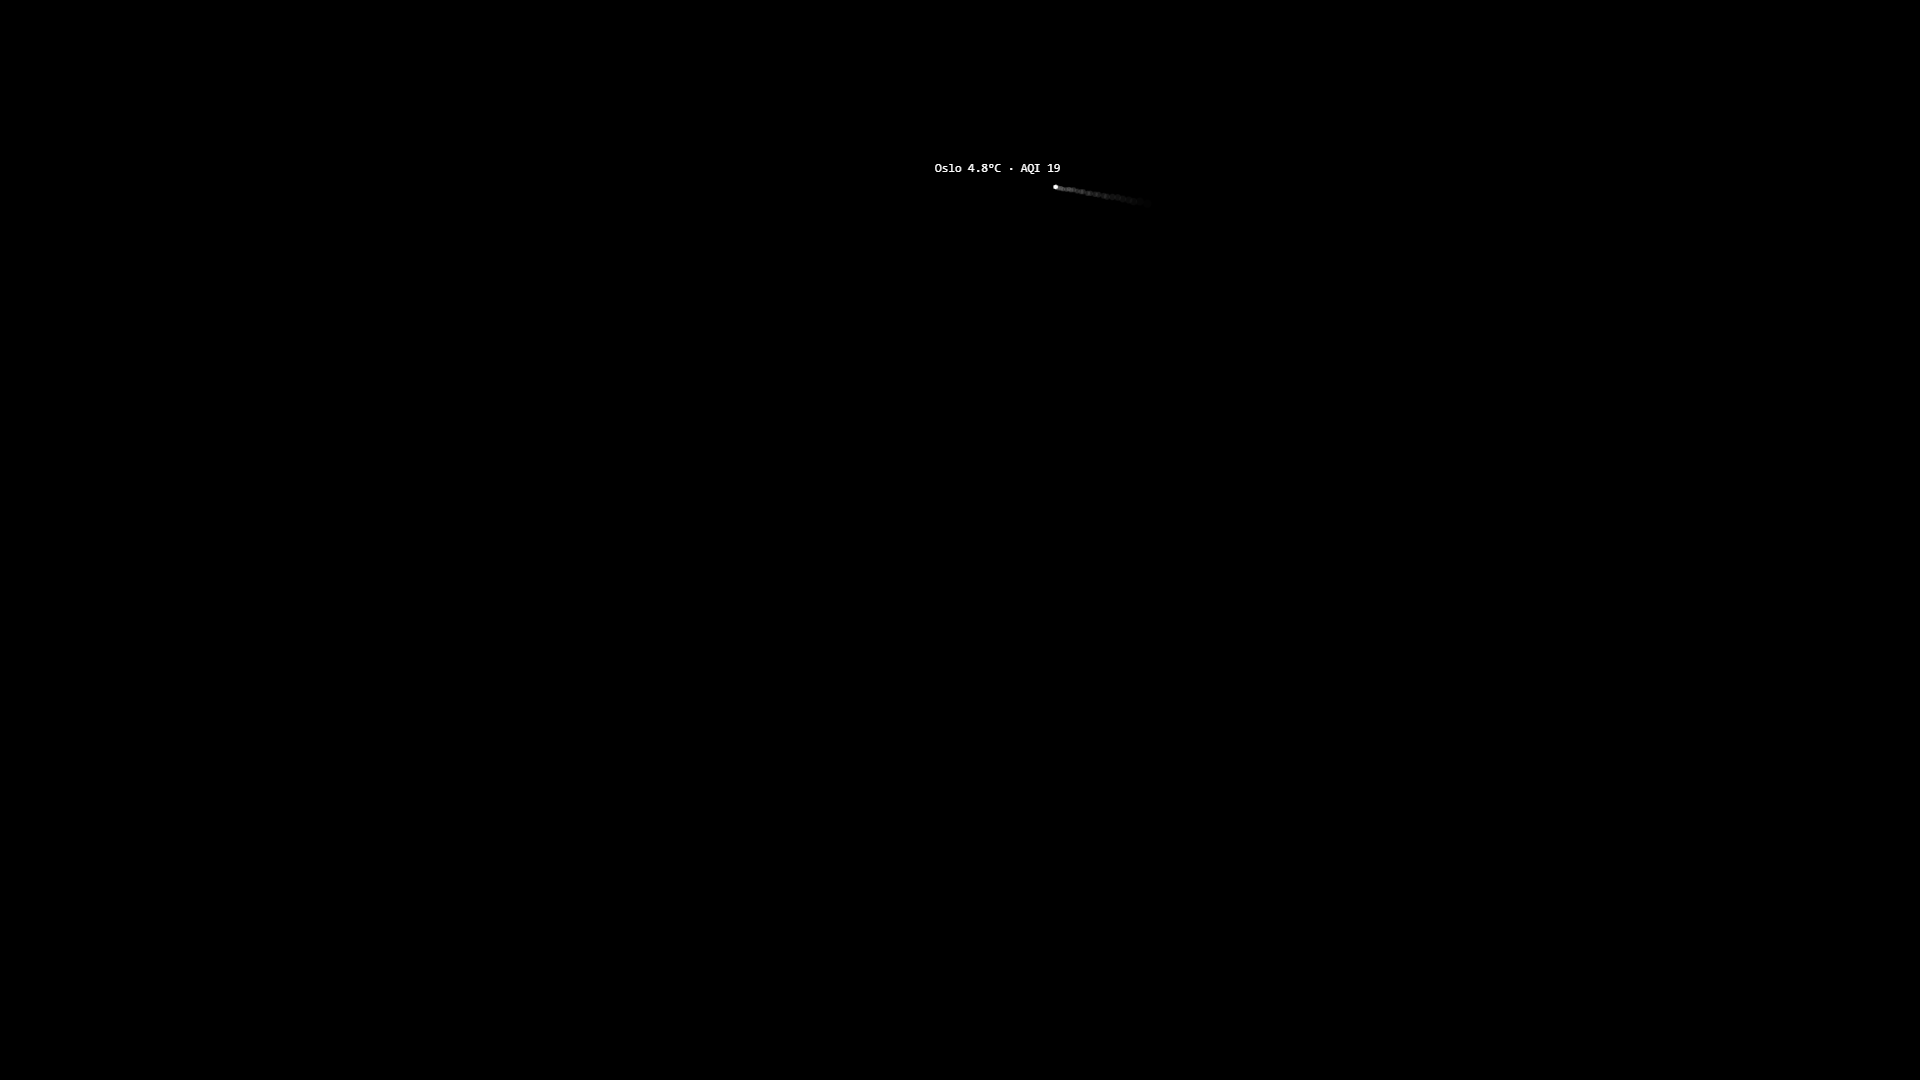
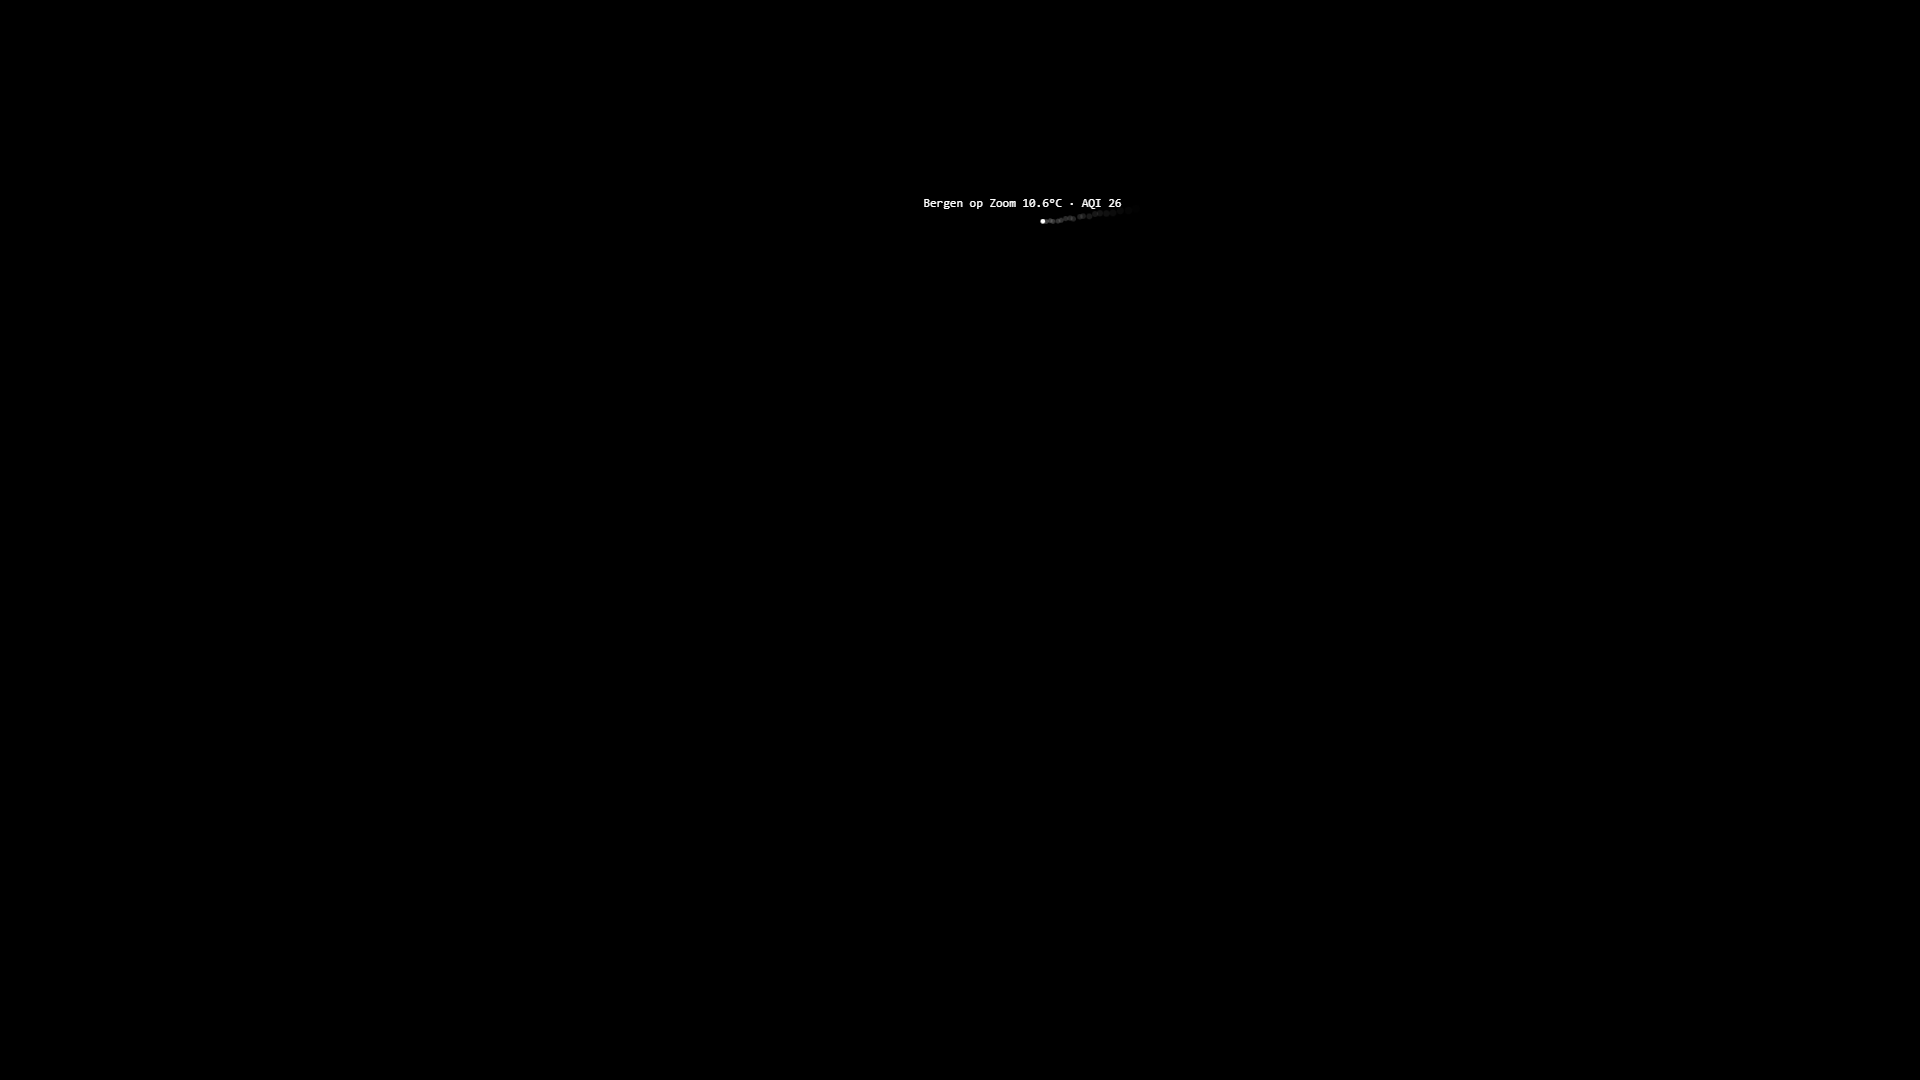
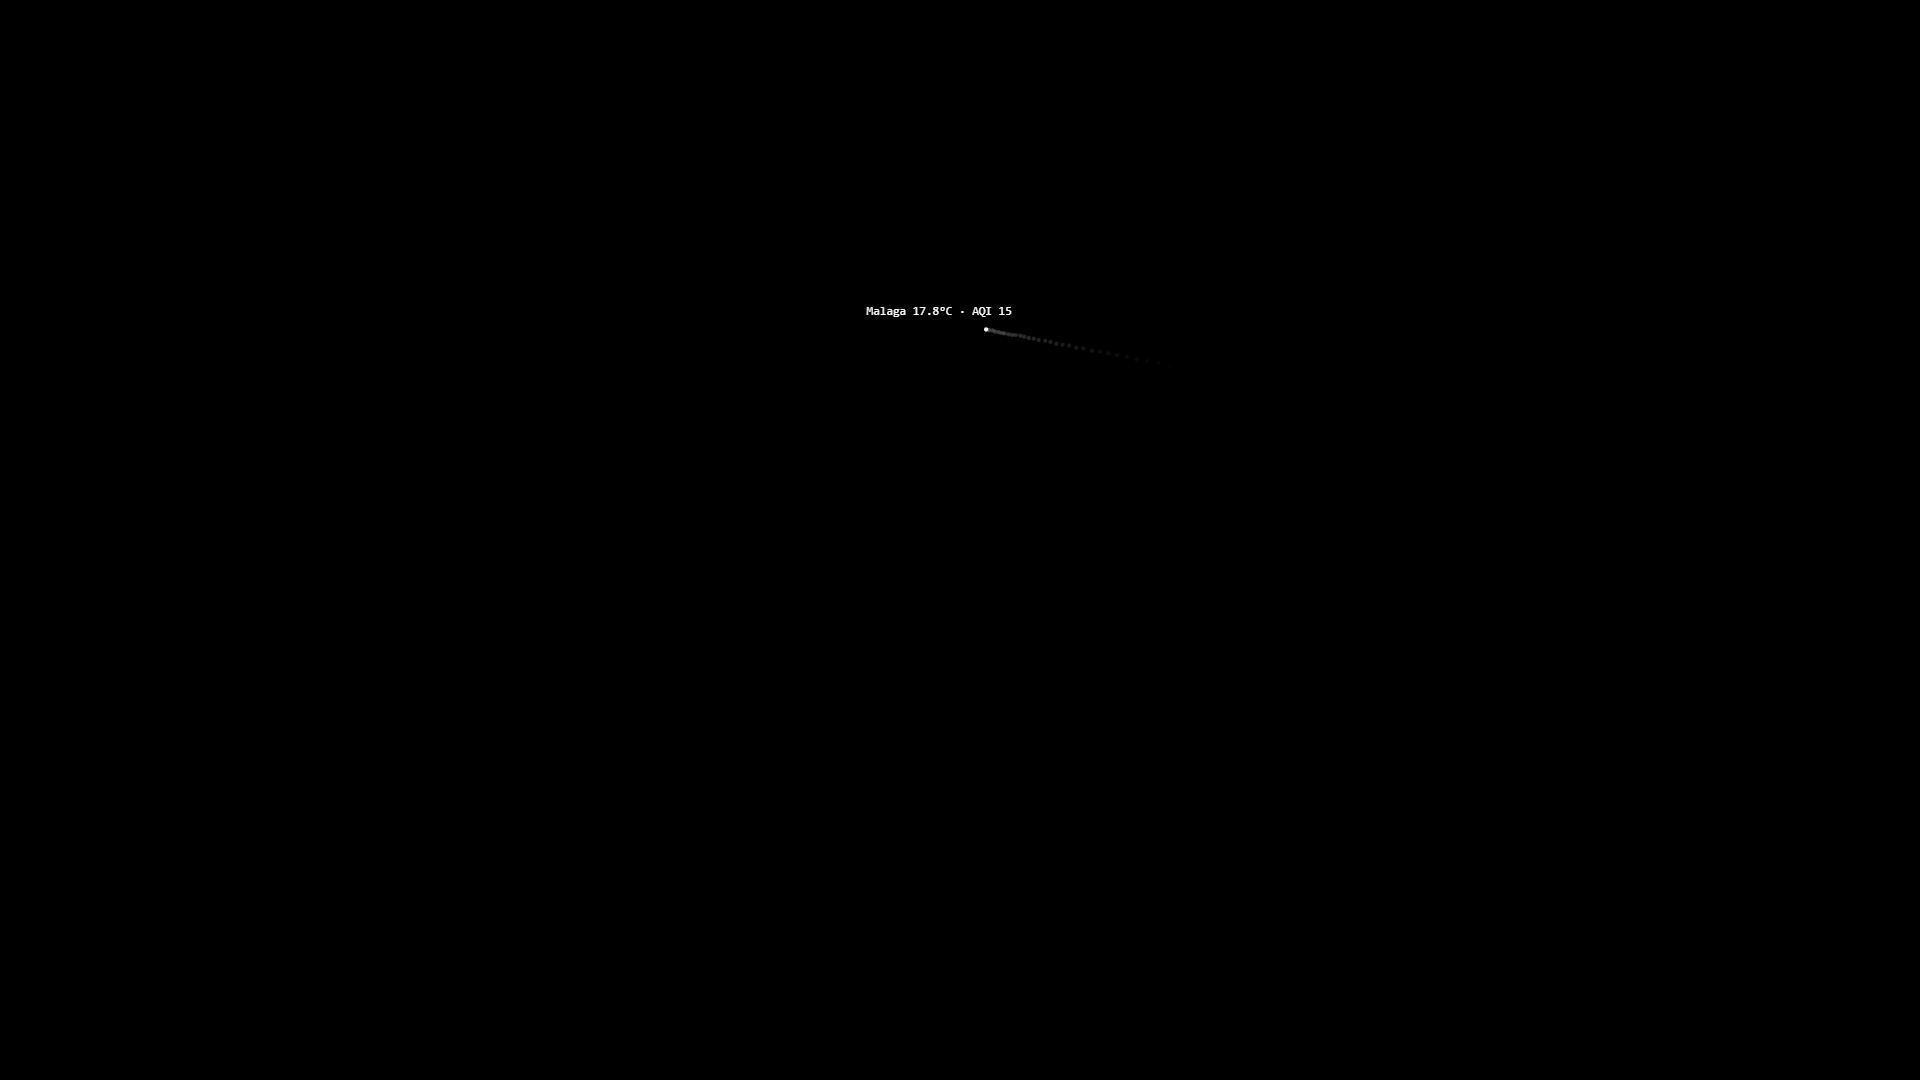
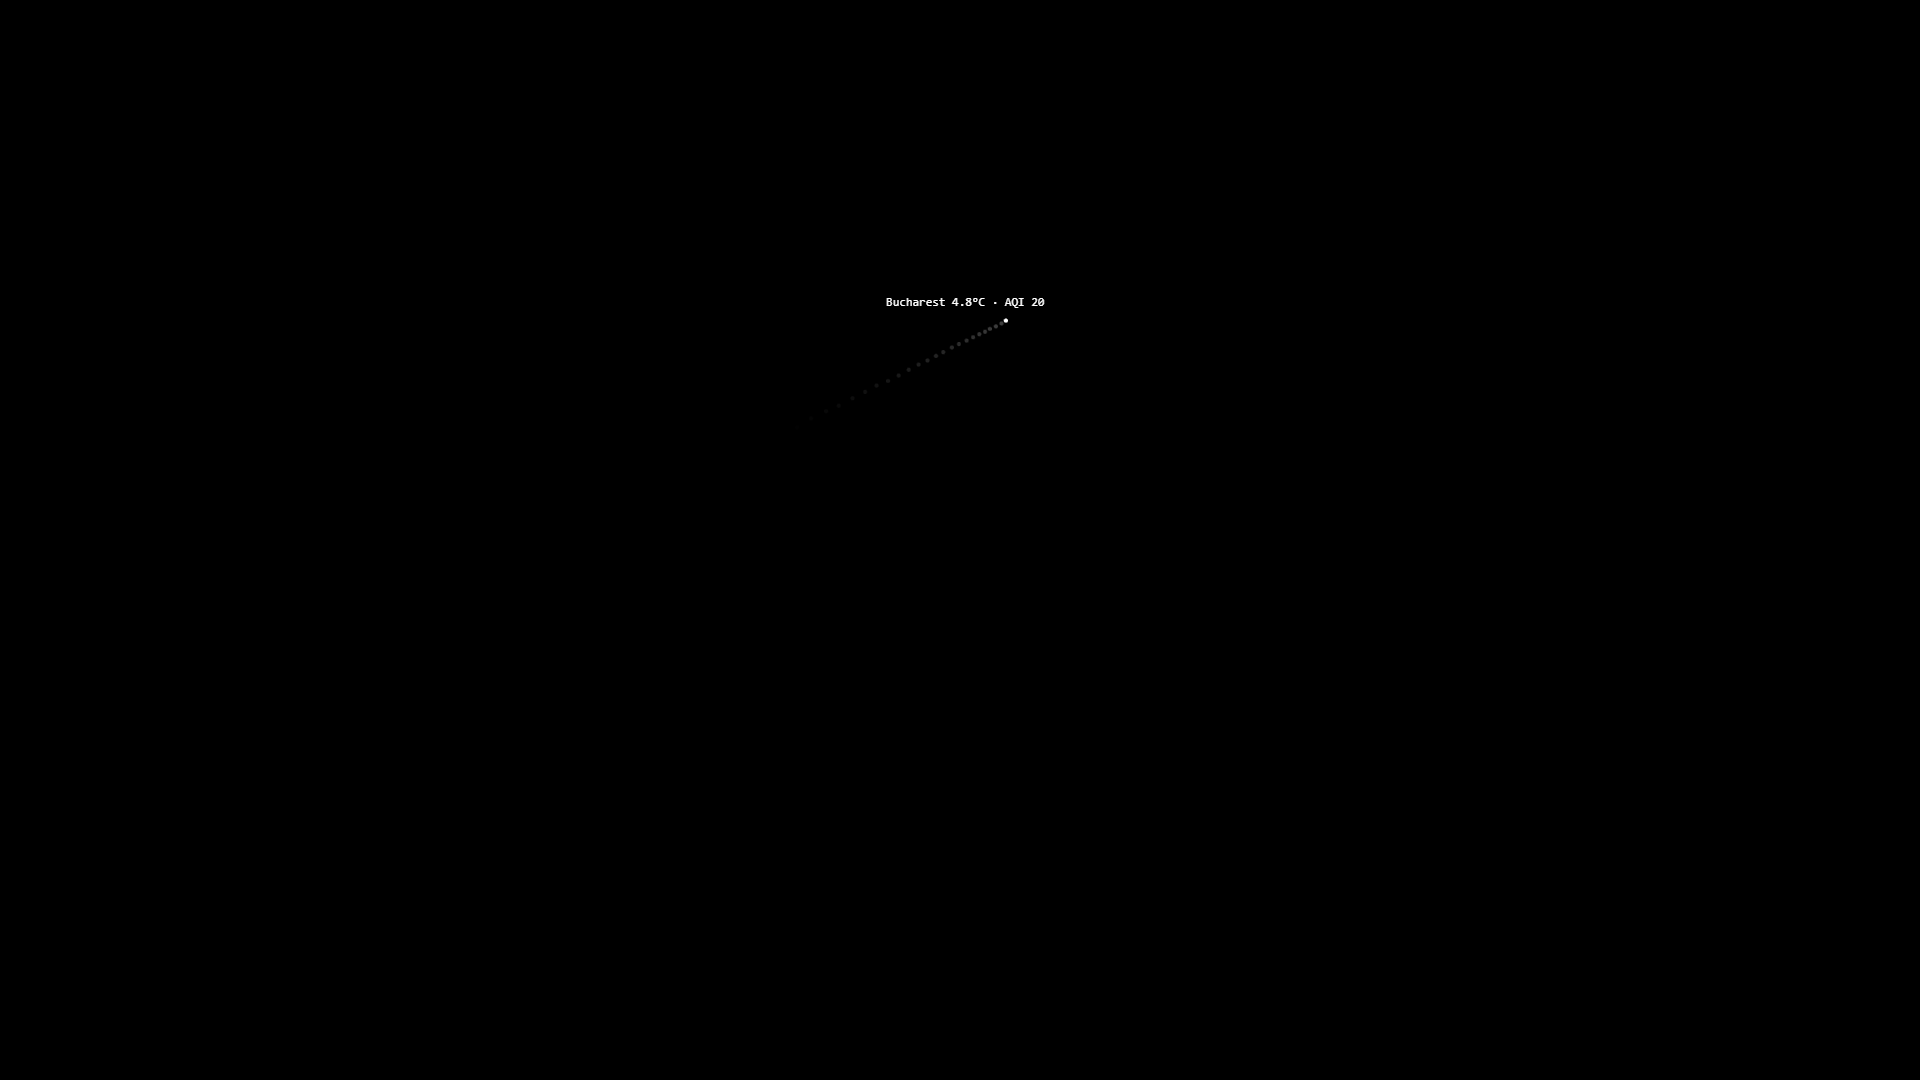
With the planned launch of 42,000 spacecraft into space, including 12,000 in constant orbit, Elon Musk’s high-speed satellite internet network, Starlink, now encircles the entire planet. This proliferation of objects generates enormous light pollution in space and also poses a threat to the terrestrial environment. According to some studies, each launch consumes nearly 2 million liters of potable water and burns more than 1,200 tons of highly polluting fuel. The StarInk project is a metaphorical reinterpretation of this satellite constellation, designed to display real-time weather data from major world capitals. A point, or pixel, moves across the screen on an invisible yet very real map of the globe. When it stabilizes, it shows the temperature and air pollution index of the city it hovers over. Its size corresponds to the population of that city. The more the point shakes, the higher the pollution level of the city. The higher the temperature (beyond 28 °C), the more the point becomes blurred. Through this project, the viewer is invited to experience an ambivalence: behind the spectacle of a luminous arc of points tracing the celestial vault lies a genuine ecological disaster.
Avec le lancement prévu de 42000 engins spatiaux, dont 12 000 en orbite constante, le réseau internet par satellite à haut débit d’Elon Musk, Starlink, entoure désormais la planète entière. Cette prolifération d’objets génère une énorme pollution lumineuse dans l’espace et constitue également une menace pour l’environnement terrestre. Selon certaines études, chaque lancement consommerait près de 2 millions de litres d’eau potable et brûlerait plus de 1200 tonnes de carburant hautement polluant. Le projet StarInk est une réinterprétation métaphorique de cette constellation de satellites, conçue pour afficher les données météorologiques en temps réel des grandes capitales du monde. Un point, ou pixel, se déplace à l’écran sur une carte invisible mais bien réelle du globe. Lorsqu’il se stabilise, il indique la température et l’indice de pollution de l’air de la ville survolée. Sa taille correspond à la population de cette ville. Plus le point tremble, plus le niveau de pollution de la ville est élevé. Plus la température est haute (au-delà de 28°C), plus le point devient flou.À travers ce projet, le spectateur est invité à ressentir une ambivalence : derrière le spectacle d’un arc lumineux de points traçant la voûte céleste se cache un véritable désastre écologique.
Images of Starlink satellites

The trail of SpaceX’s 60 Starlink satellites, filmed on May 24, 2019 by Dutch astronomer Marco Langbroek.

SpaceX spoiled the show again. While astronomers and enthusiasts were expecting to watch a meteor shower during the night of November 21 to 22, about a dozen Starlink satellites crossed the sky at the same time.
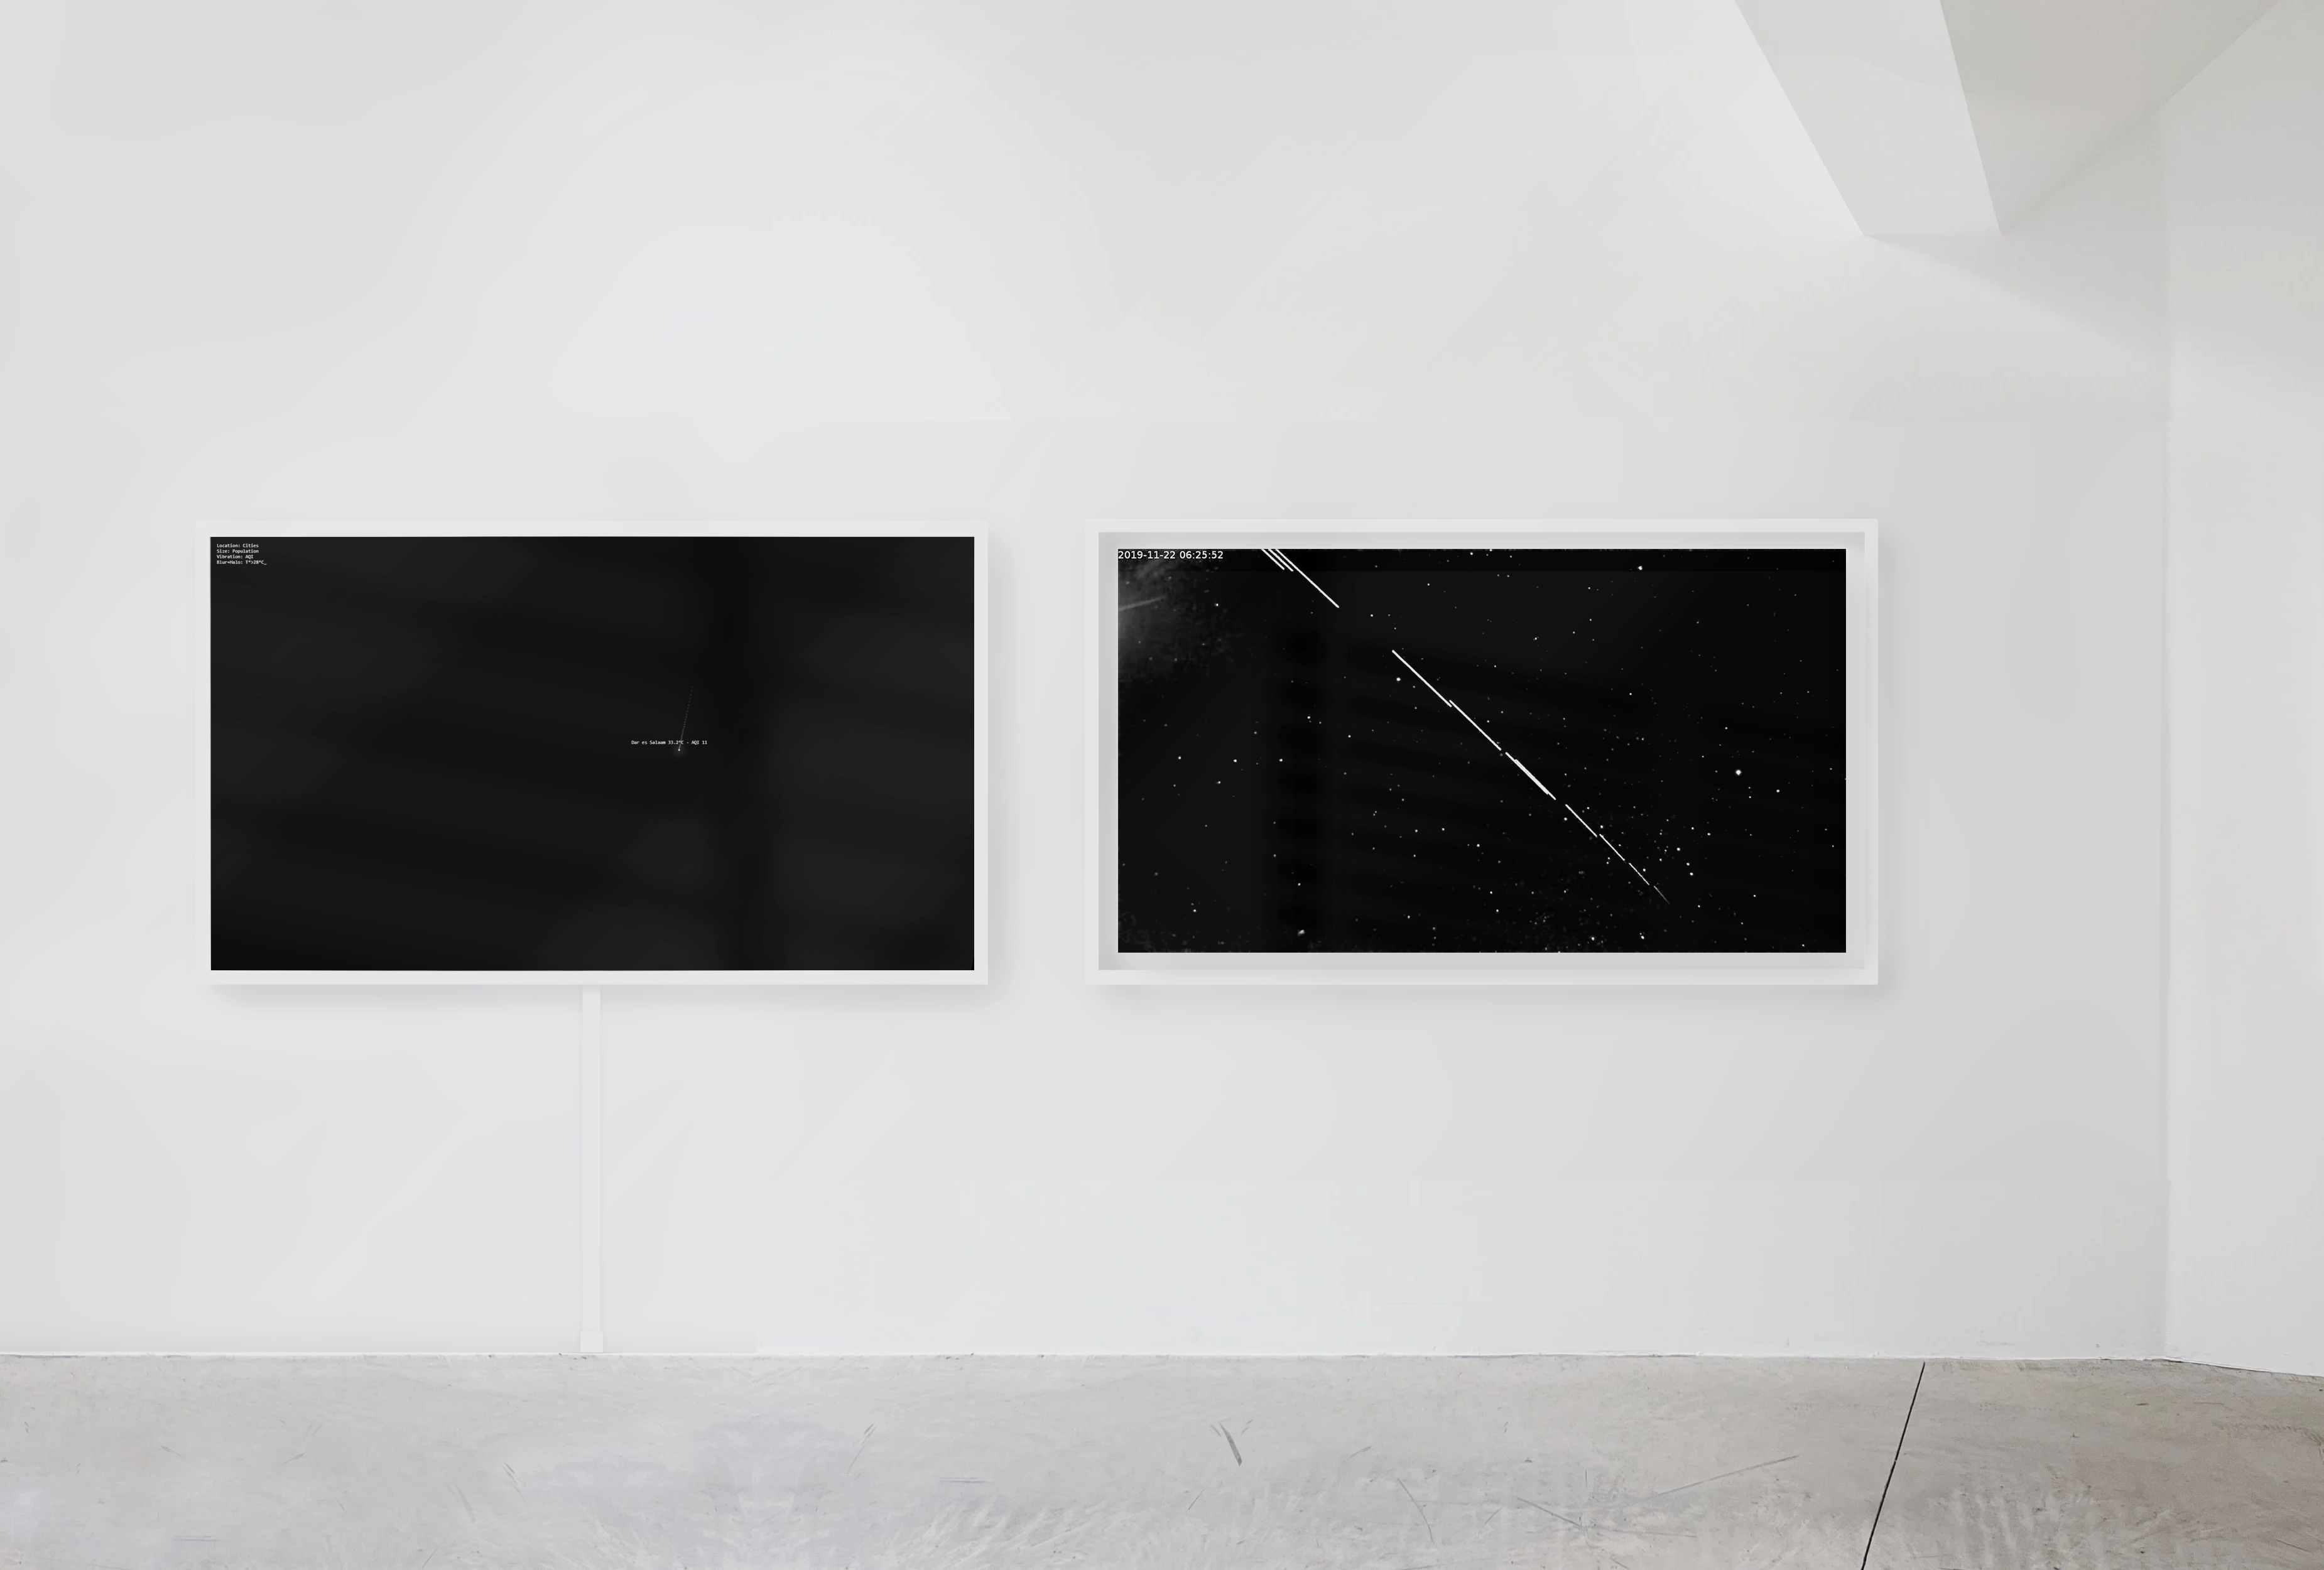
Images of StarInk data art project


Video preview
Data sources
Free Weather API. Open-Meteo (open-source weather API): open-meteo.com; Air Quality API. Pollutants and pollen forecast in 11 km resolution: open-meteo.com
This data visualization was designed and coded by David Bihanic (2025).
To mention: David Bihanic, “StarInk”, December 2025. Retrieved from davidbihanic.com/startink