At the crossroads of data design and data art, “Data Shapes” is an experimental project that introduces a realtime way to visualize the global flow of public data (referring to both free and open data). Rather than the data itself, our ambition was to shape the continuous flow of massive amounts of data that overwhelm us daily (public data deluge), and for which we don’t really have a broad picture. In other words, we tried to give an aesthetic form to massive streams of data that cannot be conventionally assessed either manually or intellectually.
Abstract
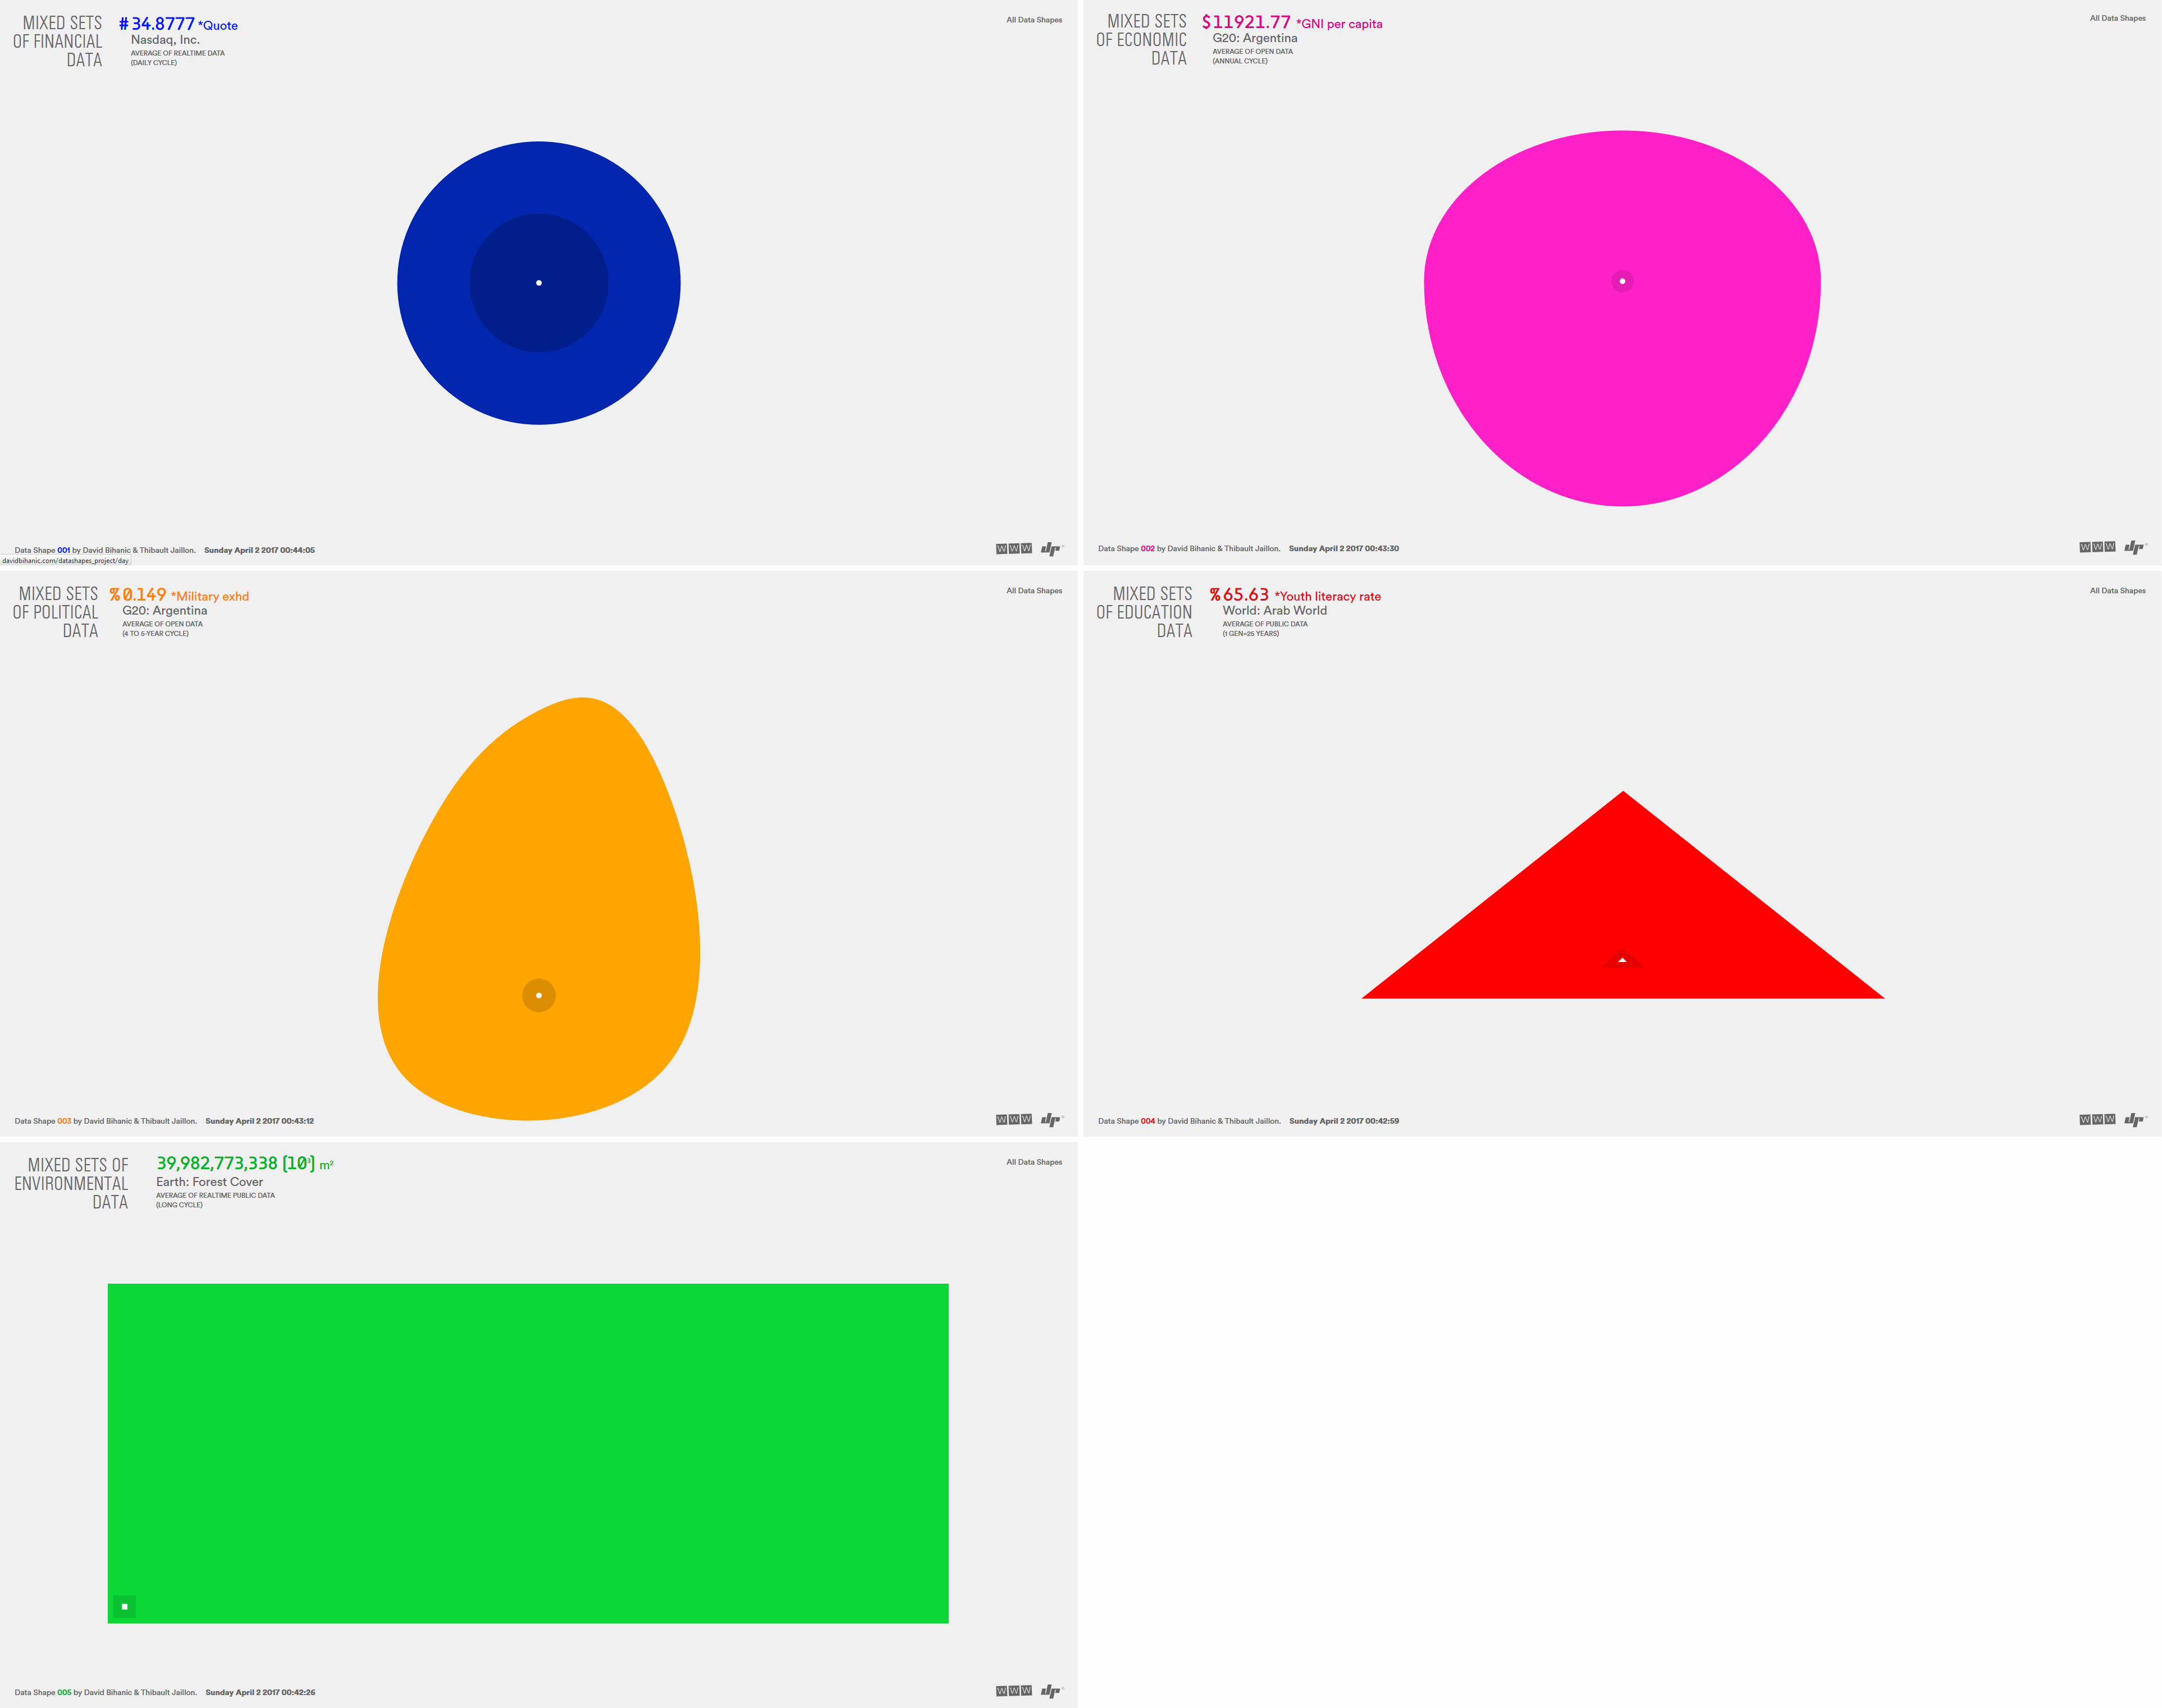
A key challenge for designers is to be able to present large amounts of data in very clear and simple ways. By this, it involves bypassing, if not eliminating entirely, sophisticated forms and convoluted graphics, as well as countless textual metadata (legends or notes). High-dimensional data space, requiring the use of advanced user tools to navigate inside, is also to avoid. What it boils down to is nothing other than data assimilated into straightforward and captivating forms. The stake is high: successfully creating primitive or minimal shapes stripped down to their very essence for the purposes of delivering both a sensitive and meaningful experience of datasets. Such is the main aim of the “Data Shapes”. “Data Shapes” is an experimental project at the crossroads of data design and data art that introduces a realtime way for visualizing global flow of public data (referring to both free and open data). Rather than the data itself, our ambition was to shape the continuous flow of massive amounts of data that overwhelm us daily (public data deluge), and for which we do not really have a broad picture. In other words, we tried to give an aesthetic form to massive streams of data that cannot be conventionally assessed either manually or intellectually. To do so, we transformed the massive data flows into pure and primitives vector forms which are able to react and change according to data generation and updates. All graphical forms became data-based shapes that evolve in real time. All these elementary geometric forms are generated from the flow of huge data sets (recovered public data from different API systems). All its visual and graphical attributes (its color, its size, and its own type of form, square, circle, triangle, and so on) are determined by the characteristics of extracted data. Moreover, all the geometric distortions of the original shapes are also related to the master data characteristics. In addition, the animation speed is also calculated based on the increased density of data flows. “Data Shapes” consists of a series of 5 data visualizations that must be perceived and understood as a whole. Each of these data visualizations relates to a specific public domain and consequently pulls free and open data from a large number of databases updated on an on-going basis: mixed sets of financial data (following a daily cycle), economical data (one-year cycle), political data and cultural data (a four to five-year cycle), as well as datasets on education (one generation, approximately 25 years) and the global environment (long period, 50 years or more), etc. The aesthetic appearance of forms is in conformity with the developments and evolutions in the field concerned — the world’s data flows can be therefore observed simply by following the changes of forms displayed. Some data-based shapes may have to change very fast, while others will move and evolve slowly over time; such a contrast reveals a new striking picture of the present world and provides us a concrete experience of time passing. More broadly, we attempt to prove in this project that data visualization should move towards a new formalization approach using pure shapes in order to increase the qualities of perceived aesthetic in data visualization (towards concrete data design) — note that the possibility to infer phenomena from data depends mainly on the aesthetic experience of data itself (as well as of data flows). In a sense, this project responds to the issue of simplicity of forms.
“Data Shapes” is available online. URL: http://davidbihanic.com/datashapes_project/
Screenshots
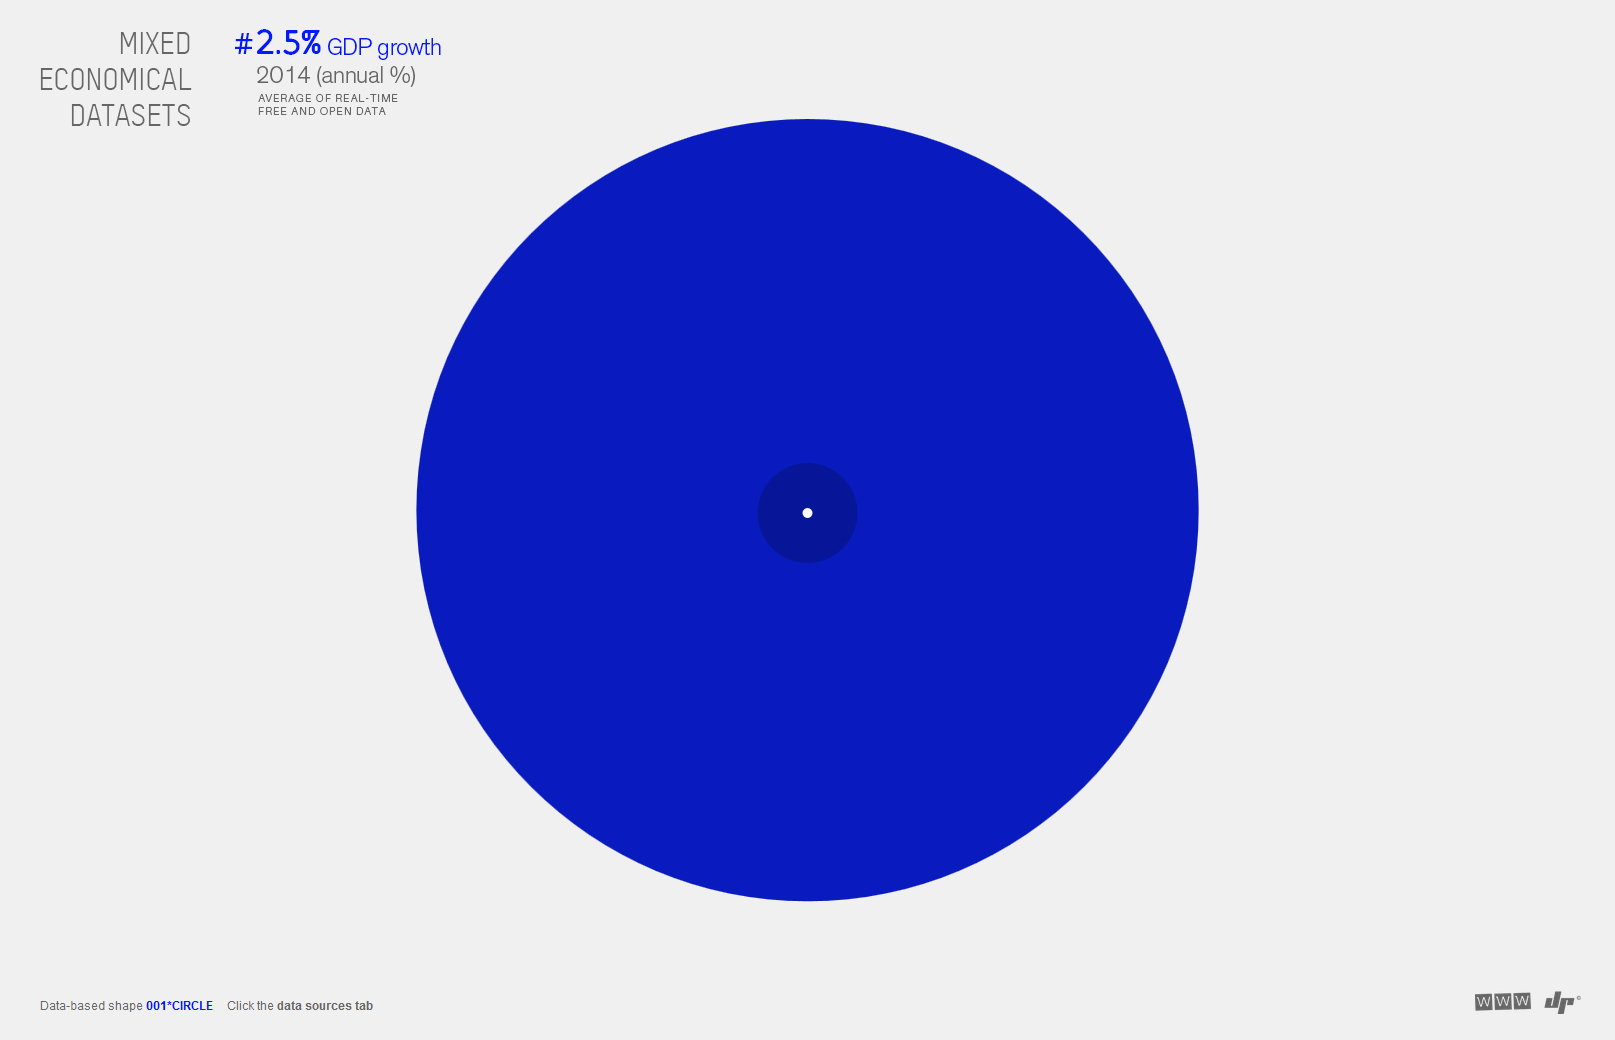
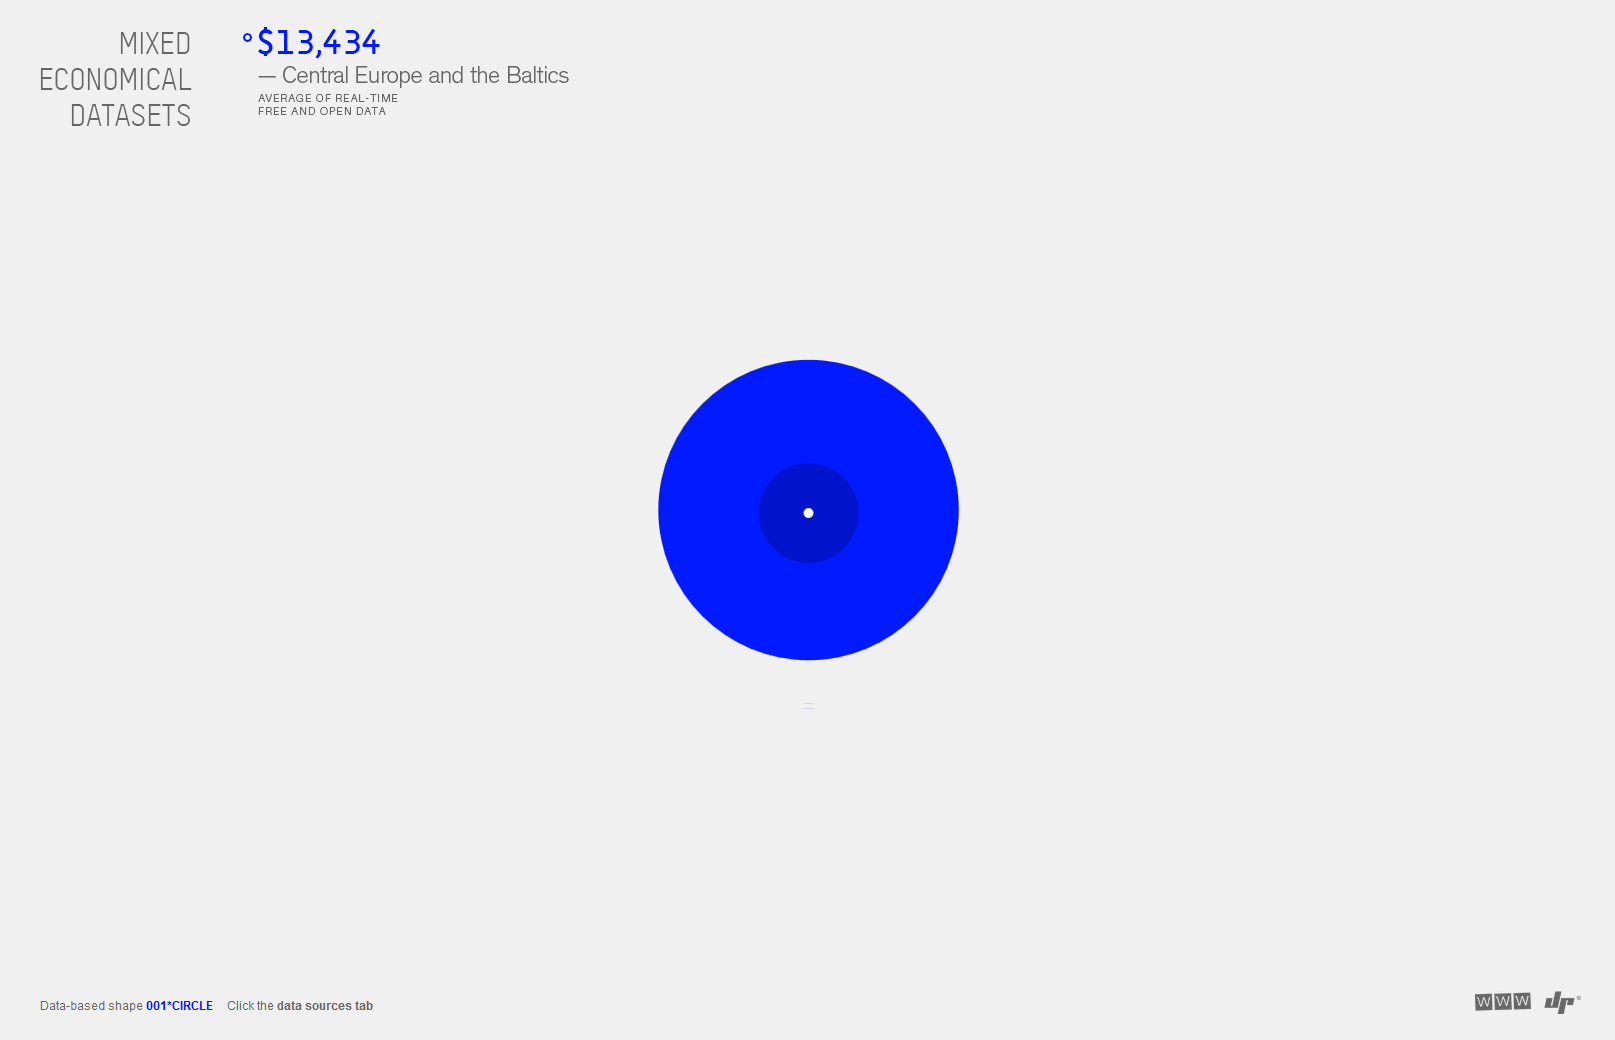
All of these data visualizations will be available online very shortly. Here below the first piece of the series entitled “001 Circle” (blue circle).
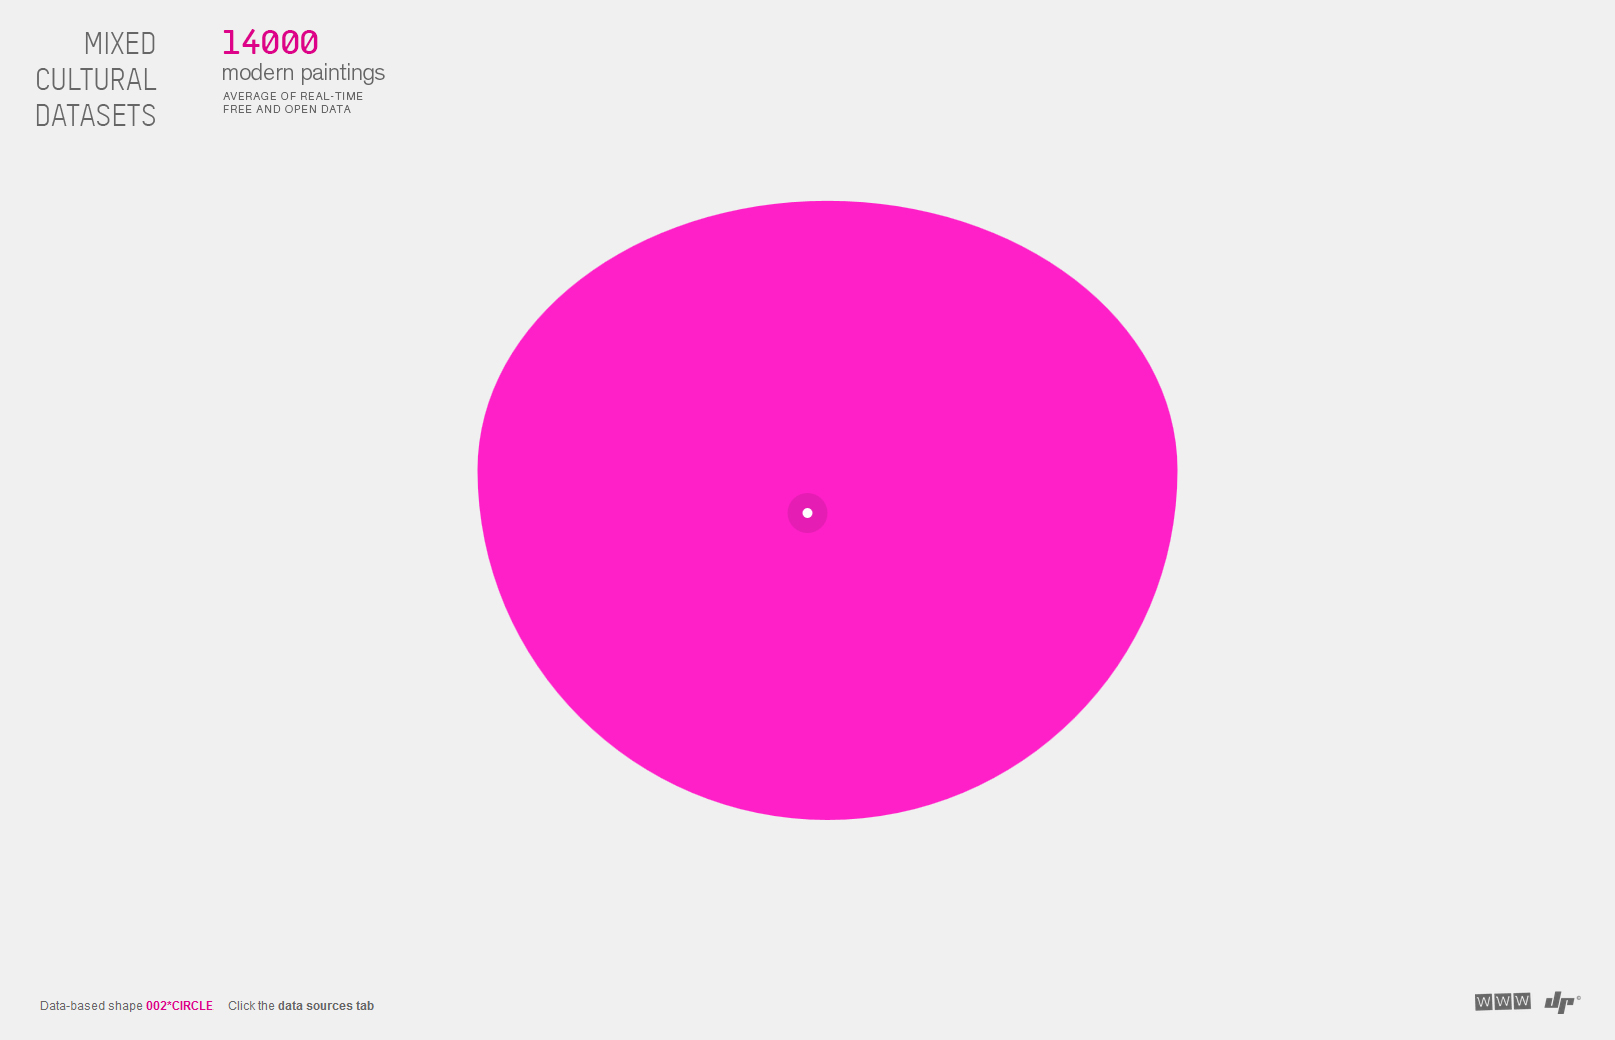
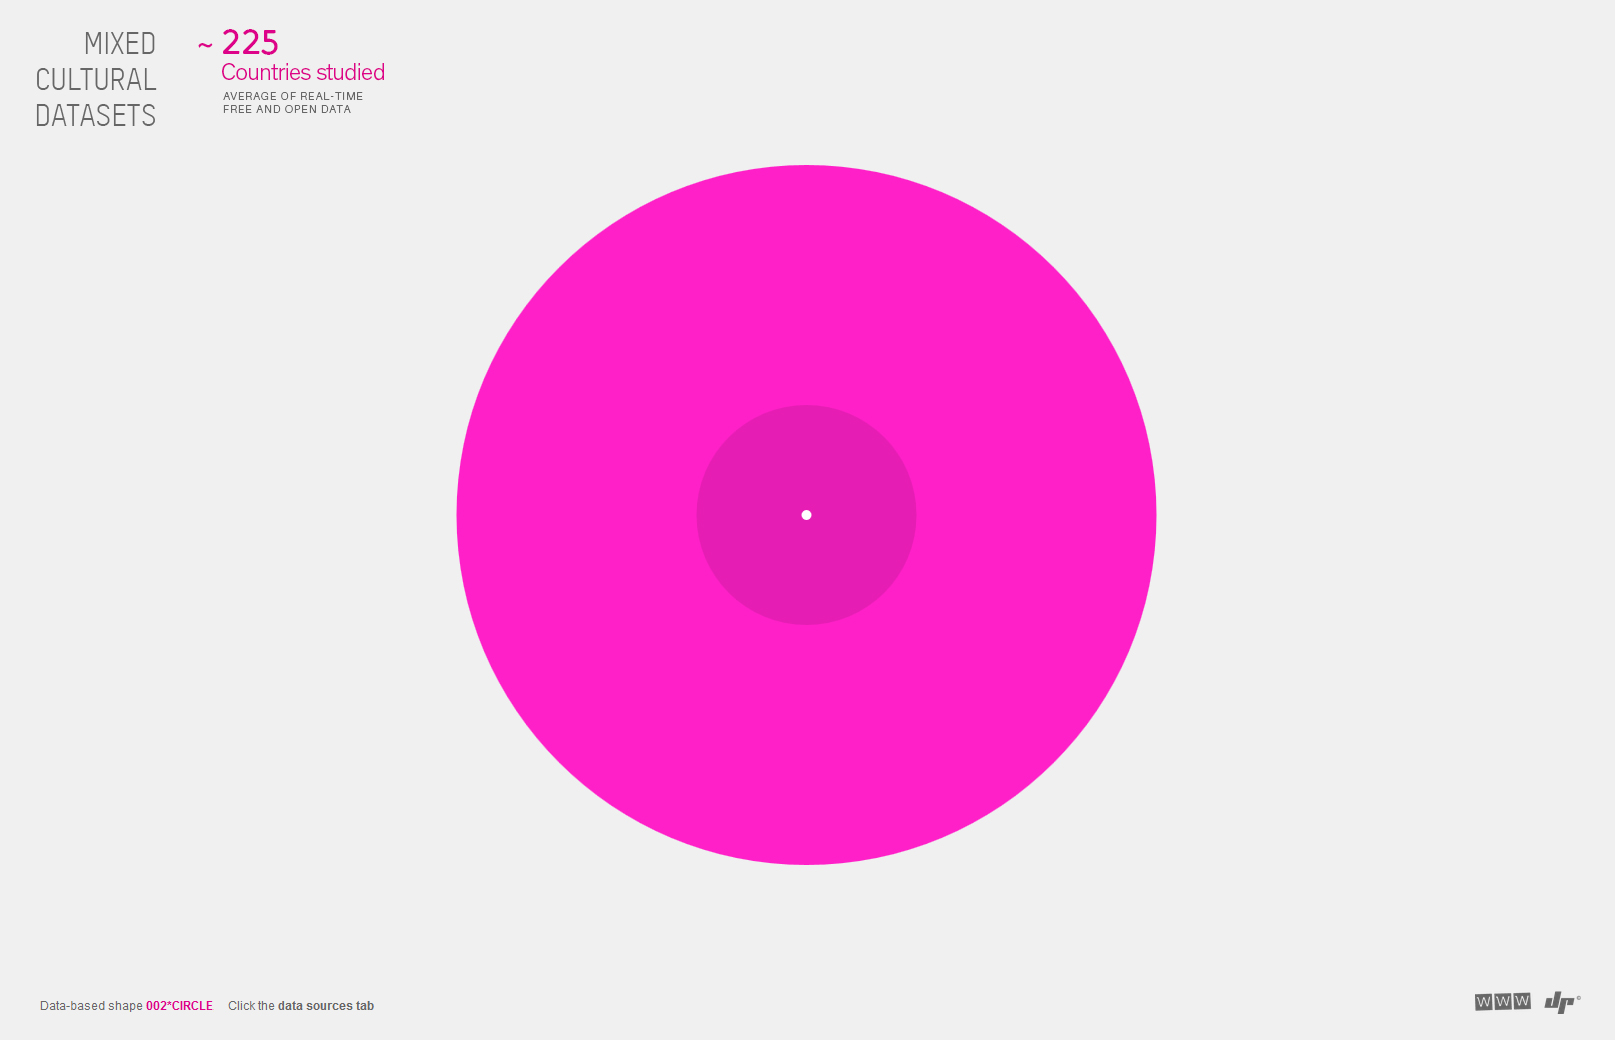
Here below the second piece of the series entitled “002 Circle” (pink circle).
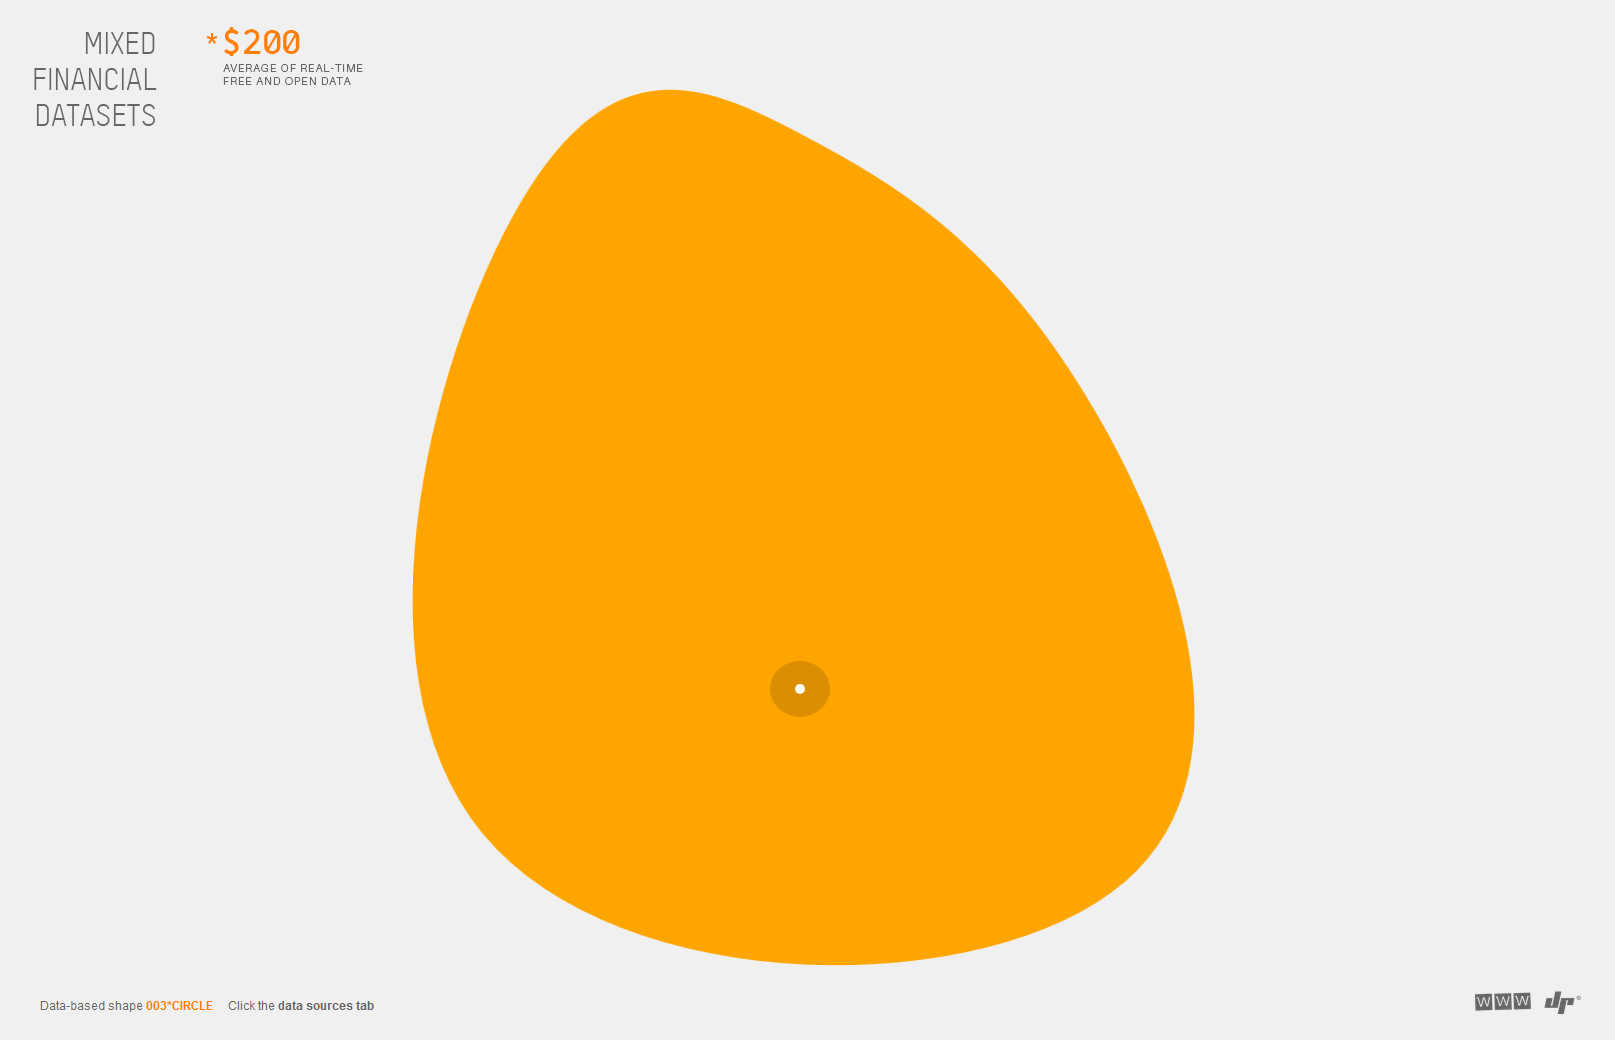
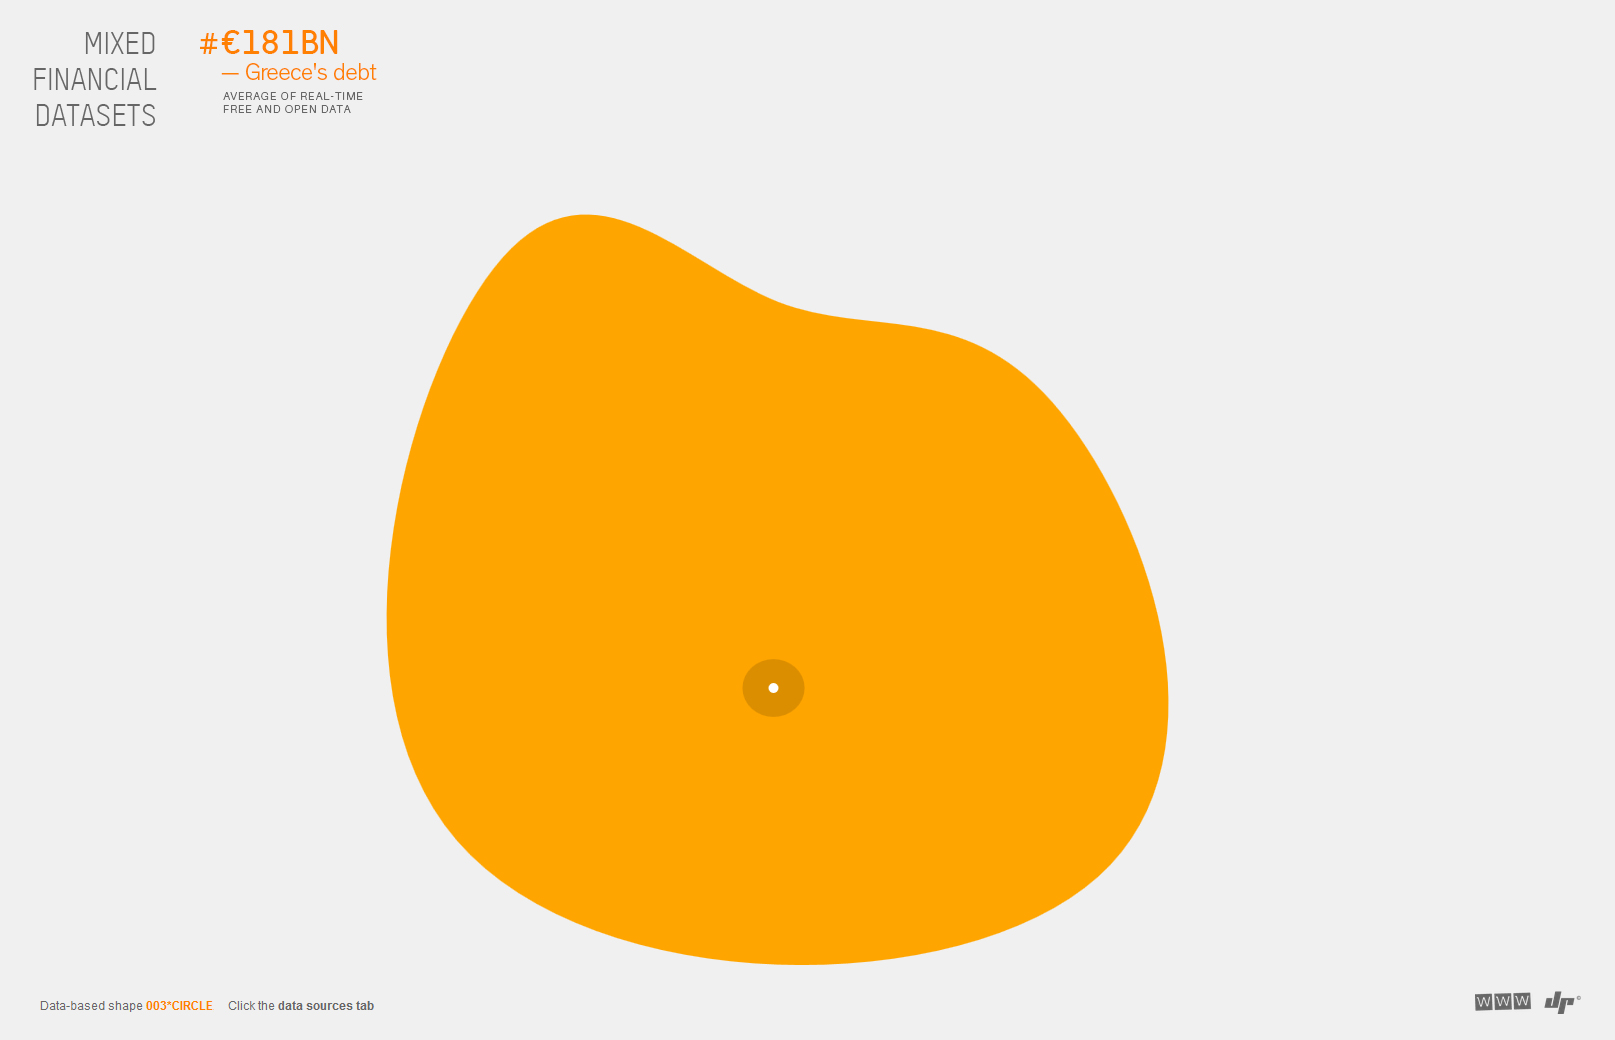
Here below the third piece of the series entitled “003 Circle” (orange circle).
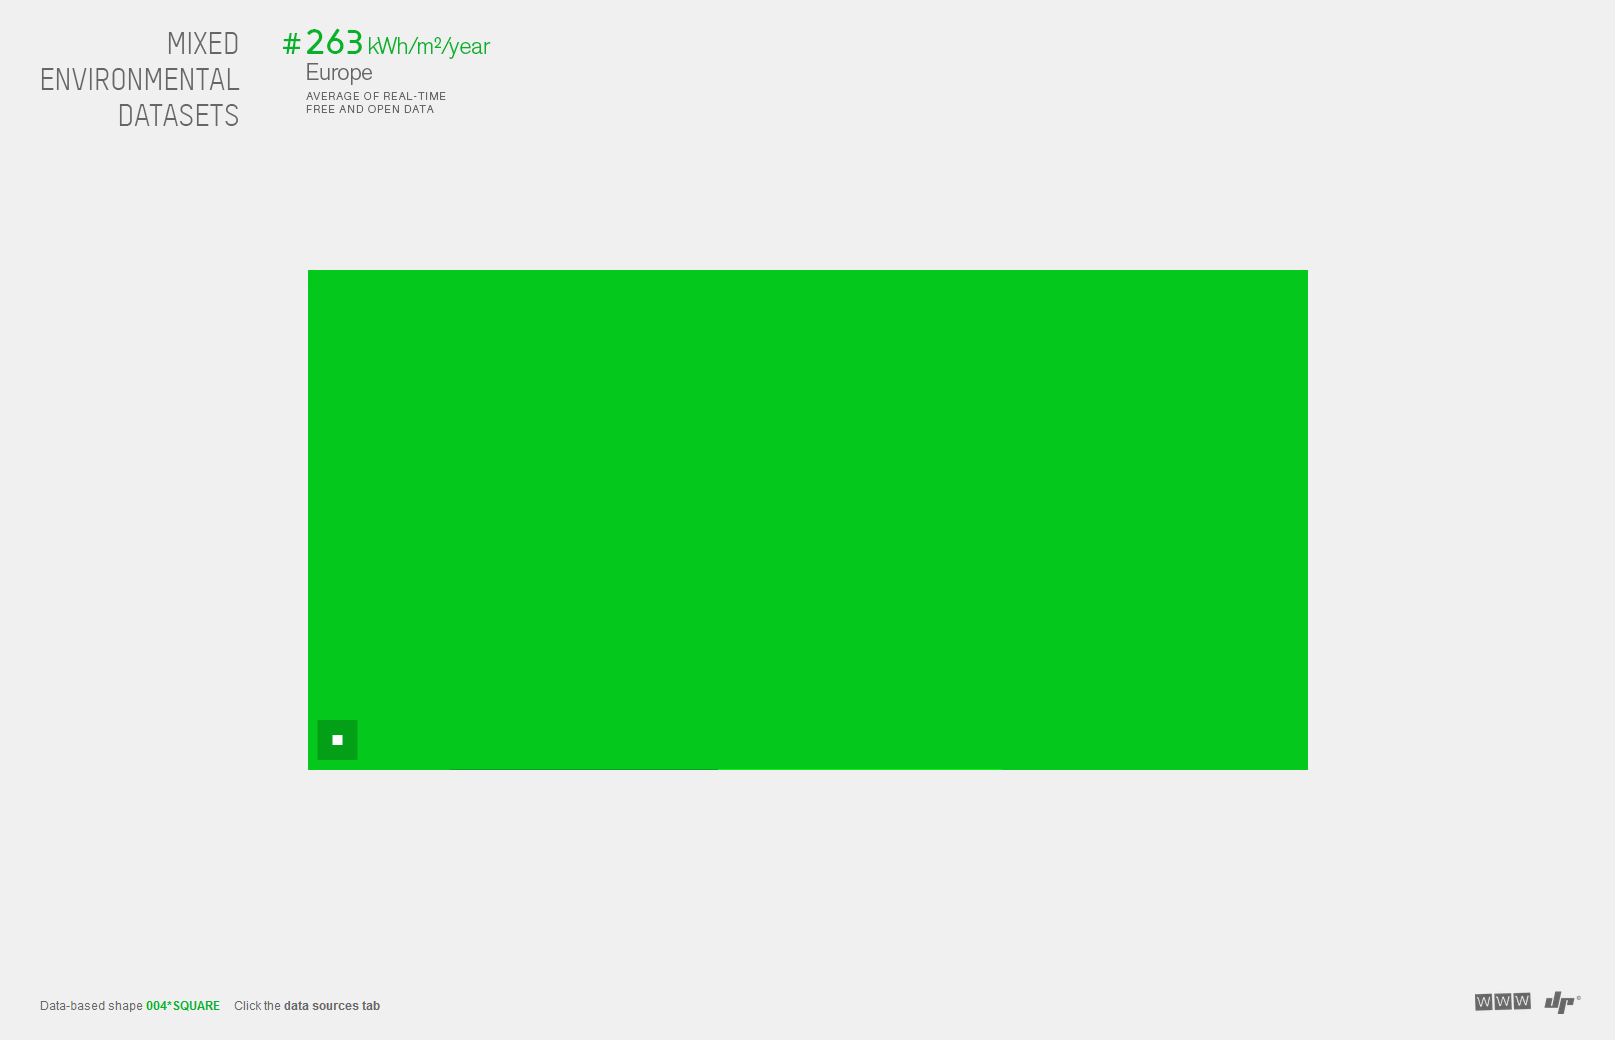
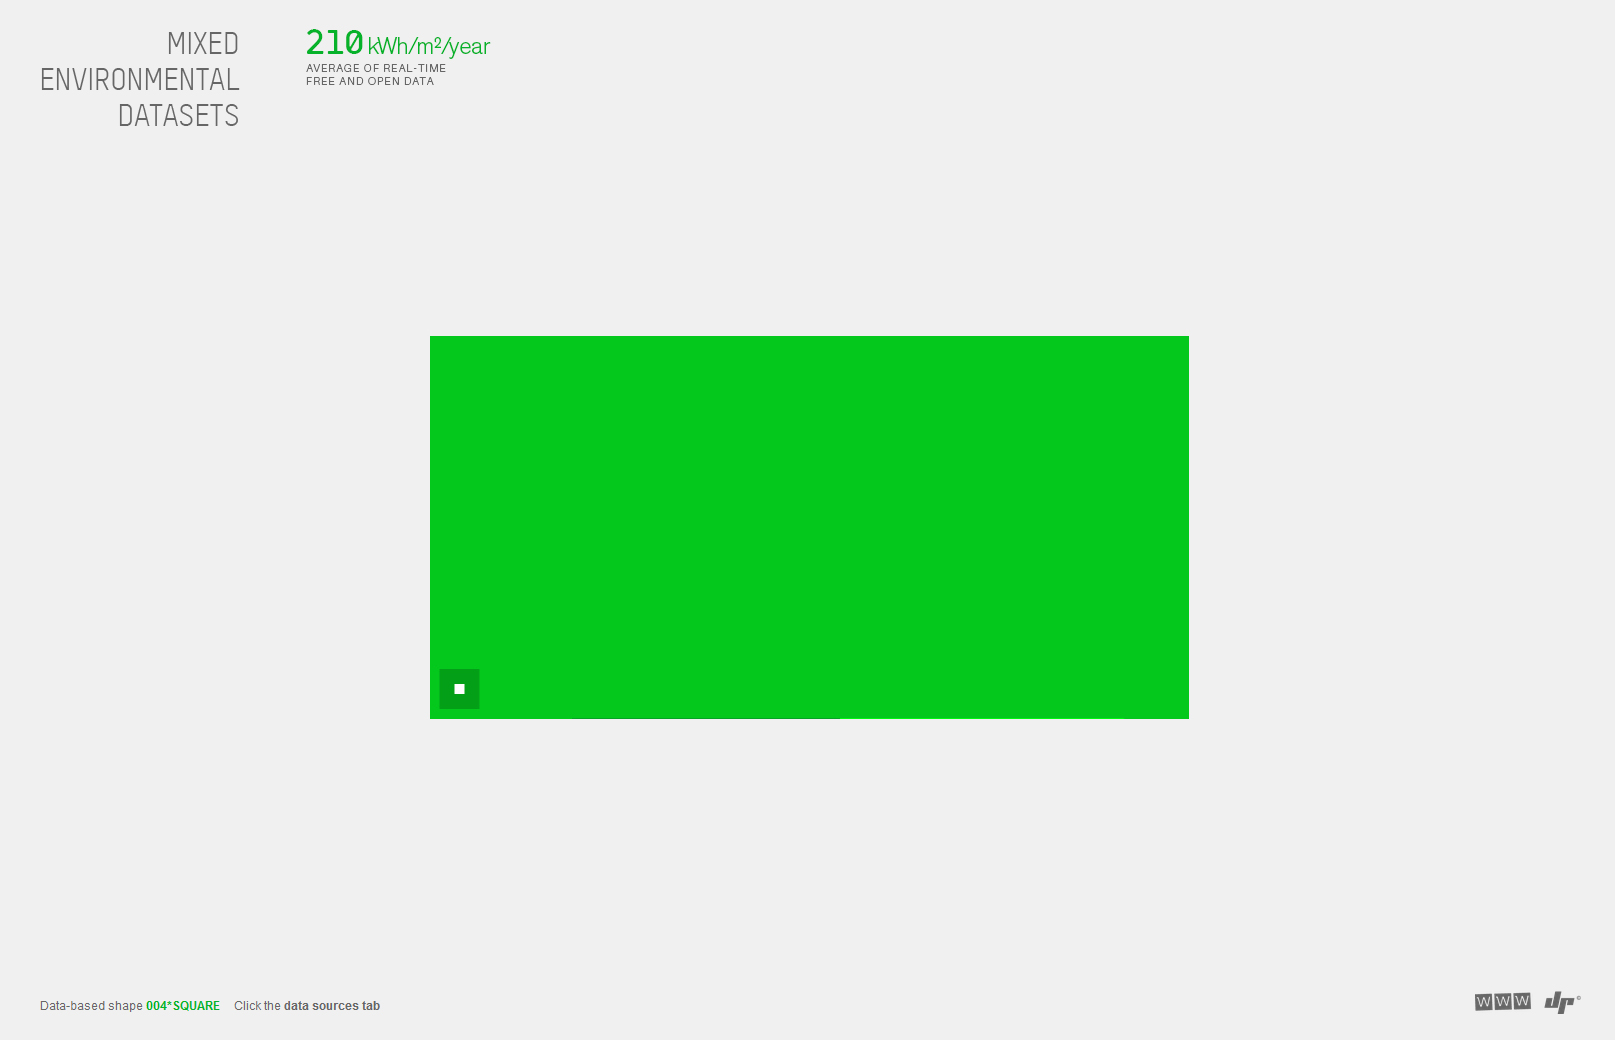
Here below the fourth piece of the series entitled “004 Square” (green rectangle).
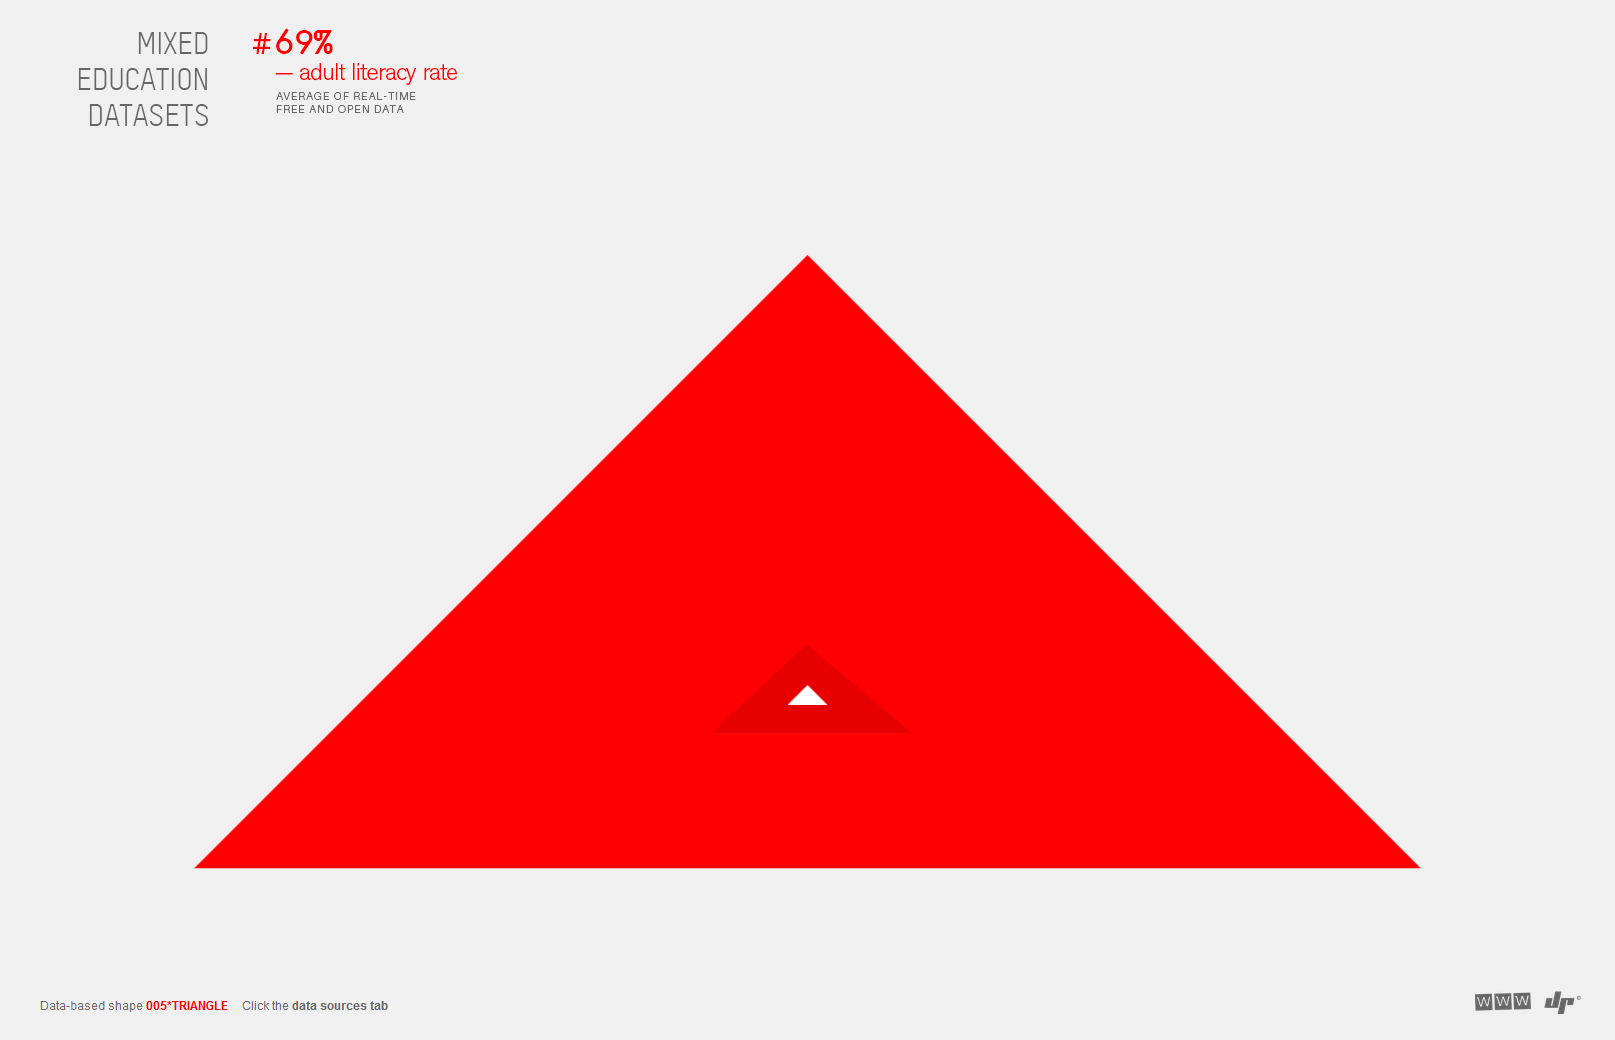
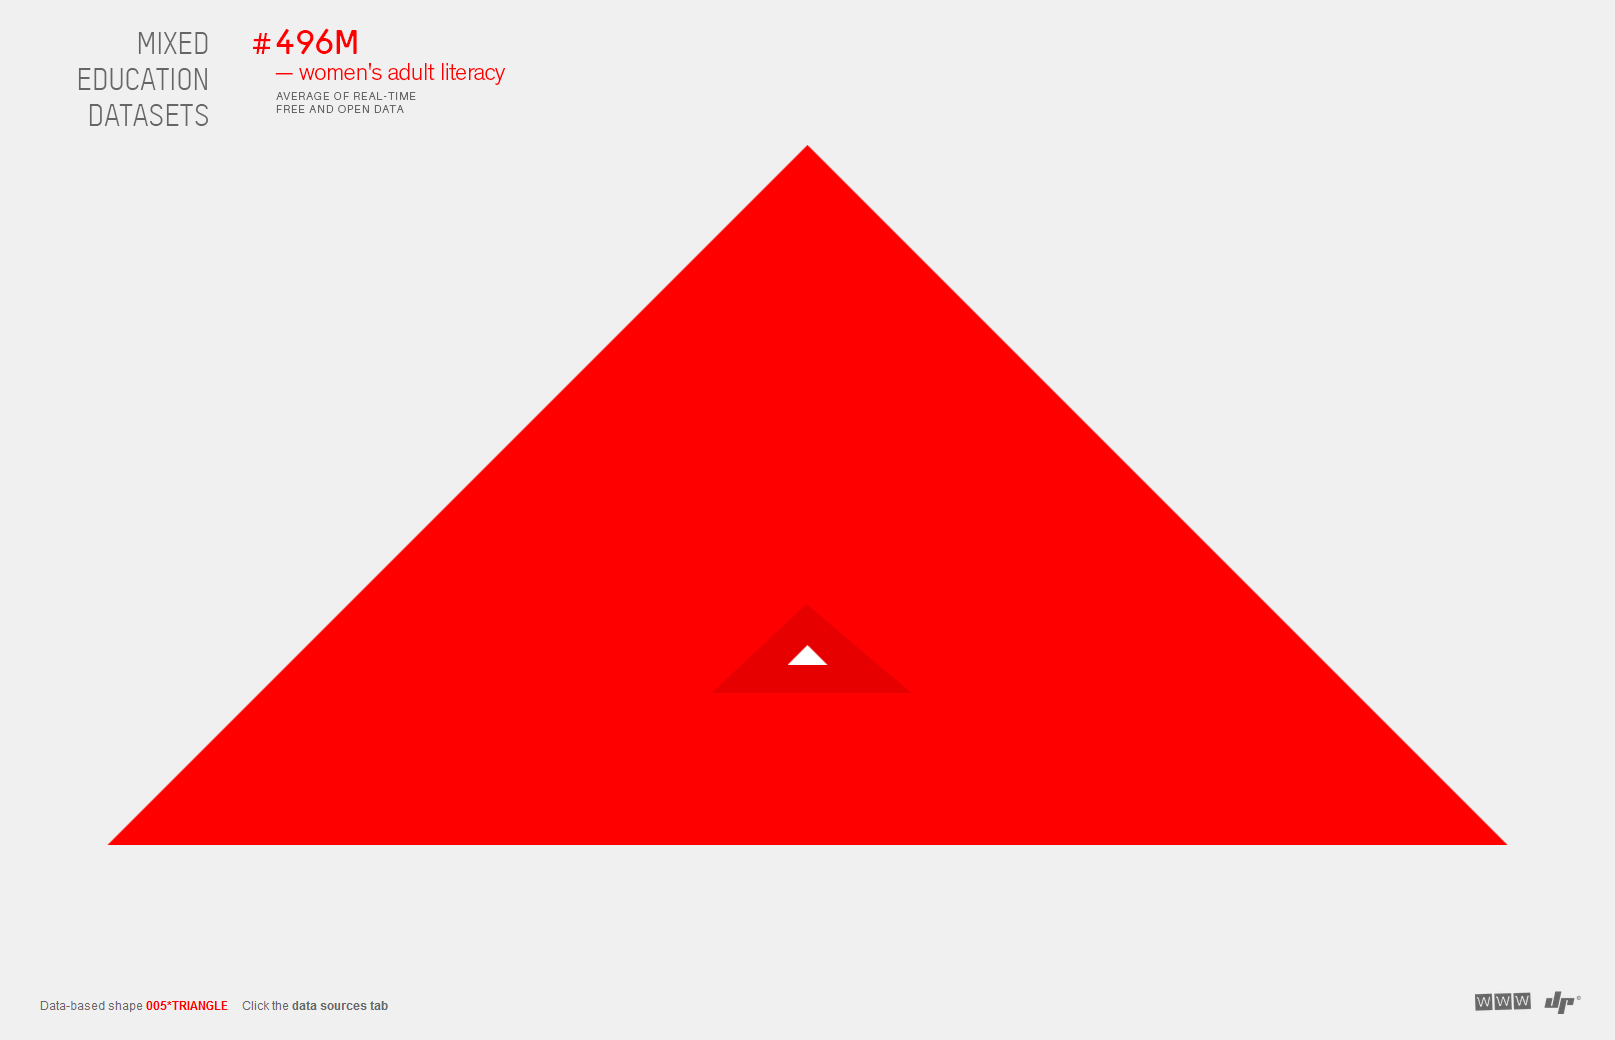
Here below the fifth piece of the series entitled “005 TRIANGLE” (red triangle).
Screencast
A two-person team
UI design and programming: David Bihanic
Data analysis and programming: Thibault Jaillon
Software tools and programming languages: D3.js, Javascript, PHP, JSON/XML
Exhibition
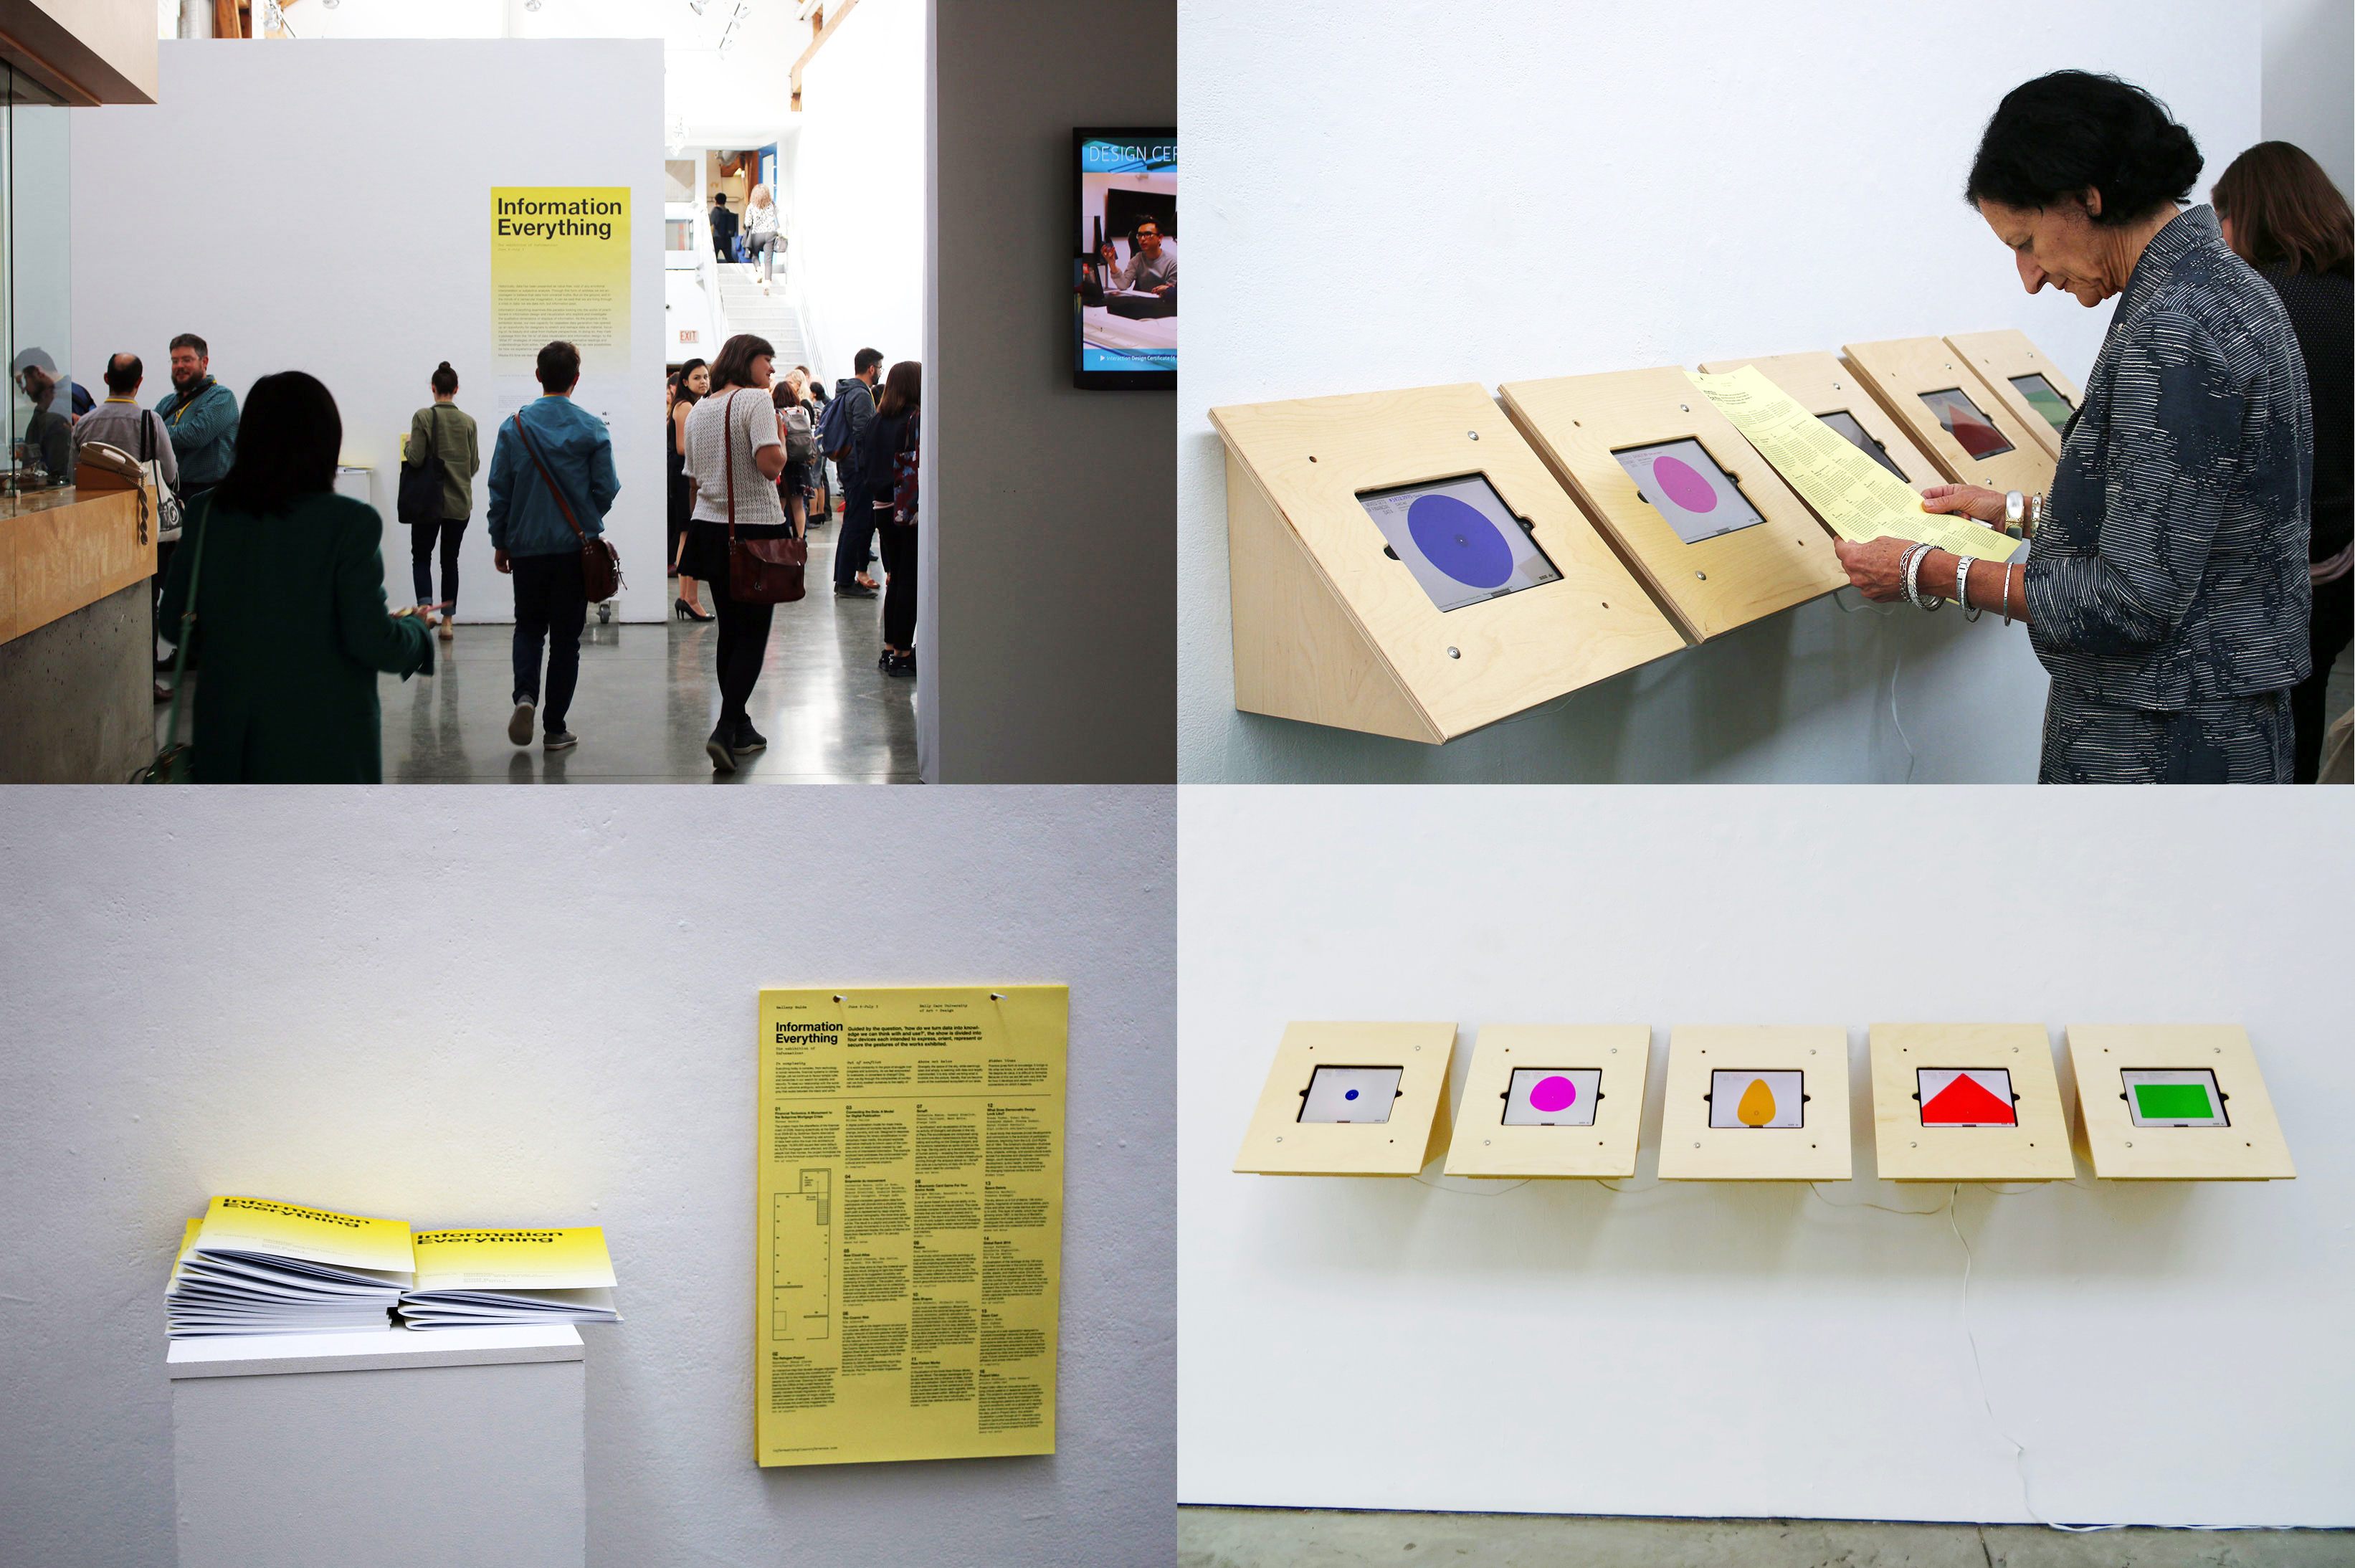
* “Information Everything” exhibition curated by Gillian Russell (independent curator, PhD candidate in Design, Royal College of Art — RCA), London) and Katherine Gillieson (Associate Professor, Emily Carr University of Art + Design). June 6-July 3, 2016, Concourse Gallery, Emily Carr University of Art + Design, Vancouver, BC, Canada.
Download the catalogue here
“(…) The relationship between data and spatial form is a defining trope in David Bihanic’s and Thibault Jaillon’s compelling visualization Data Shapes (2013). The project takes the global flow of live public data as its starting point extending subjectivity to a technological structure. In this multi-screen installation, Bihanic and Jaillon examine the pictorial language of real-time data flows. The result is a series of five seemingly living, breathing organic beings whose very movements and gestures speak to the liveness and density of data in our world”.
— Gillian Russell and Katherine Gillieson, Introduction to the exhibition.
To mention: David Bihanic, Thibault Jaillon, “Data Shapes”, November 2015. Retrieved from davidbihanic.com/datashapes_project