“A curator’s job does not involve wizardry, but requires a wealth of experience and knowledge, responsibility, and a good overview of artistic developments. But if we are lucky, we curators still manage to enchant visitors with the results.”
―René Block
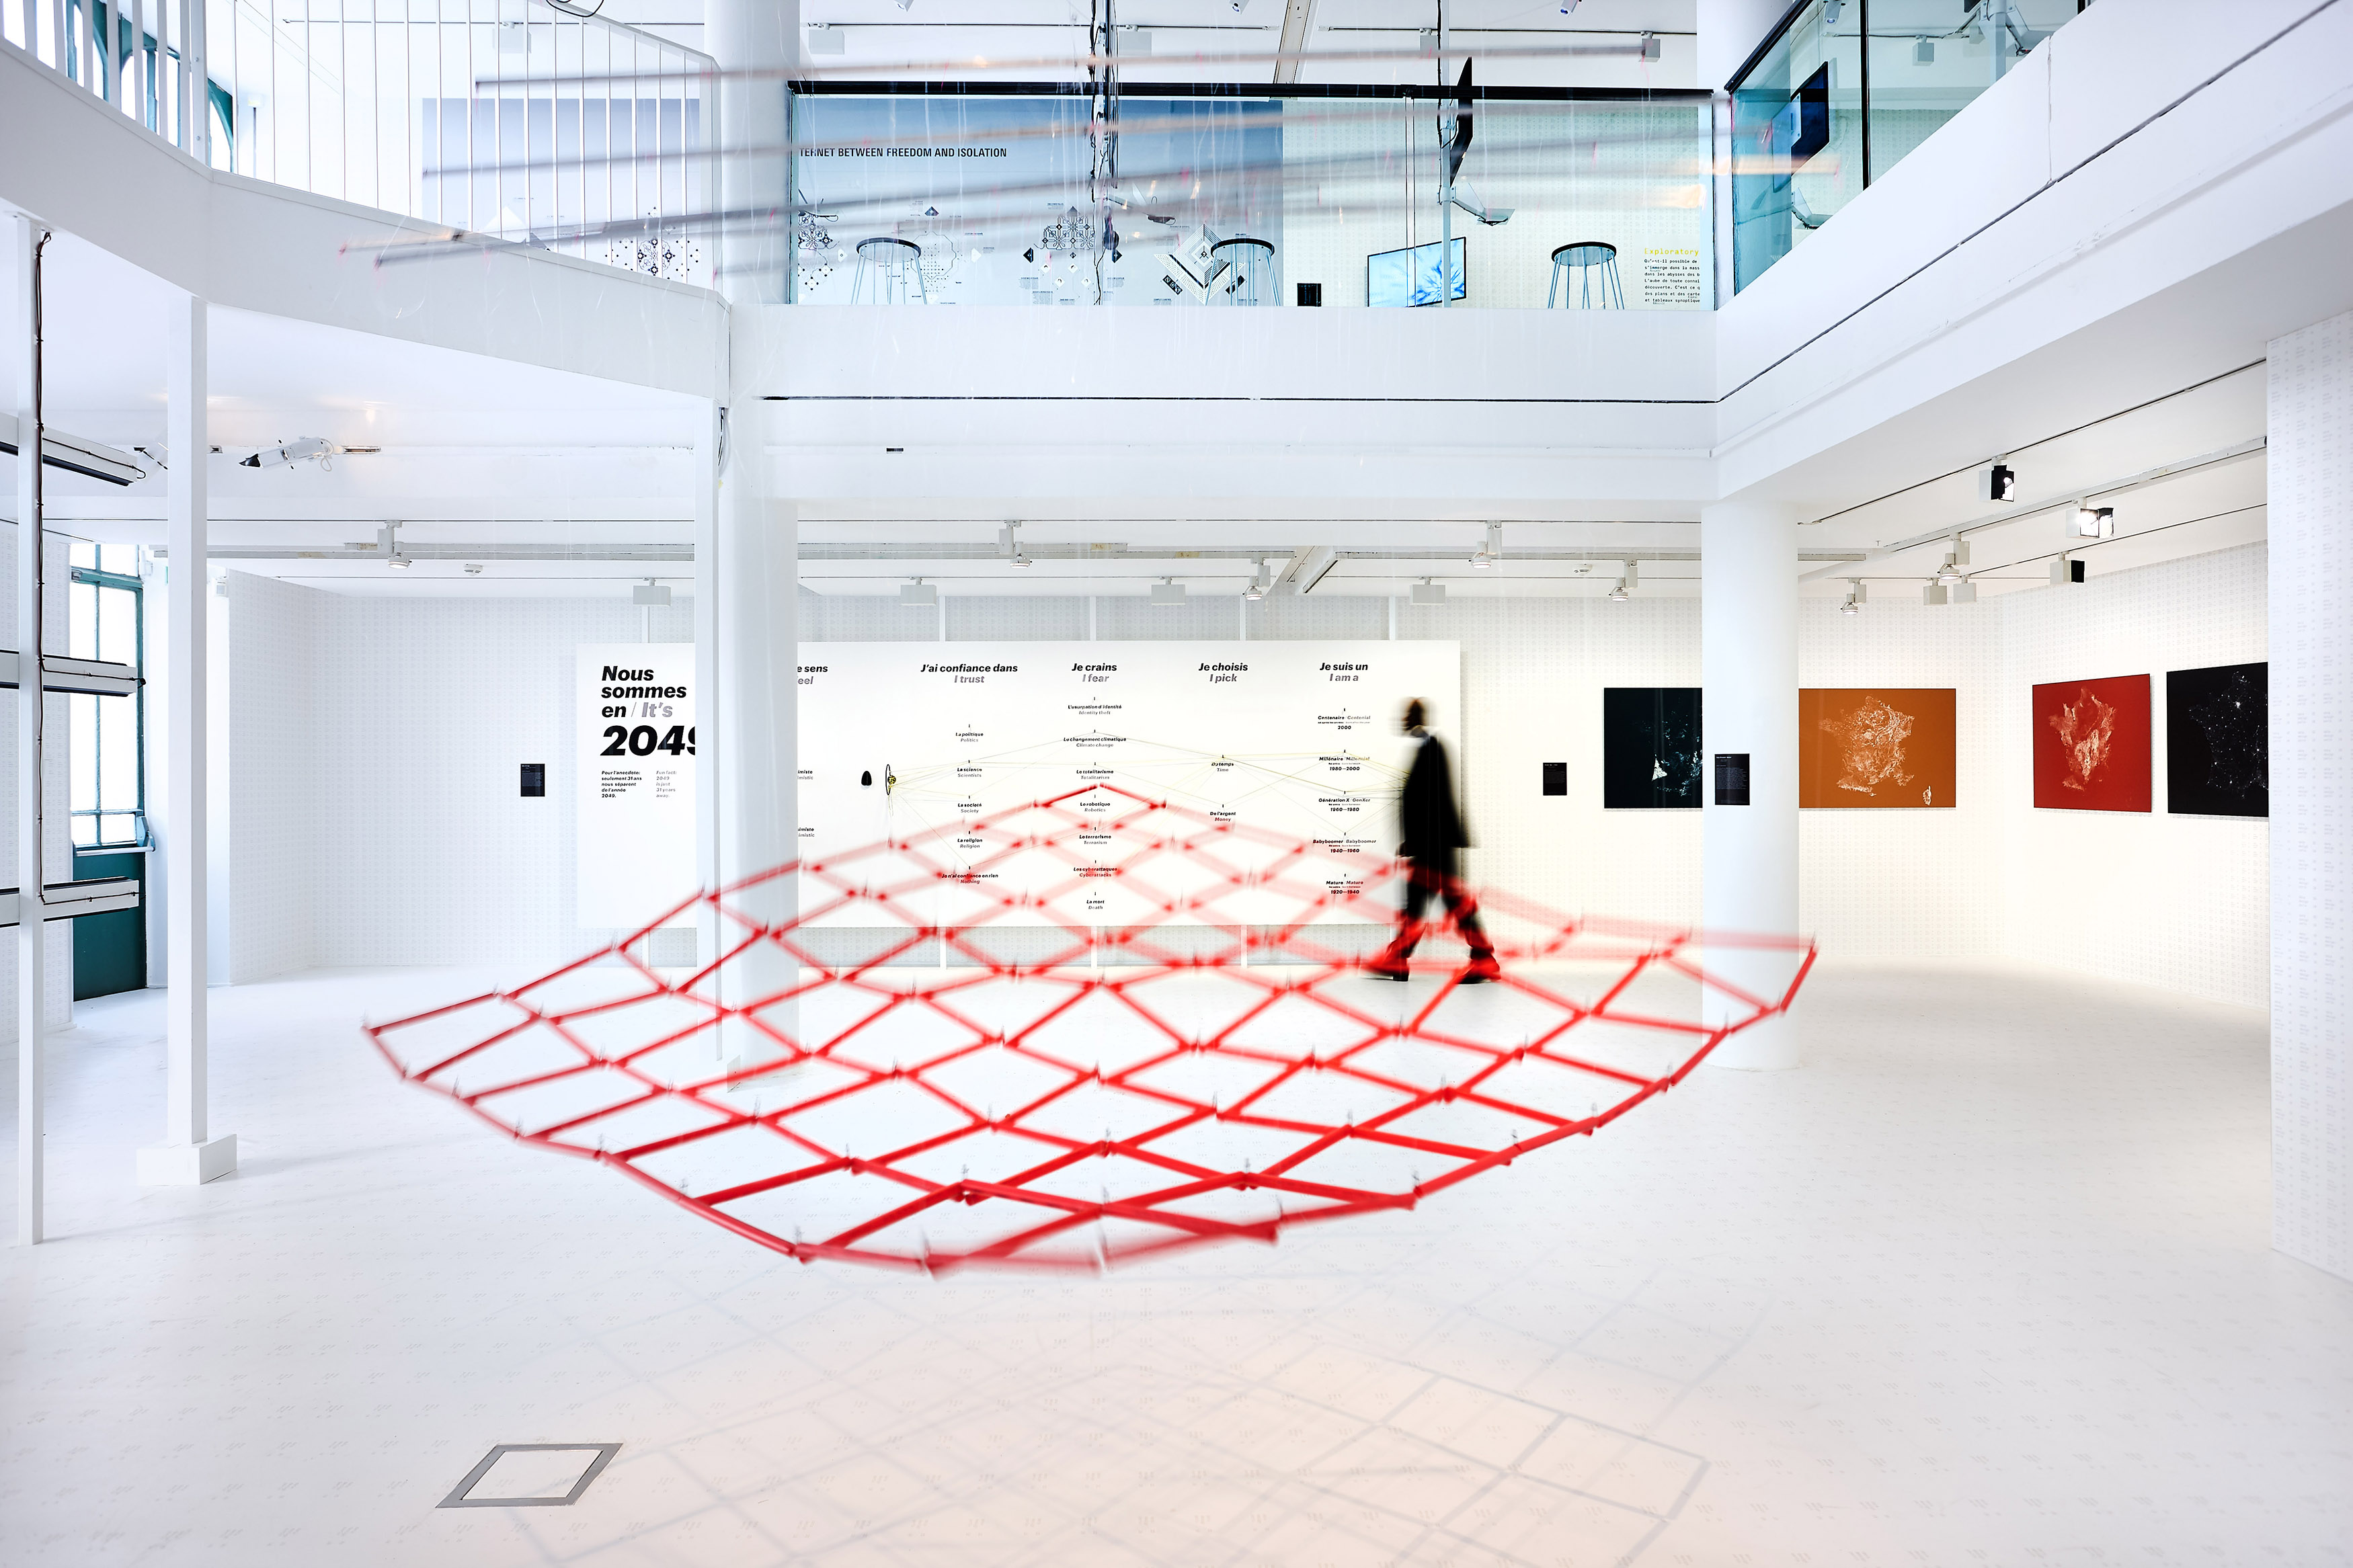
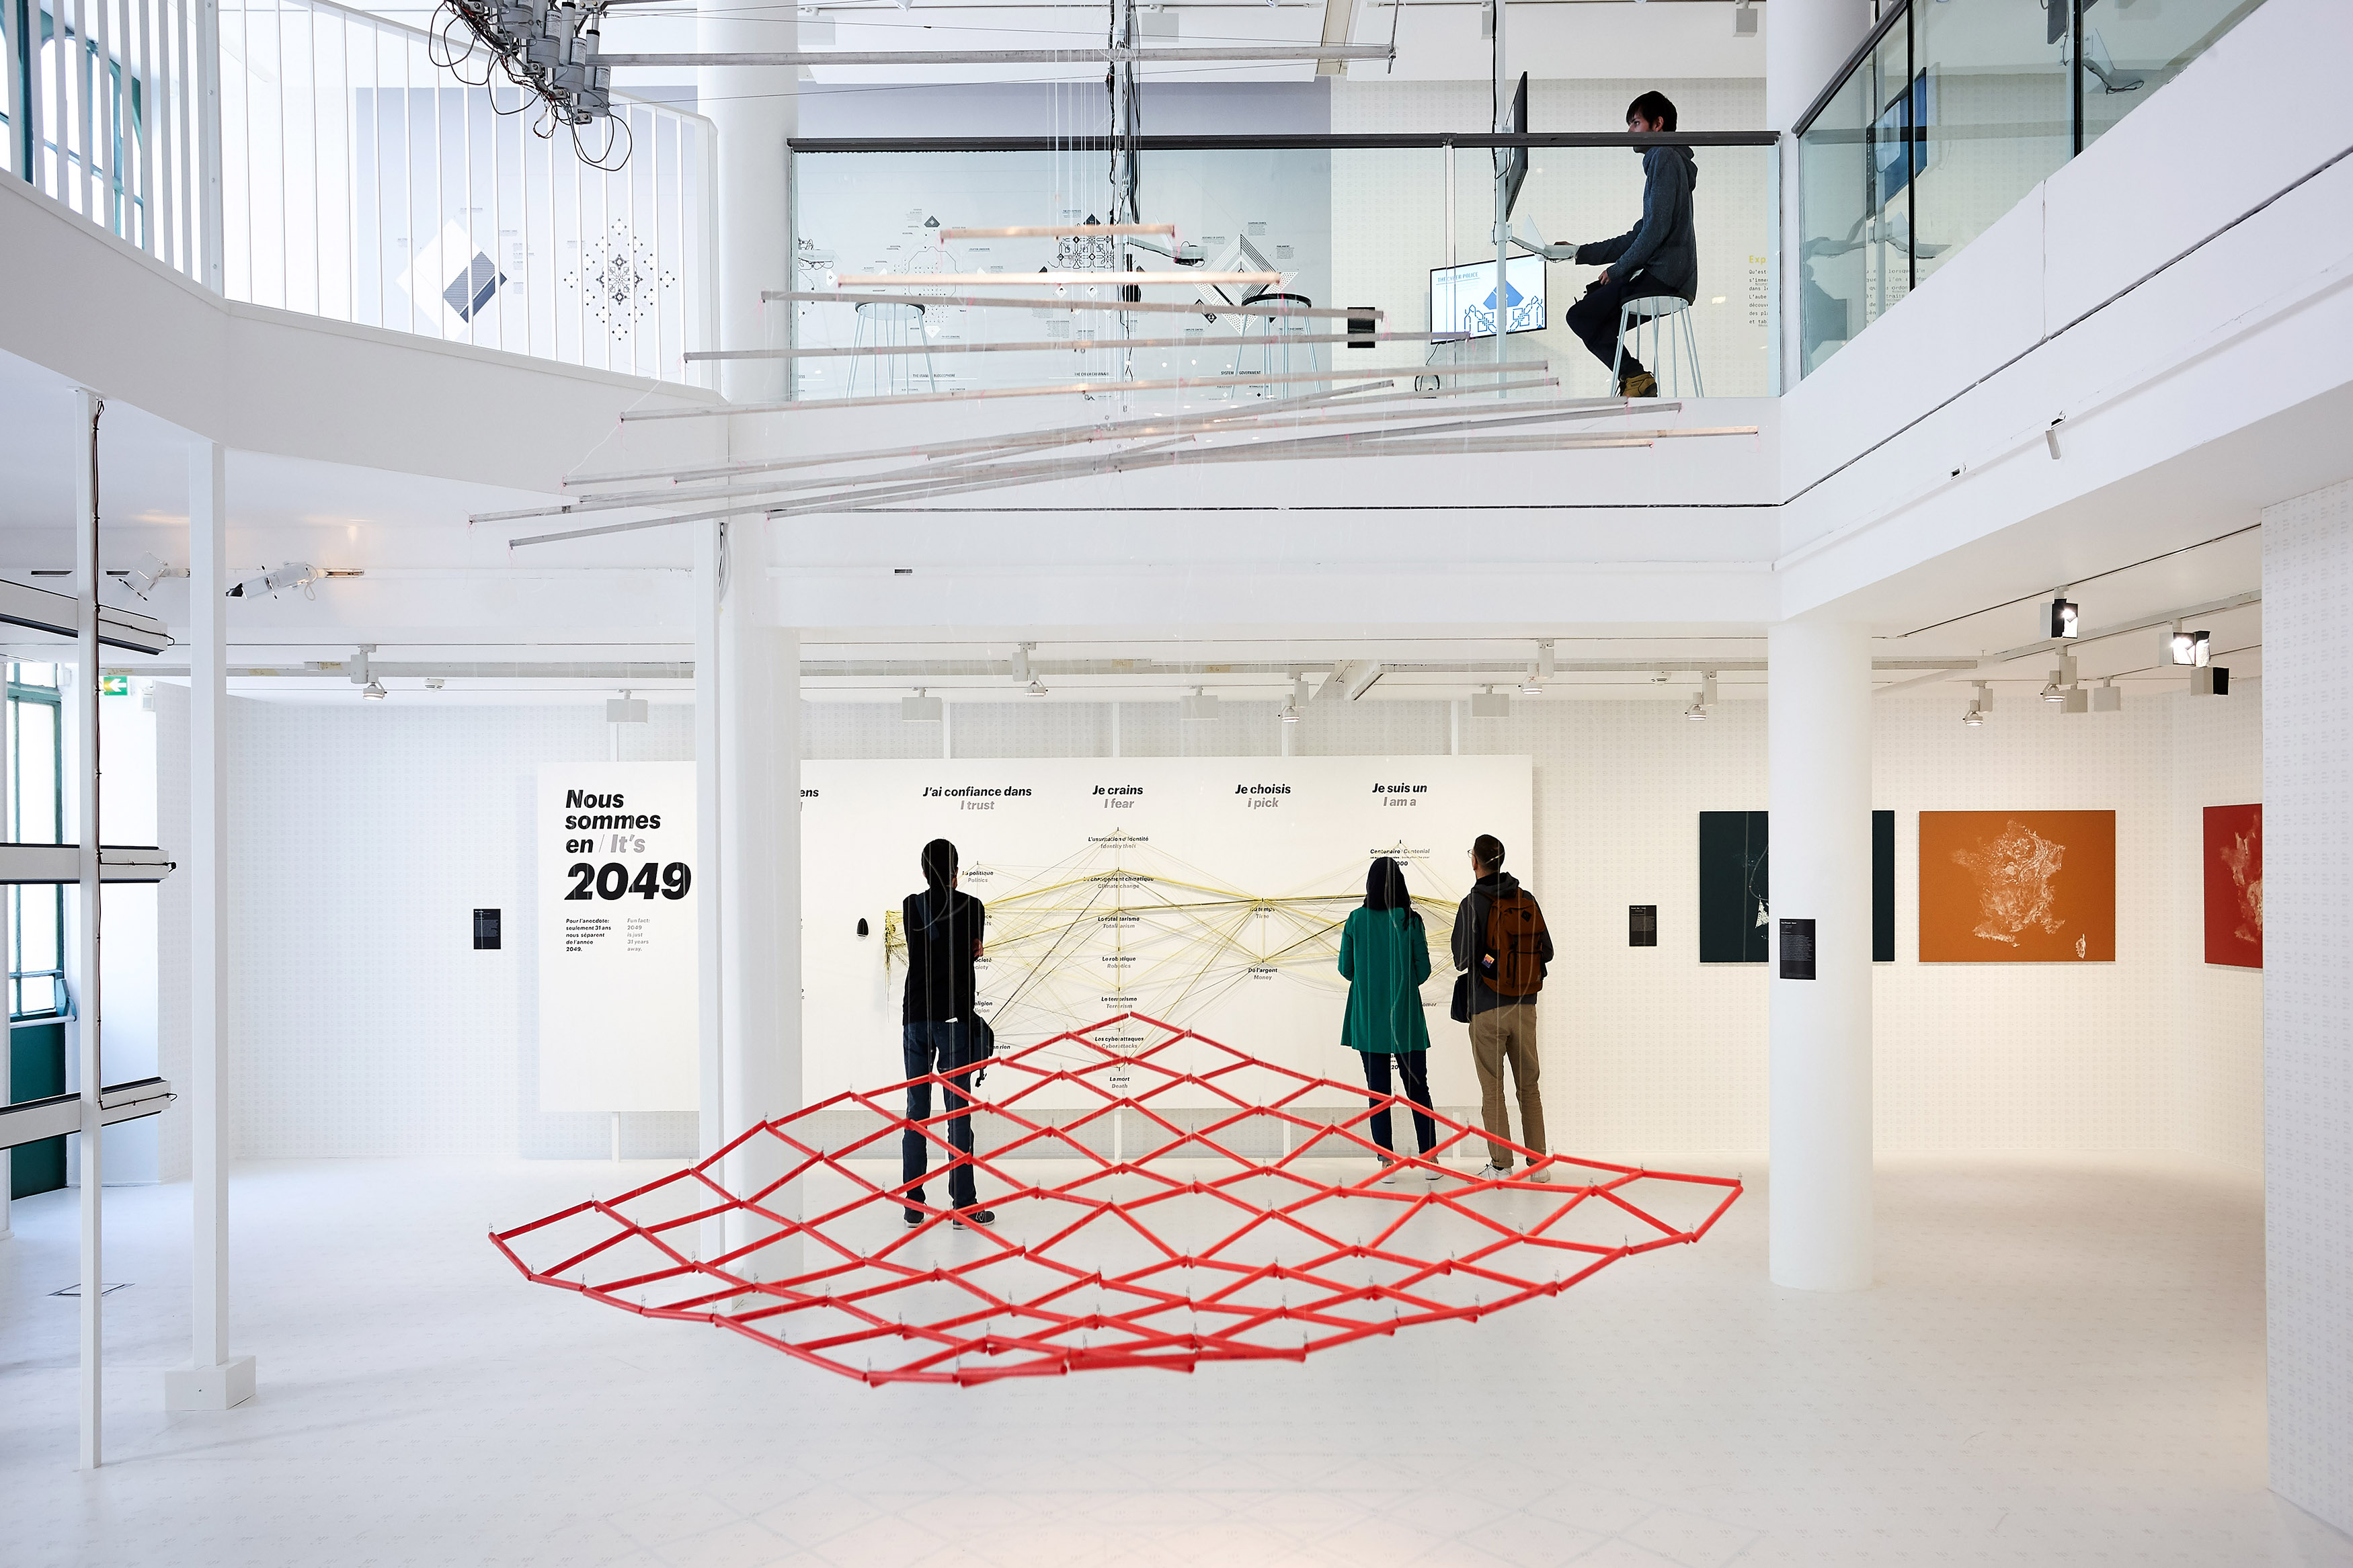
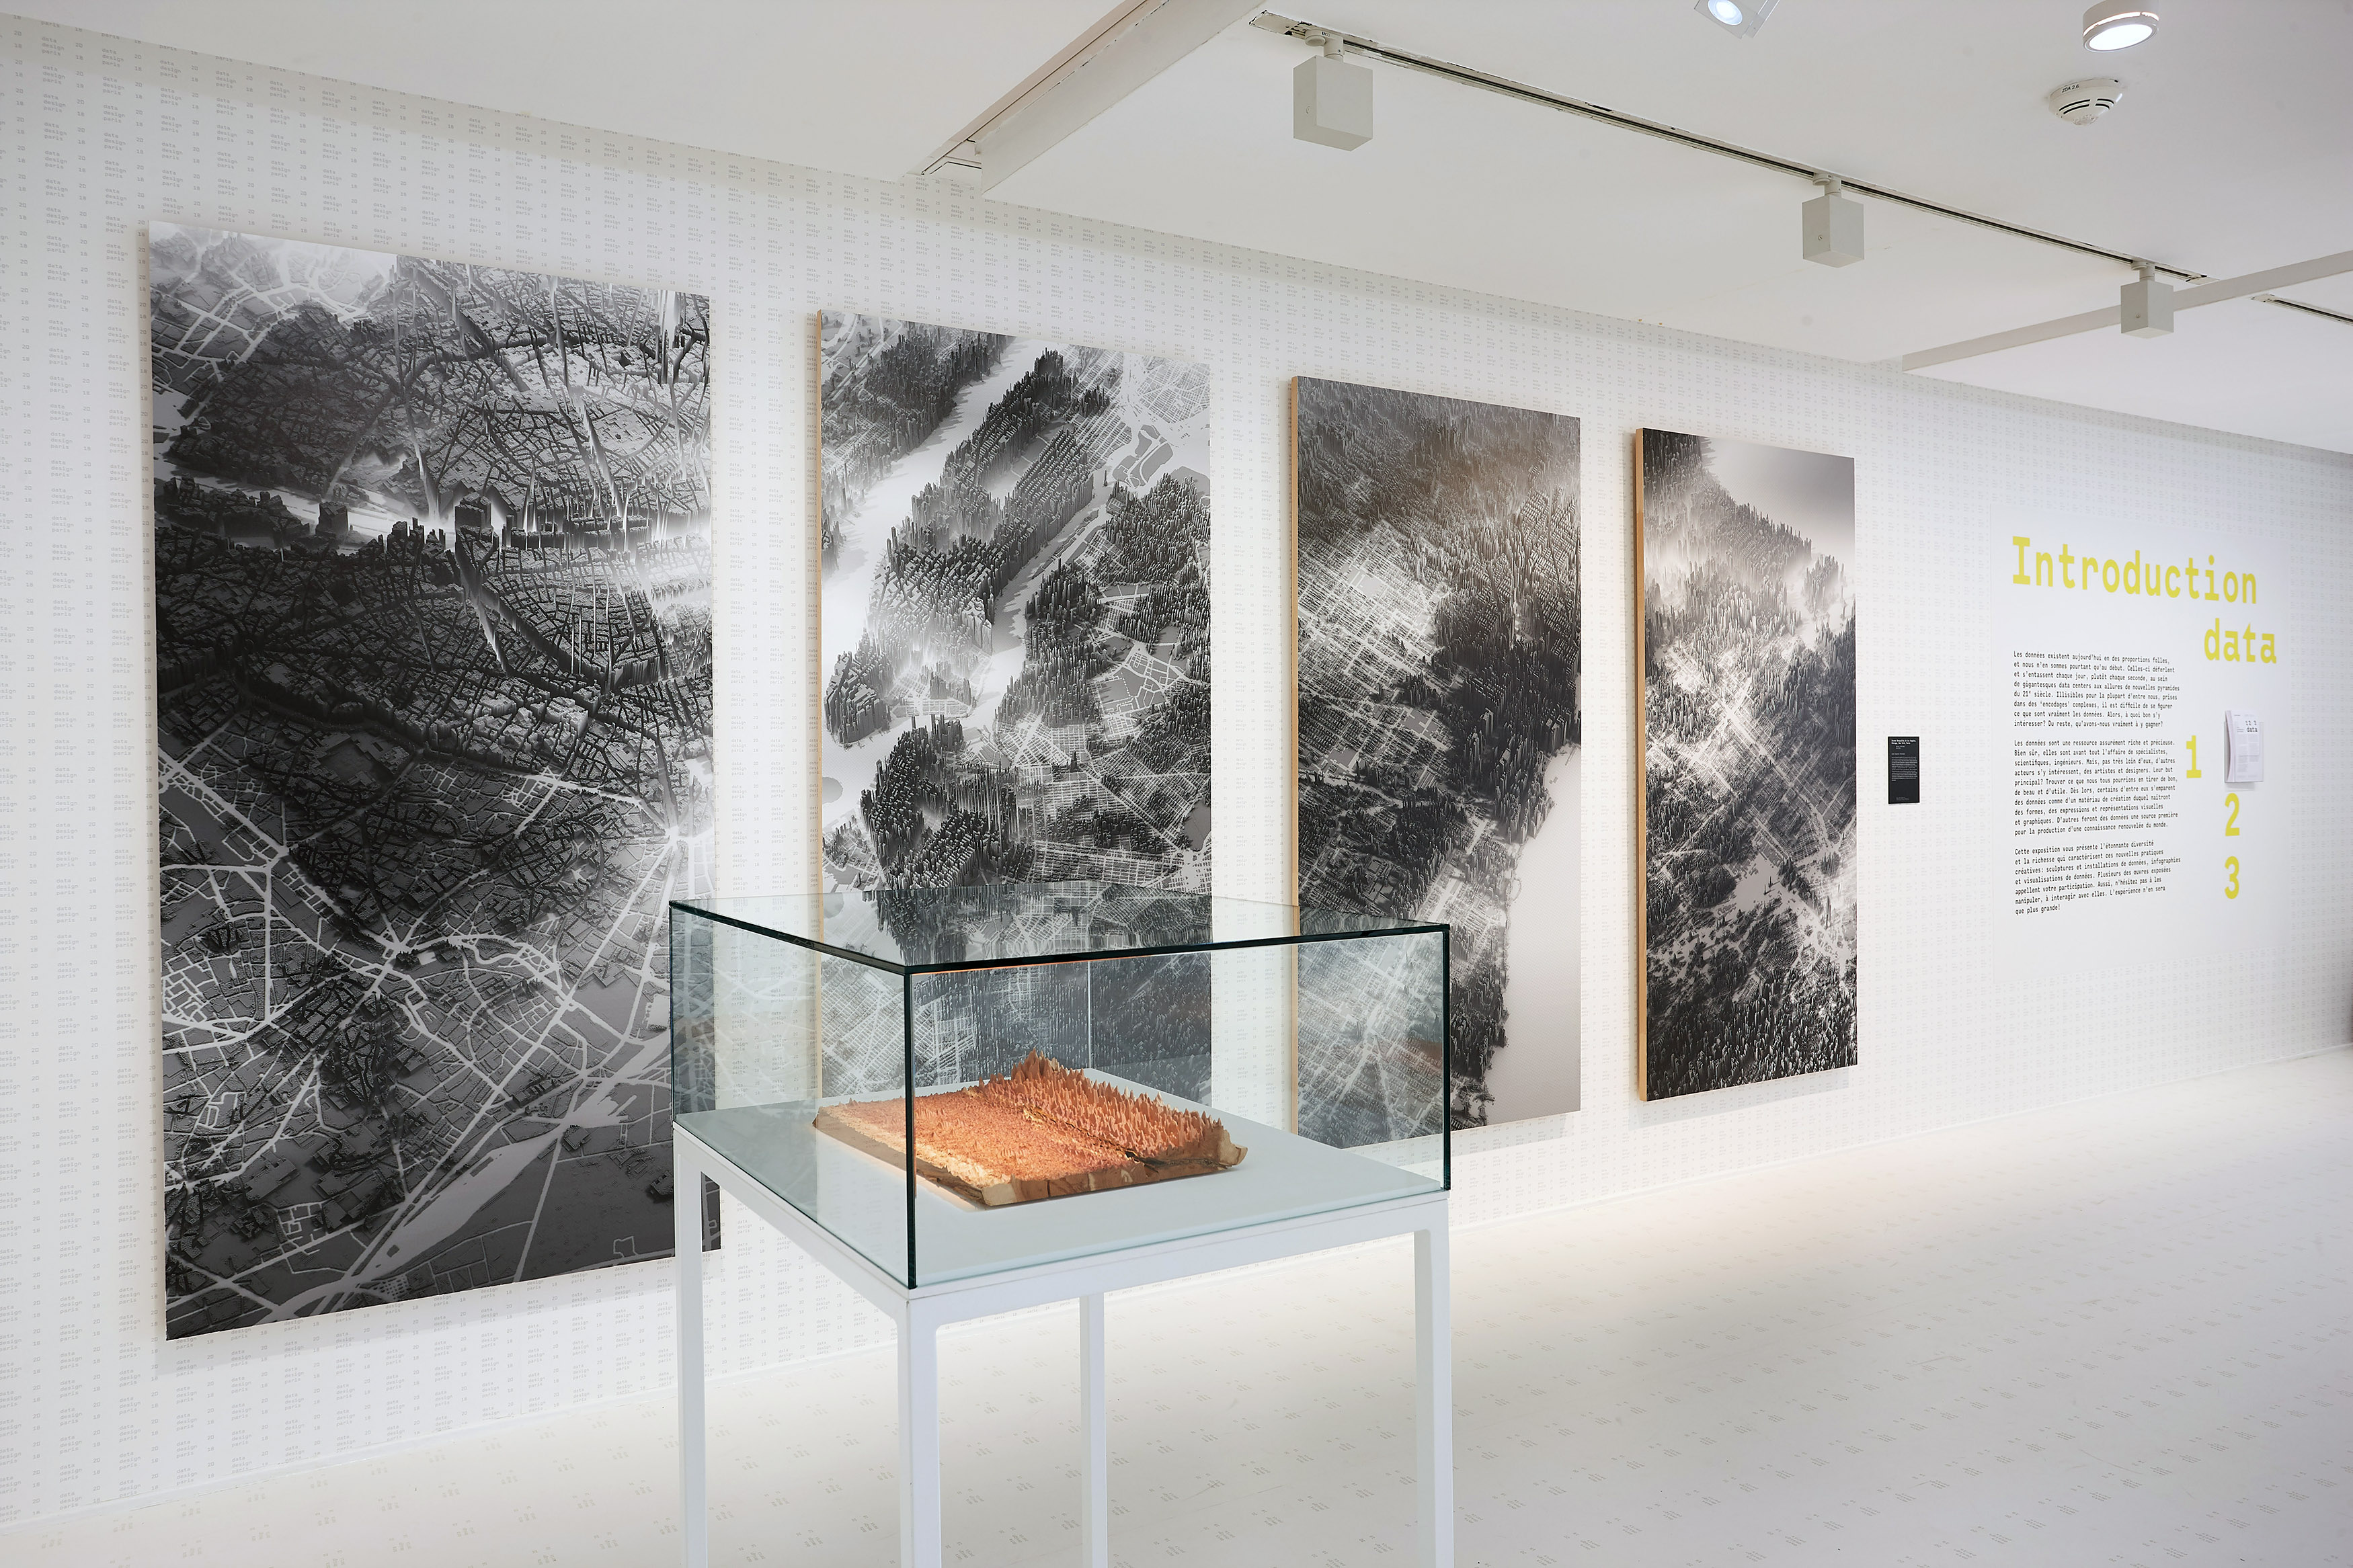
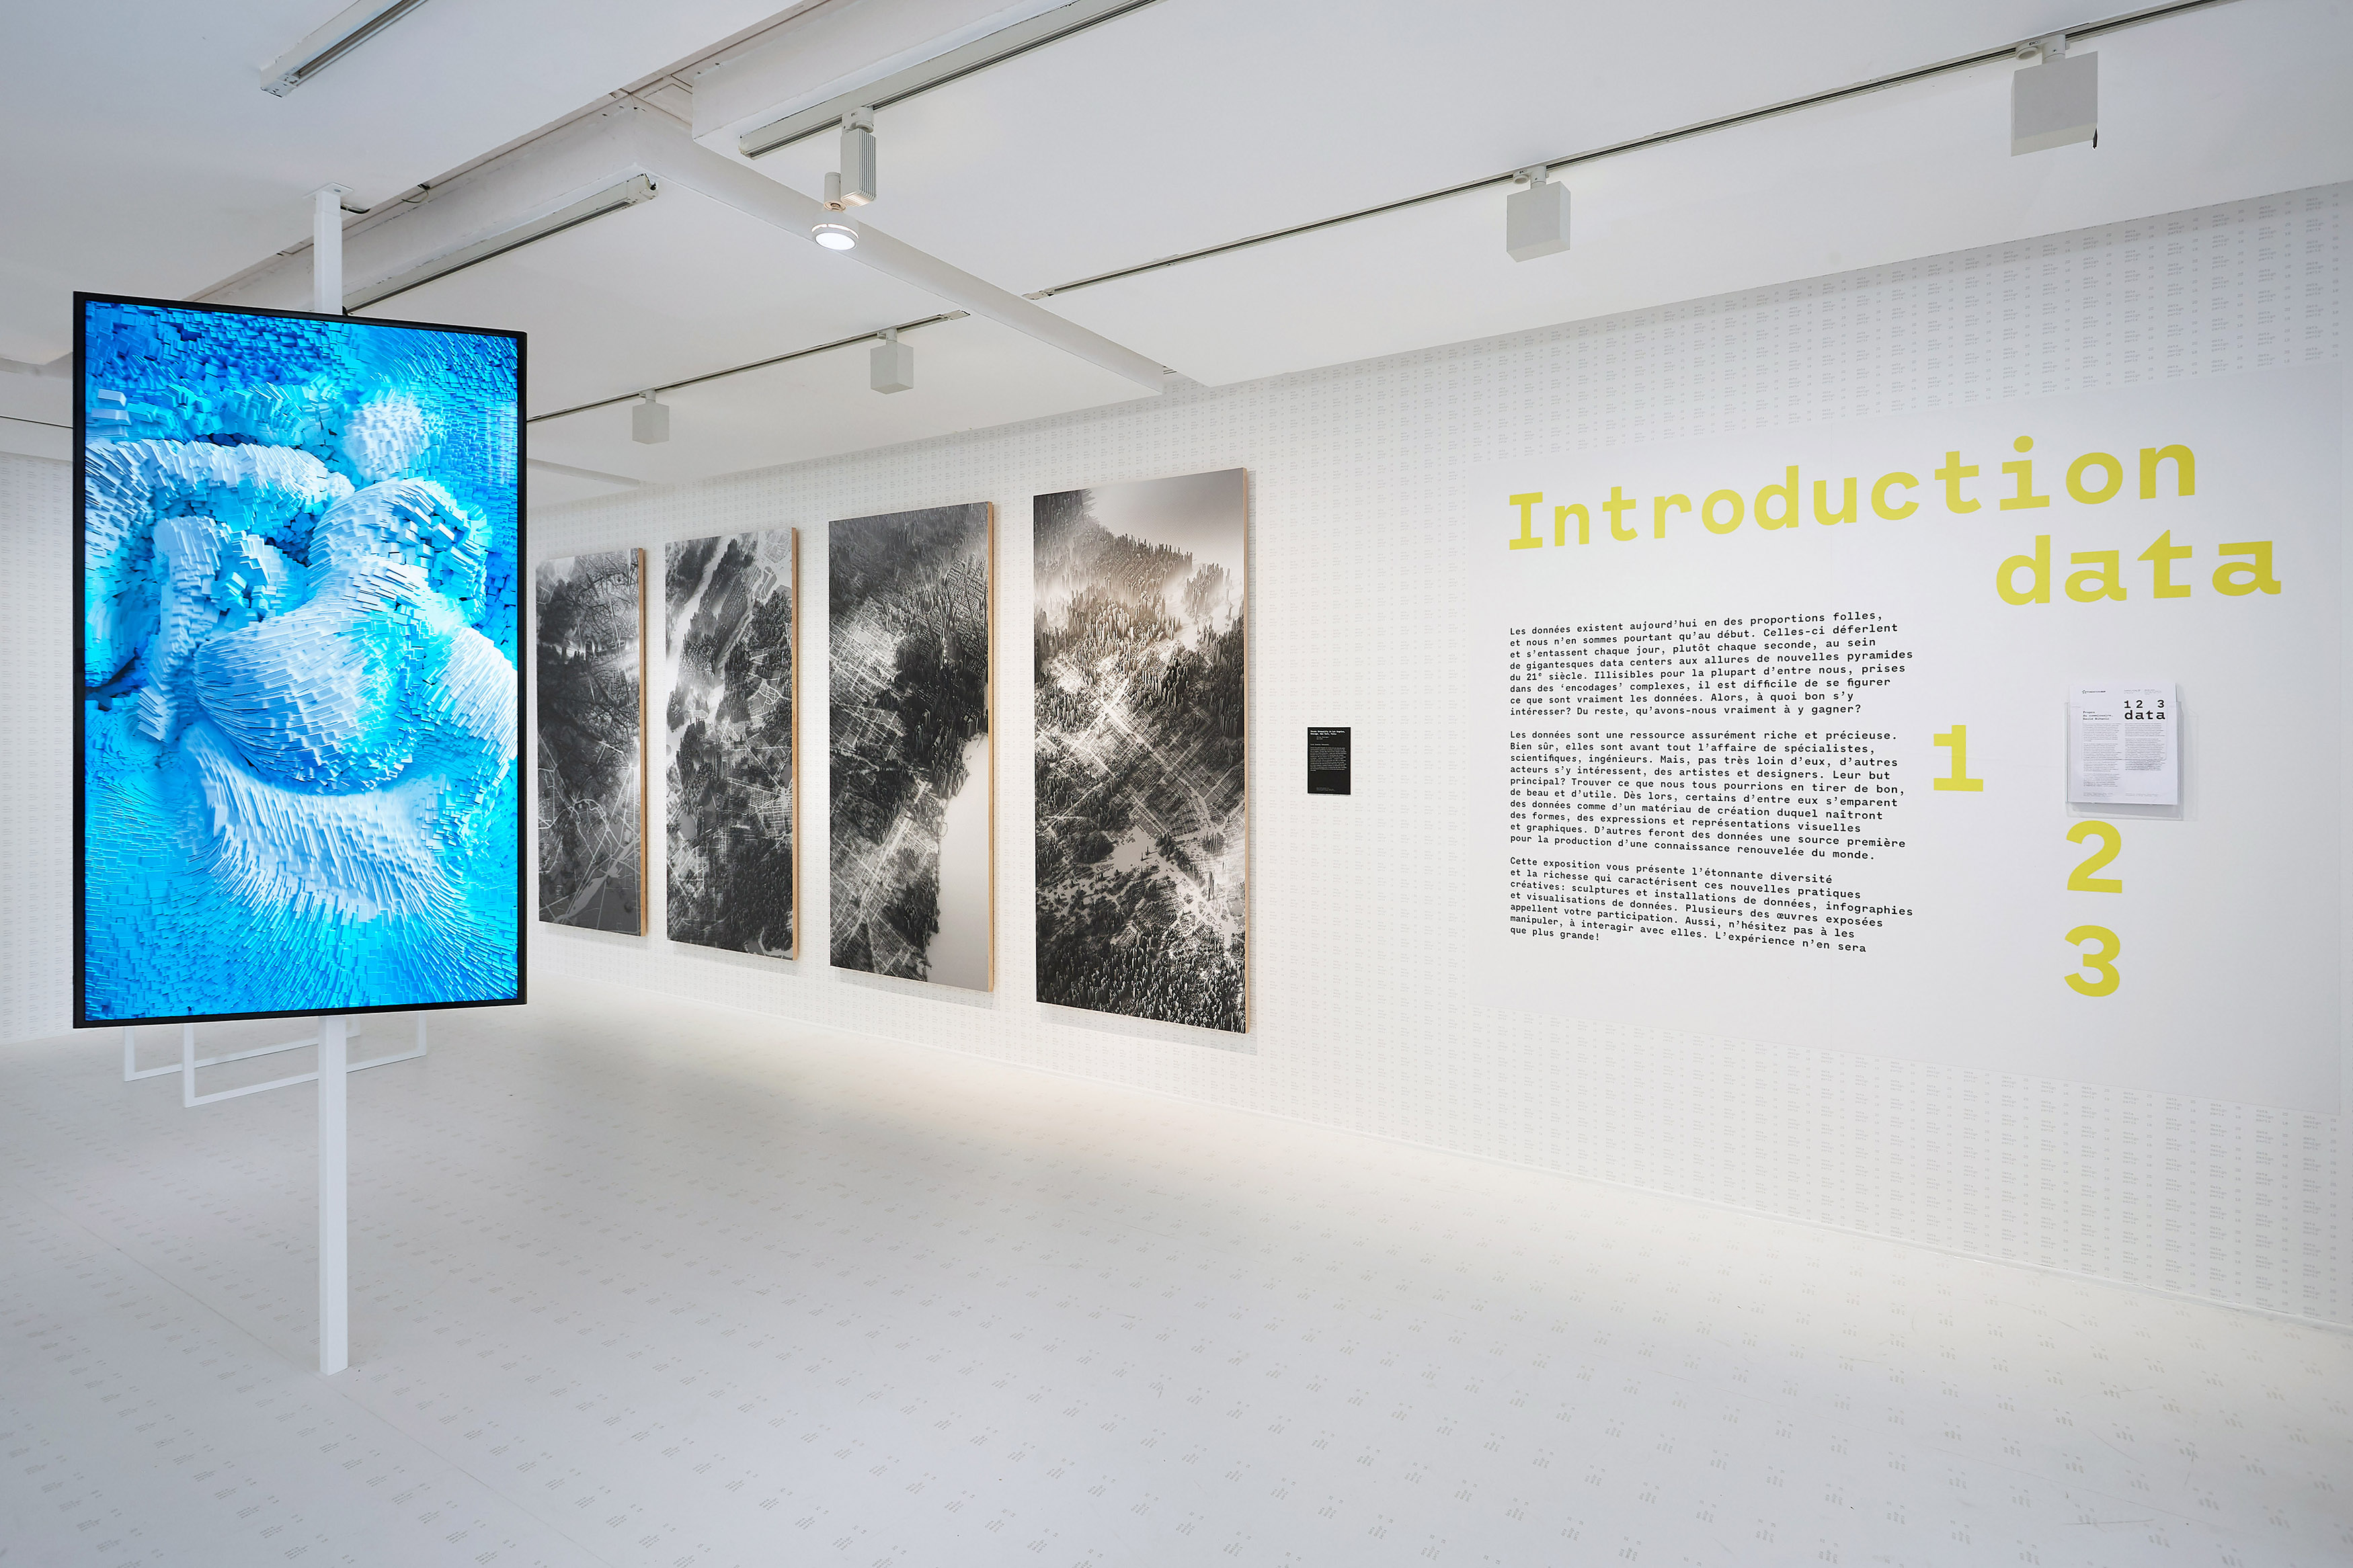
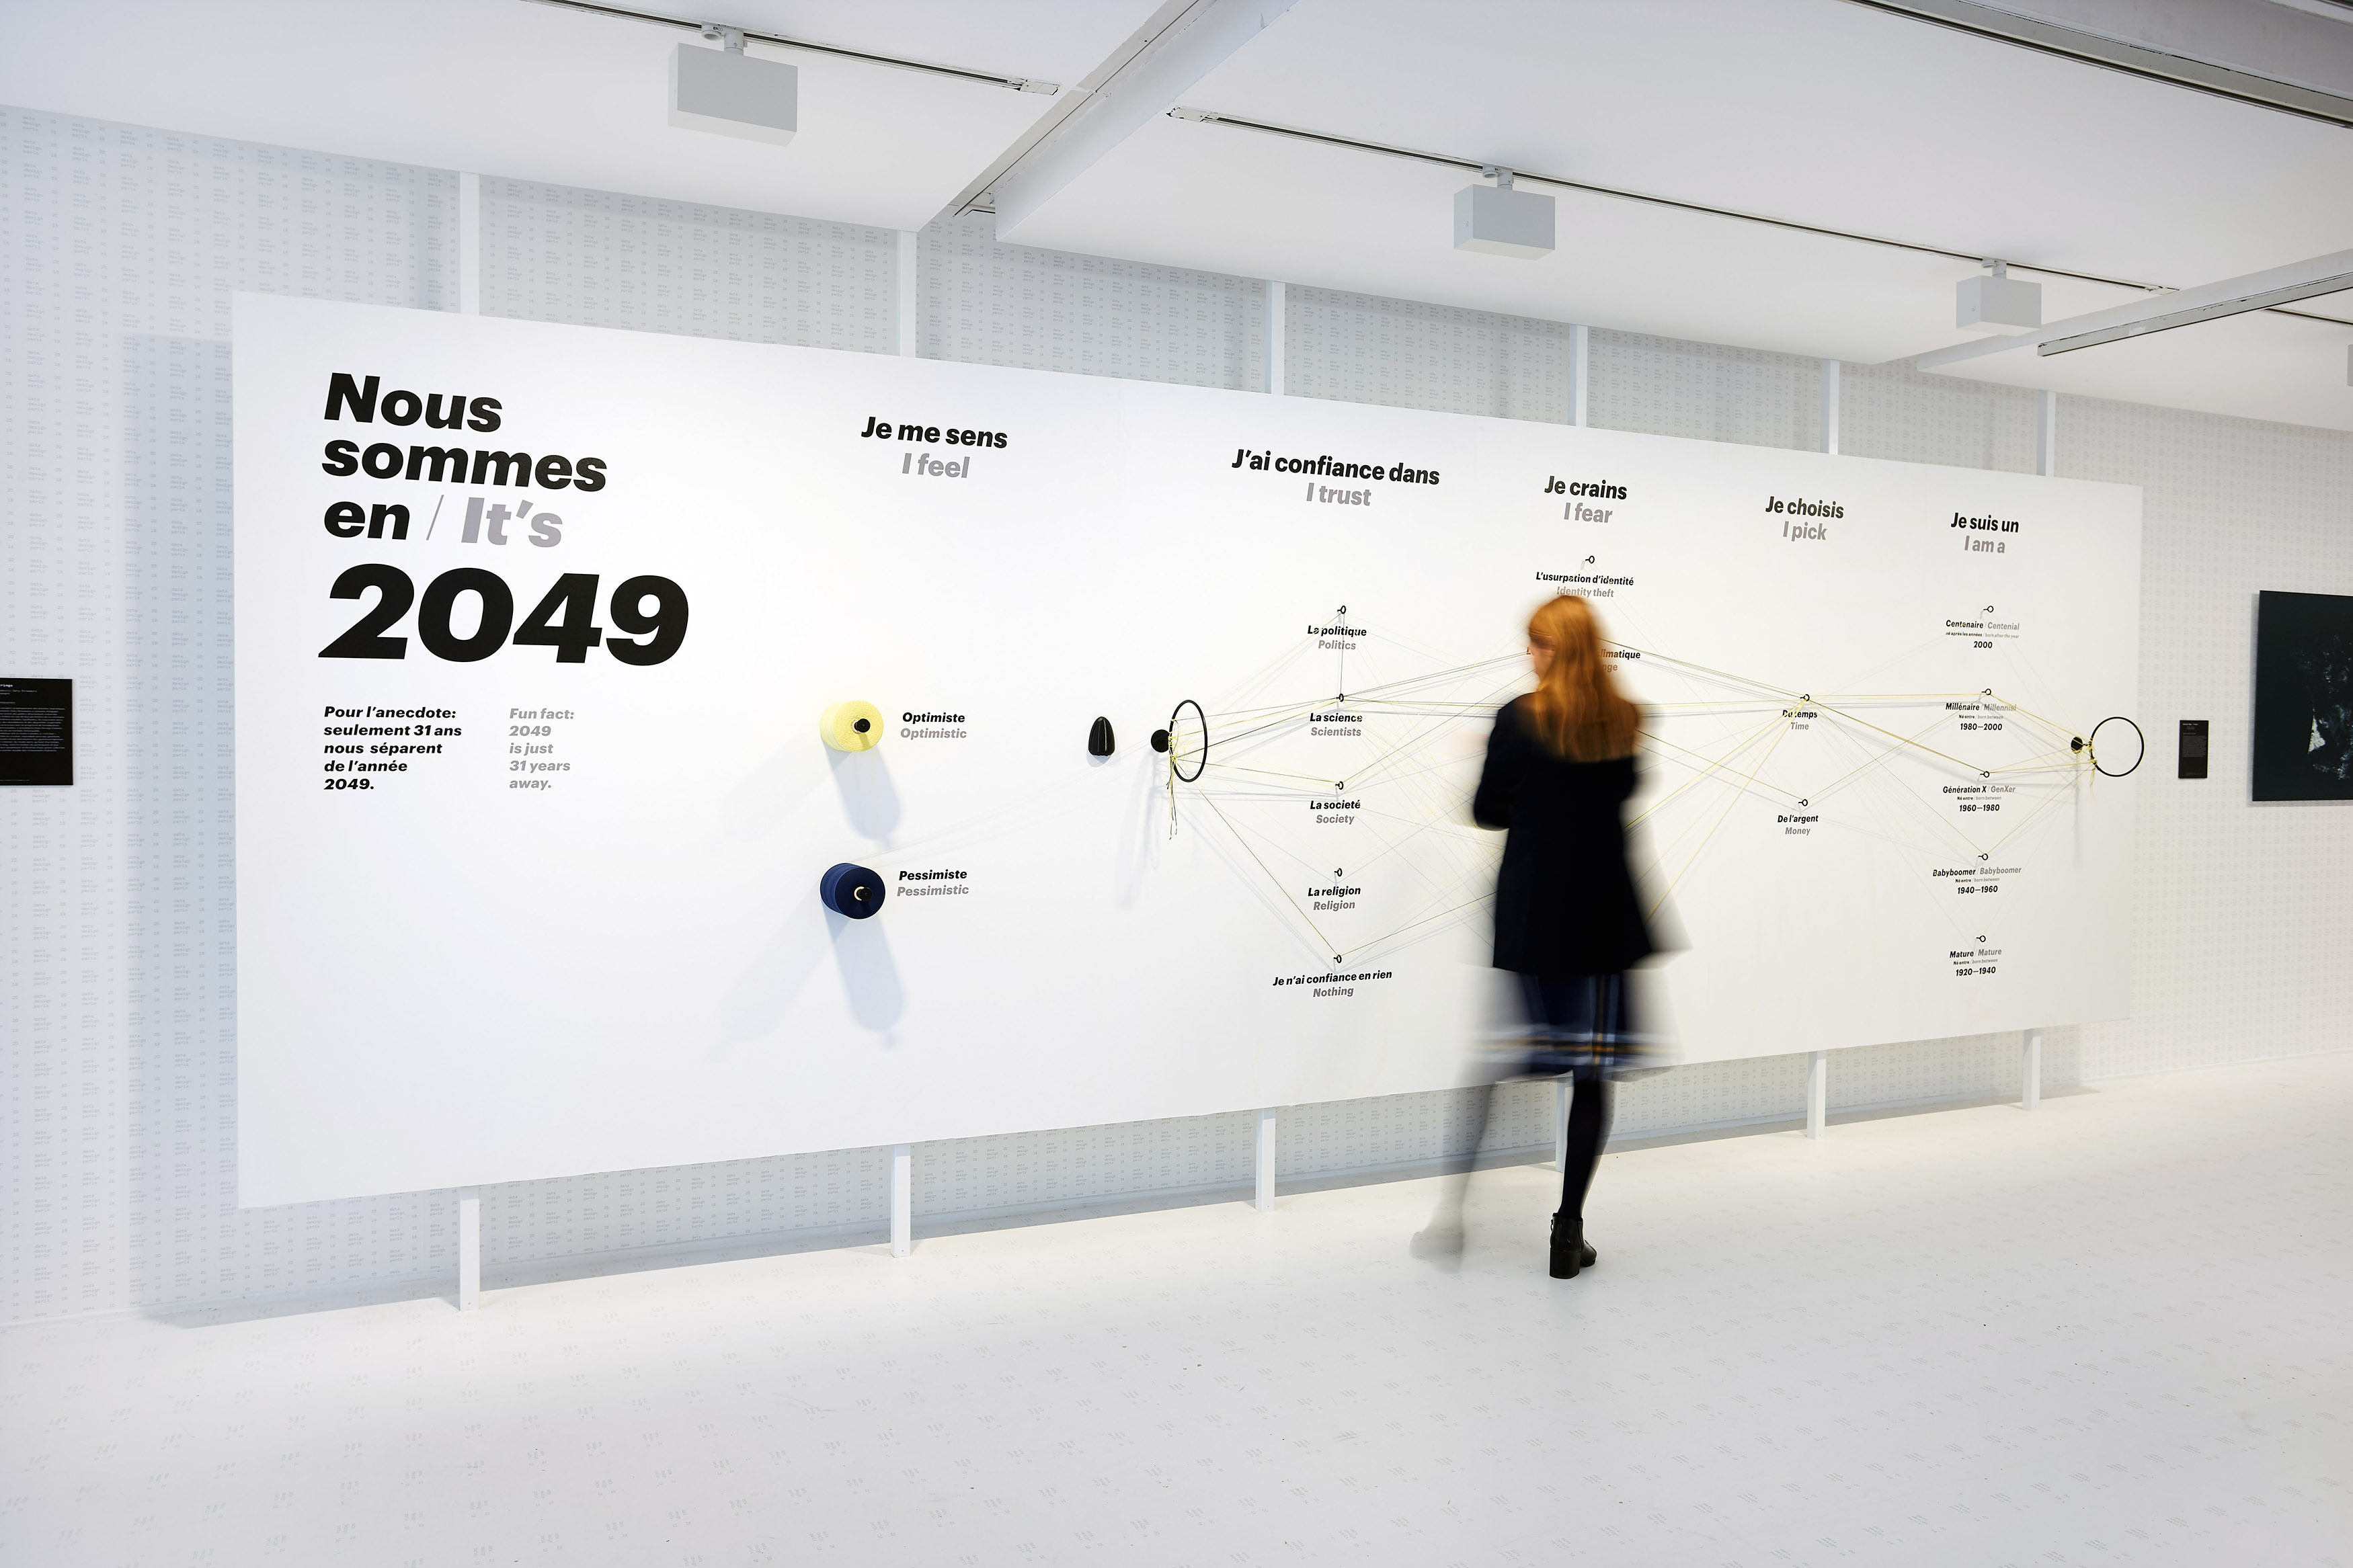
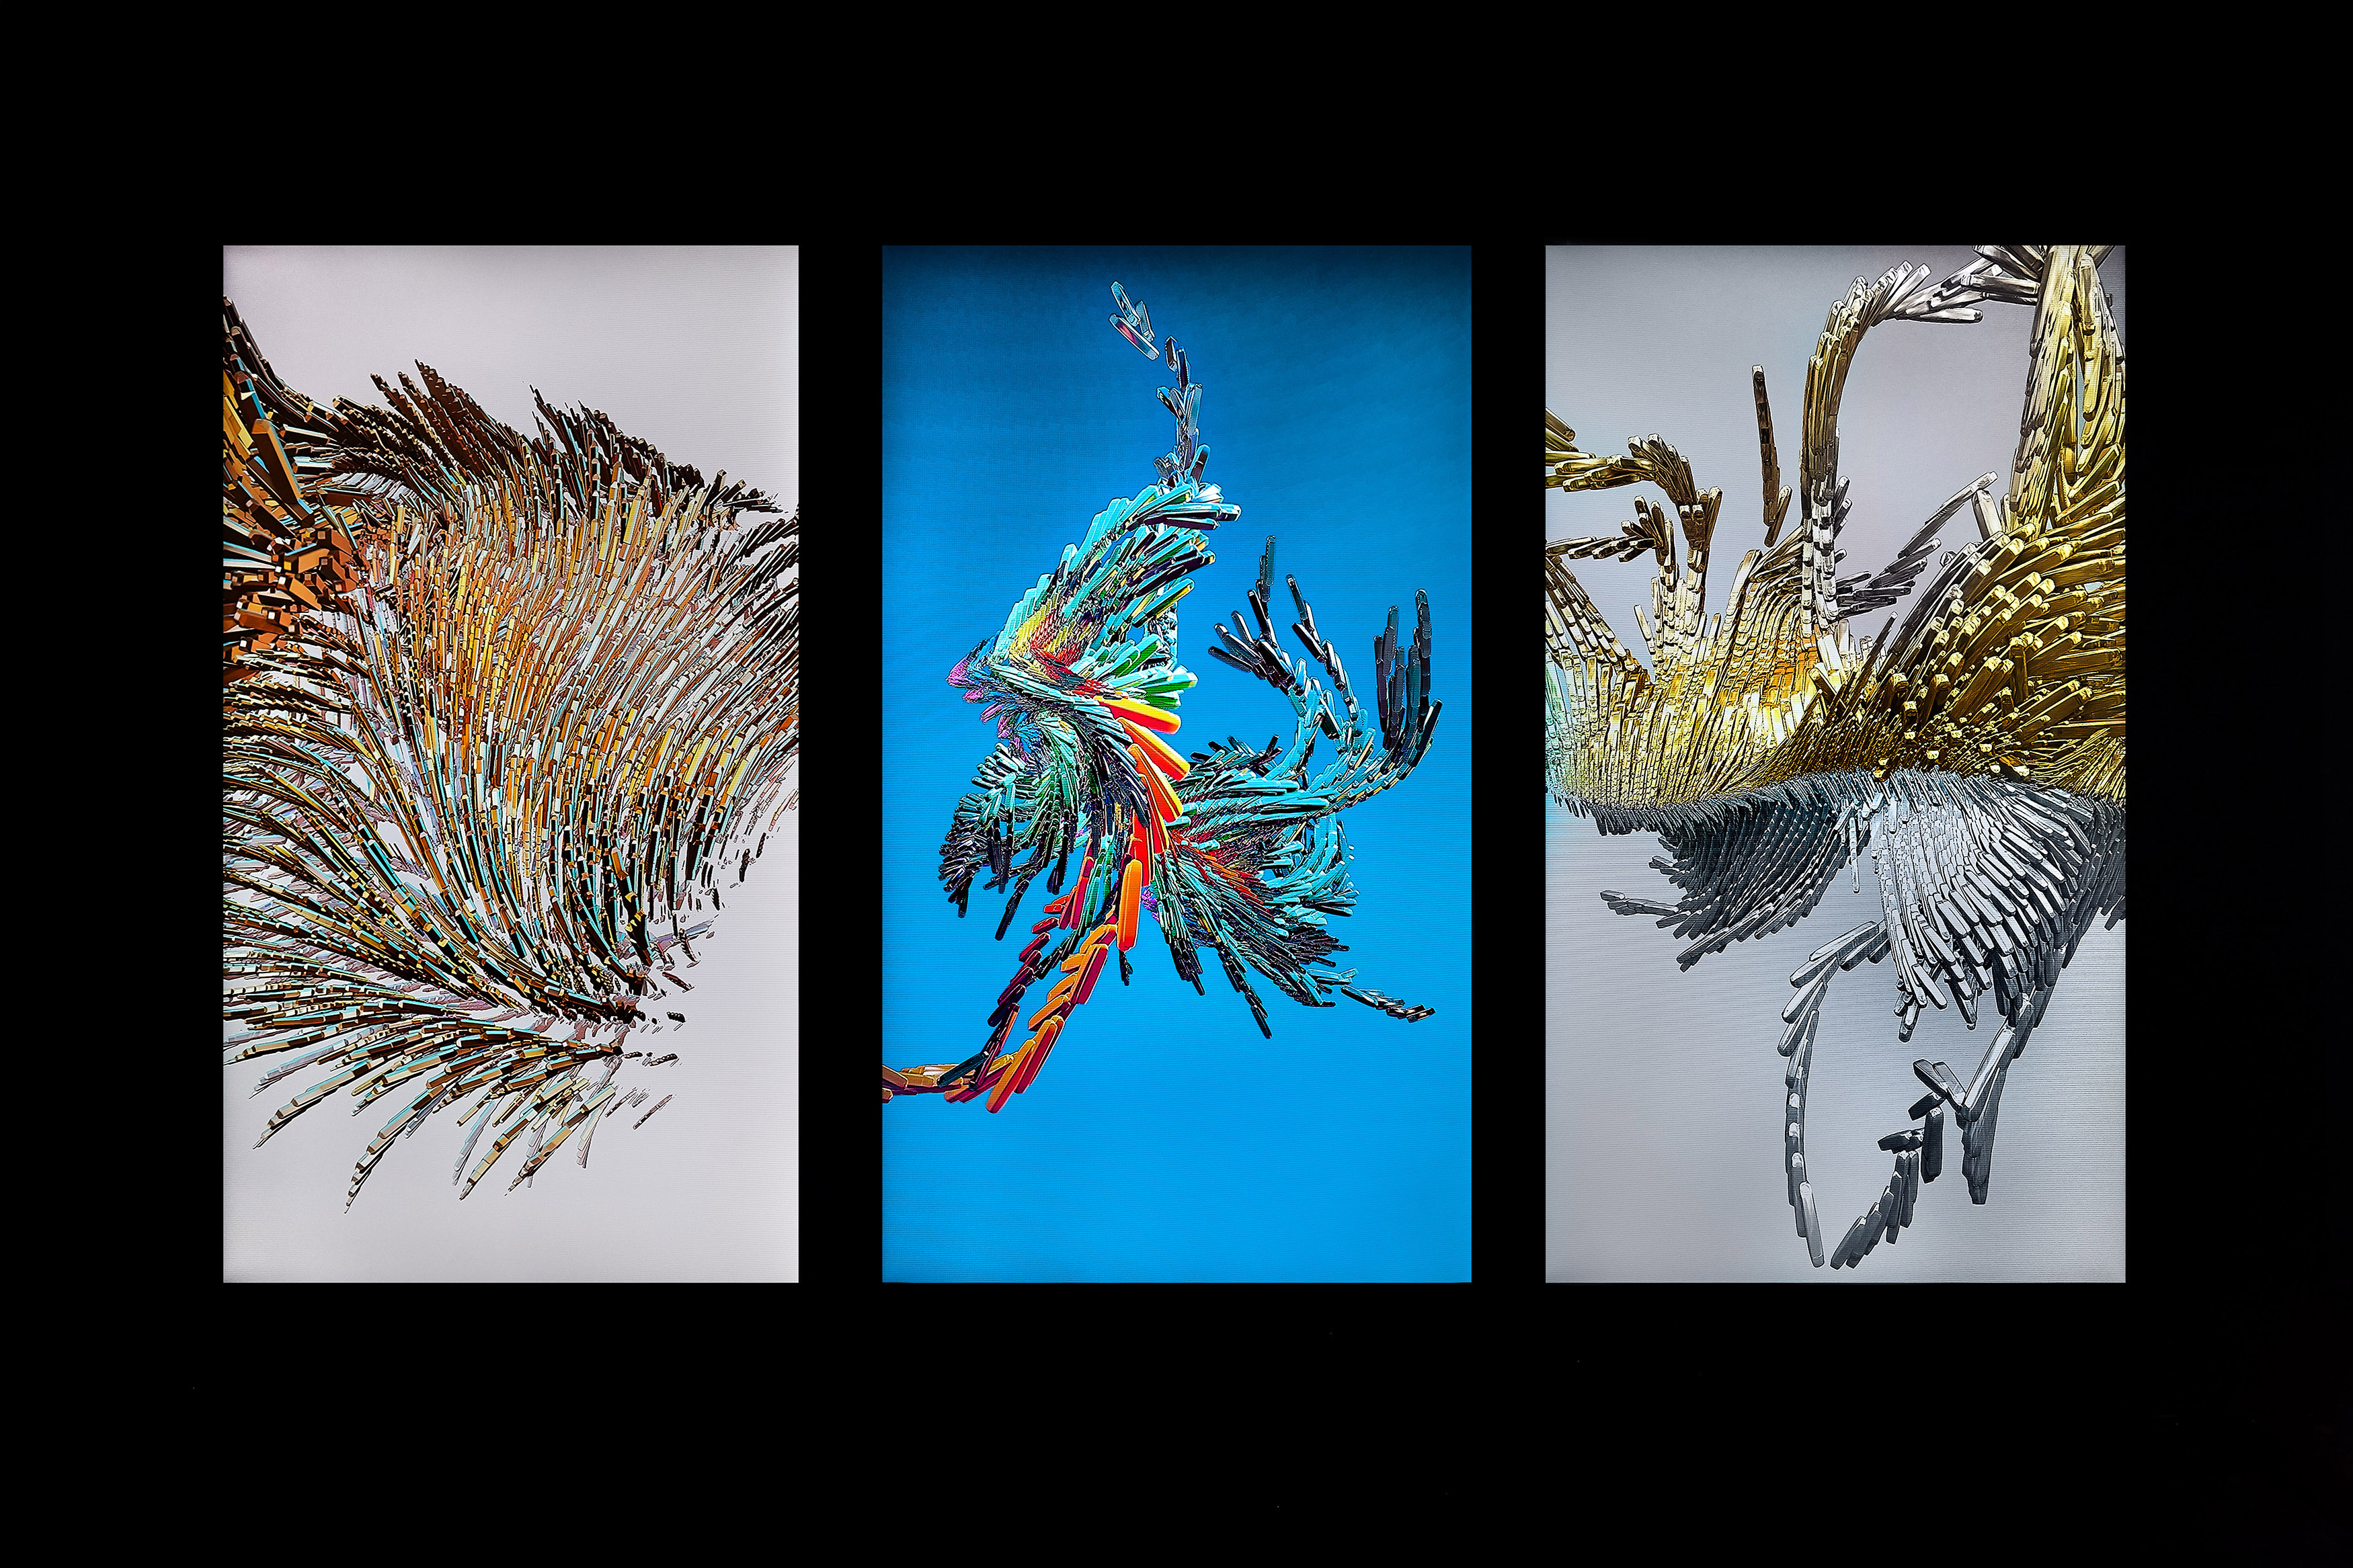
[Exhibition] “1, 2, 3 data” exhibition curating (EDF Foundation)
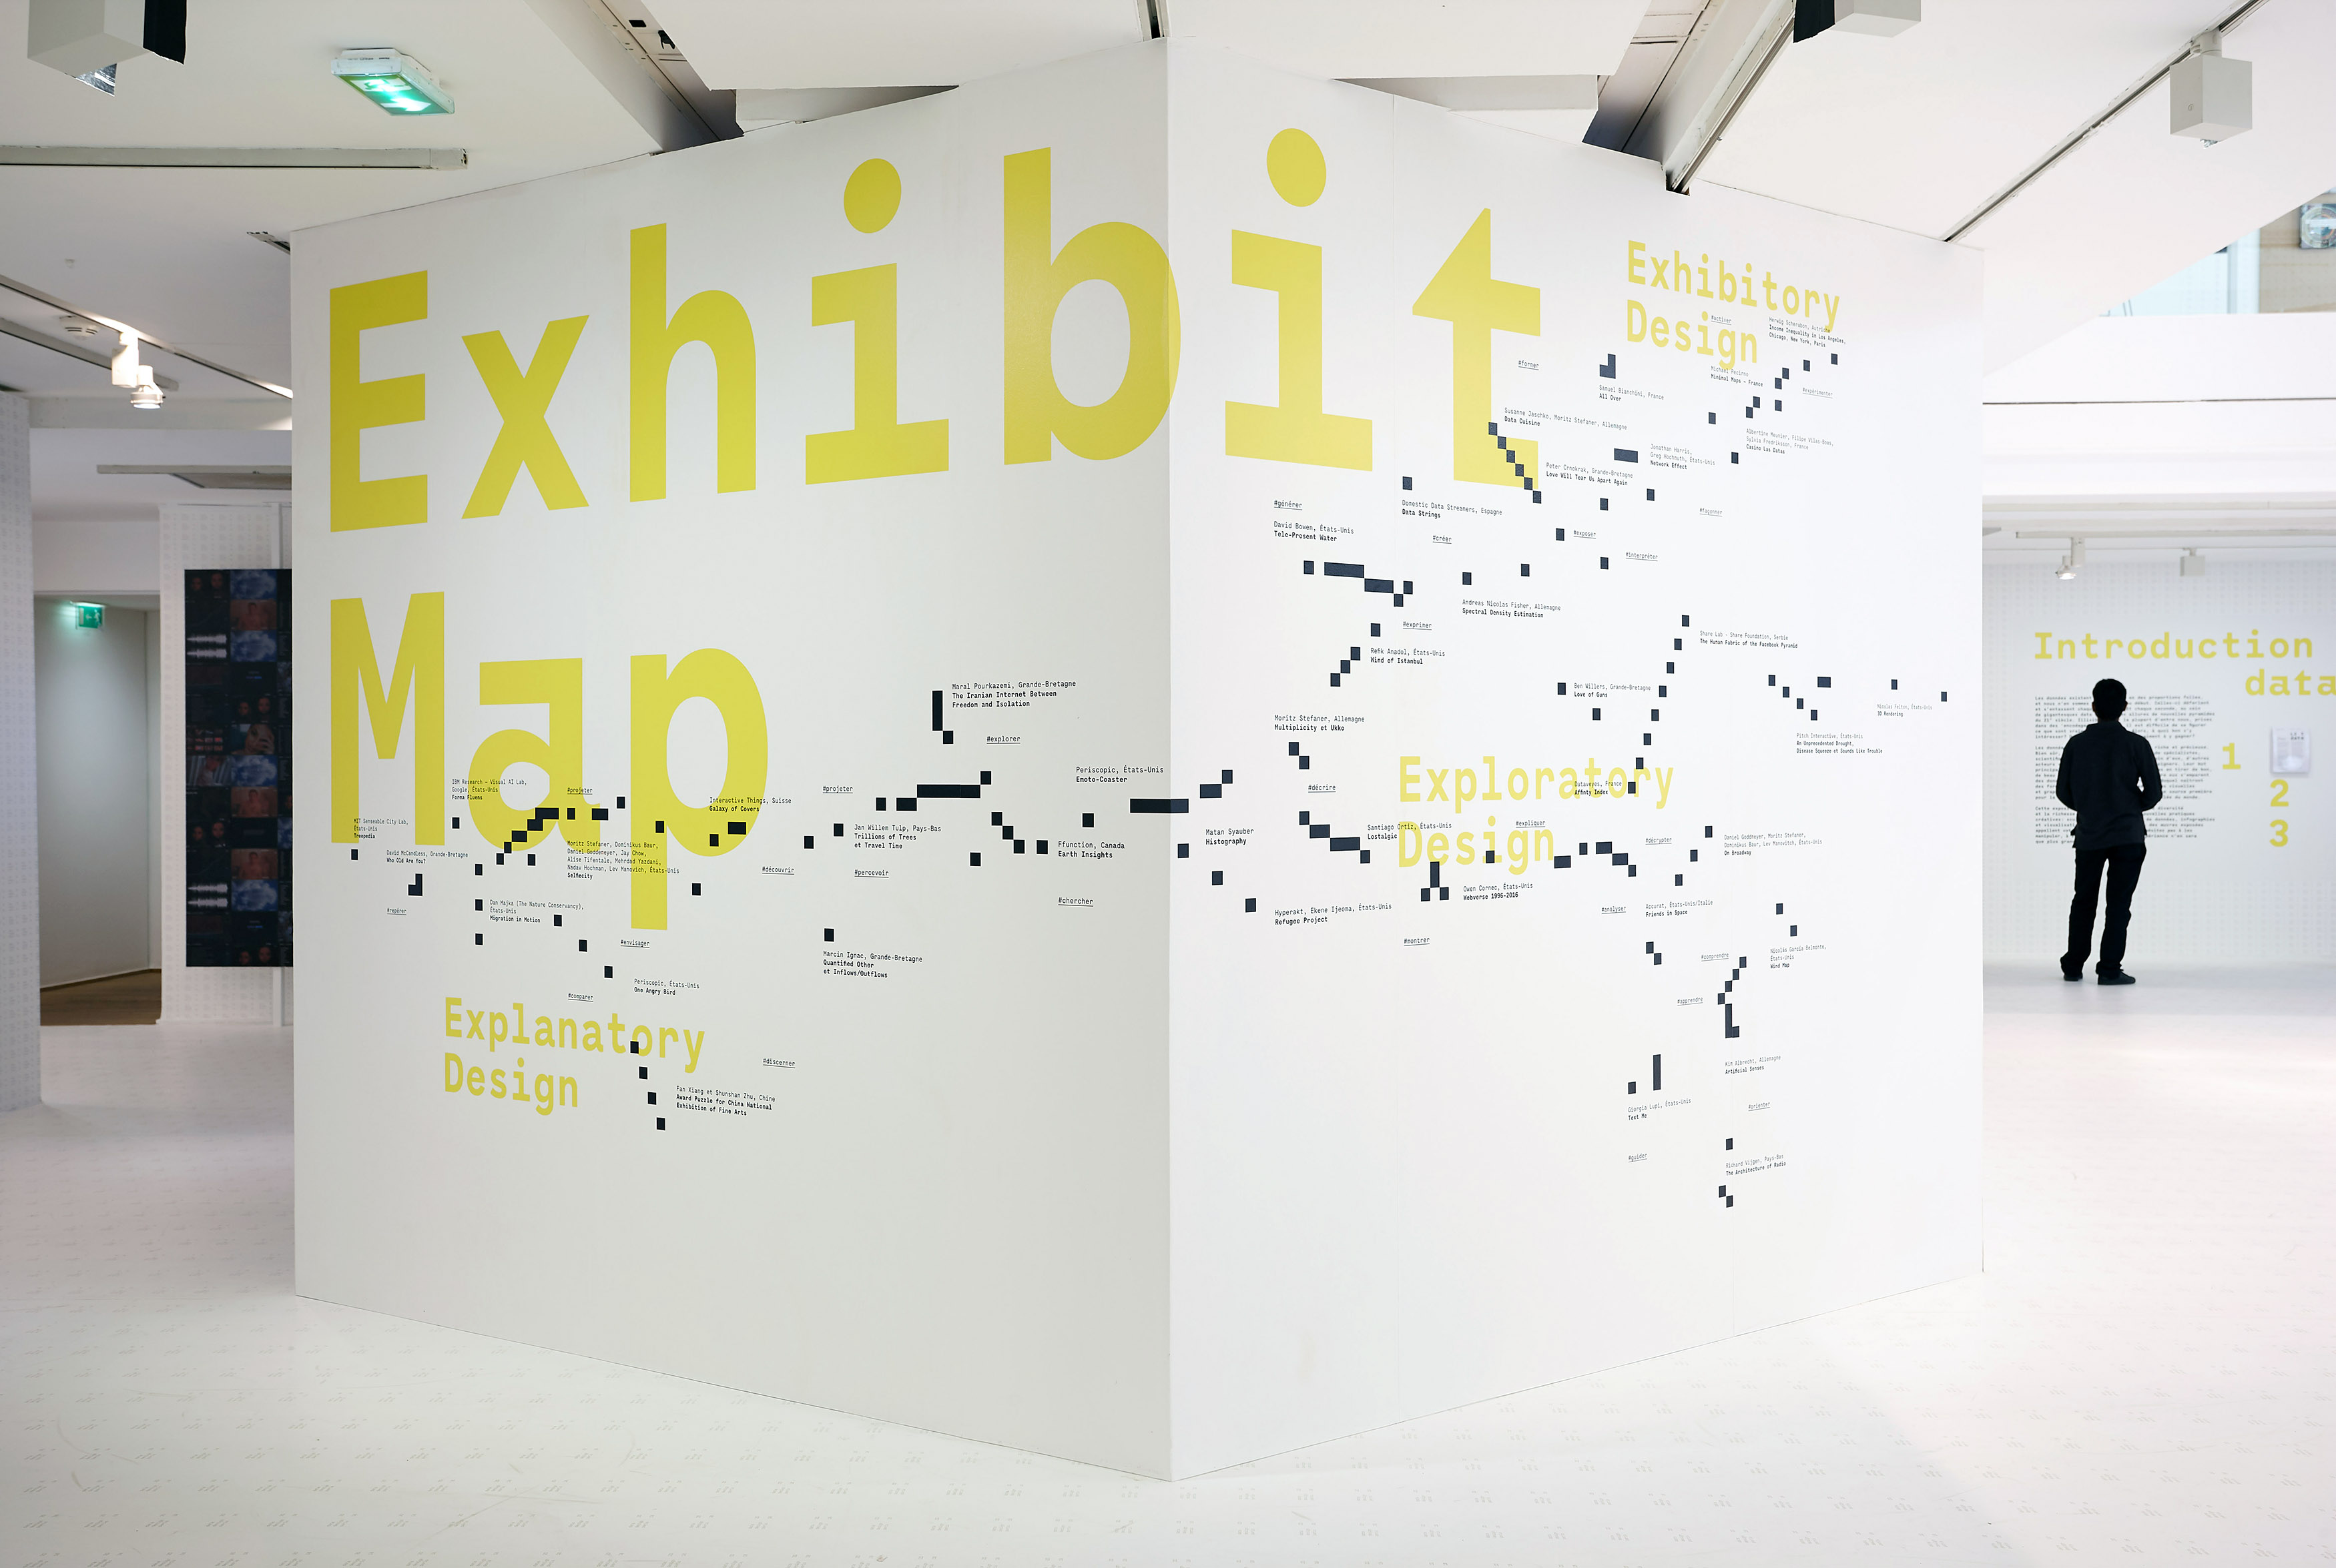
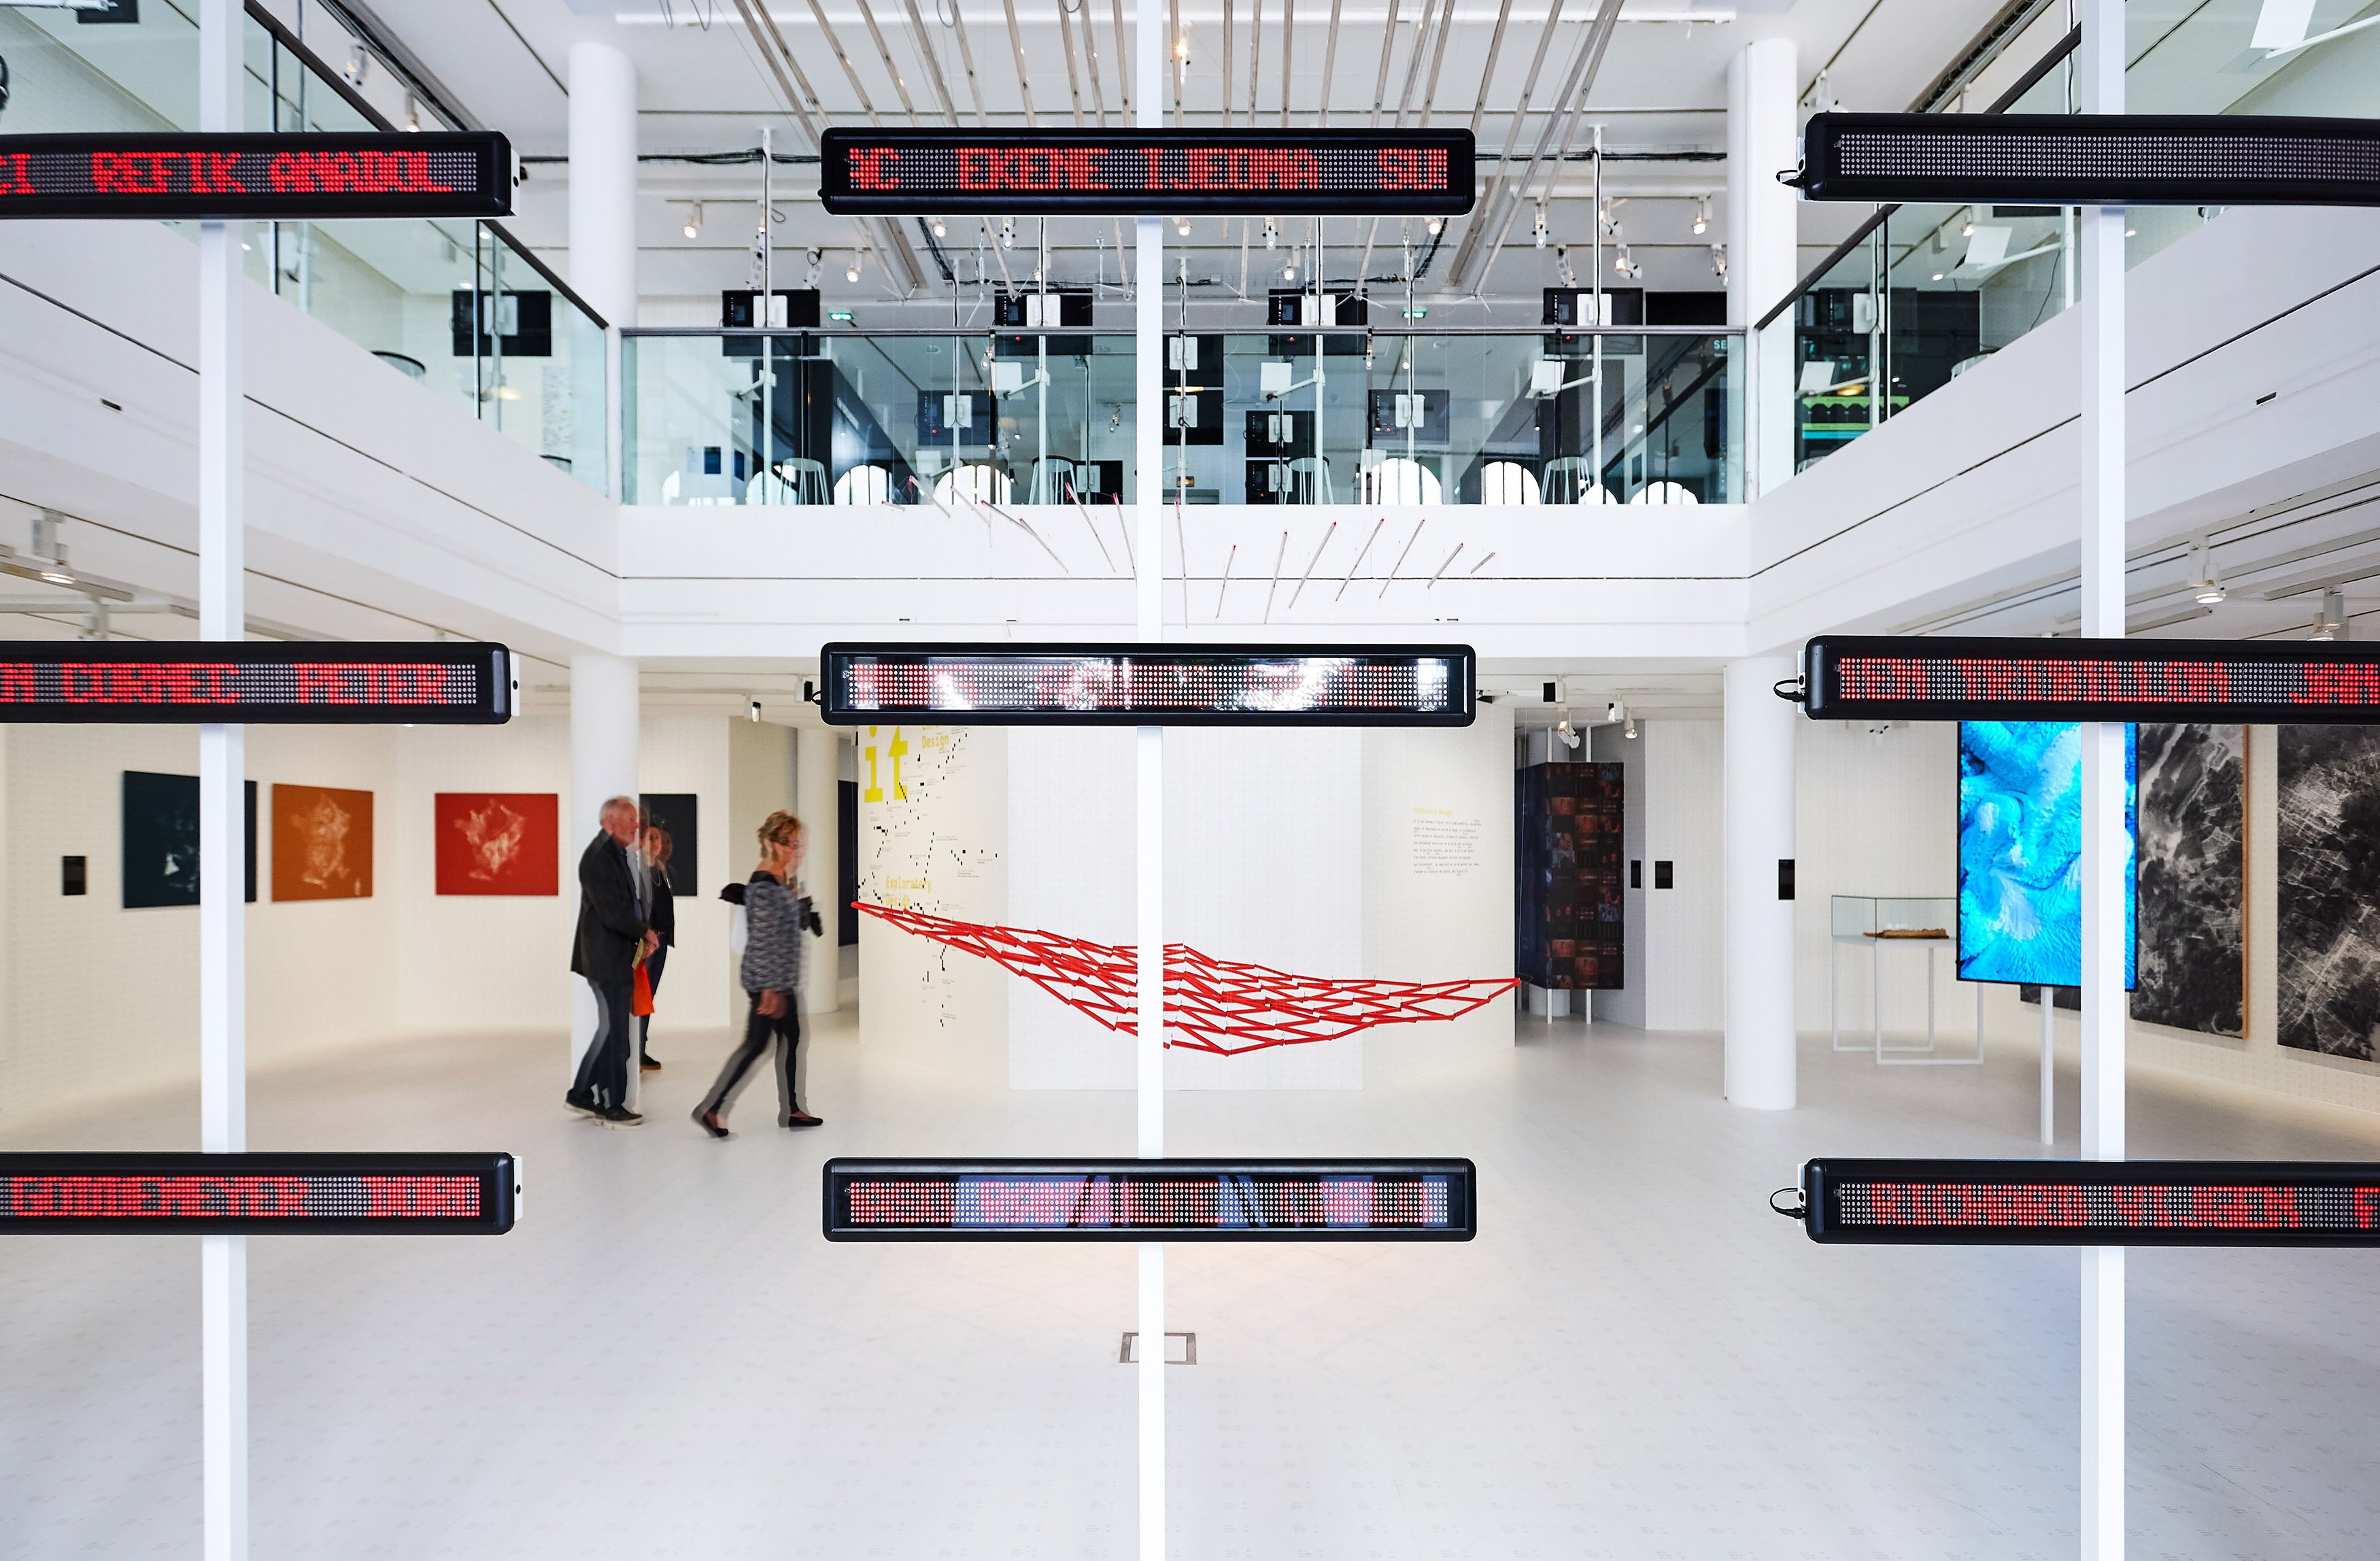
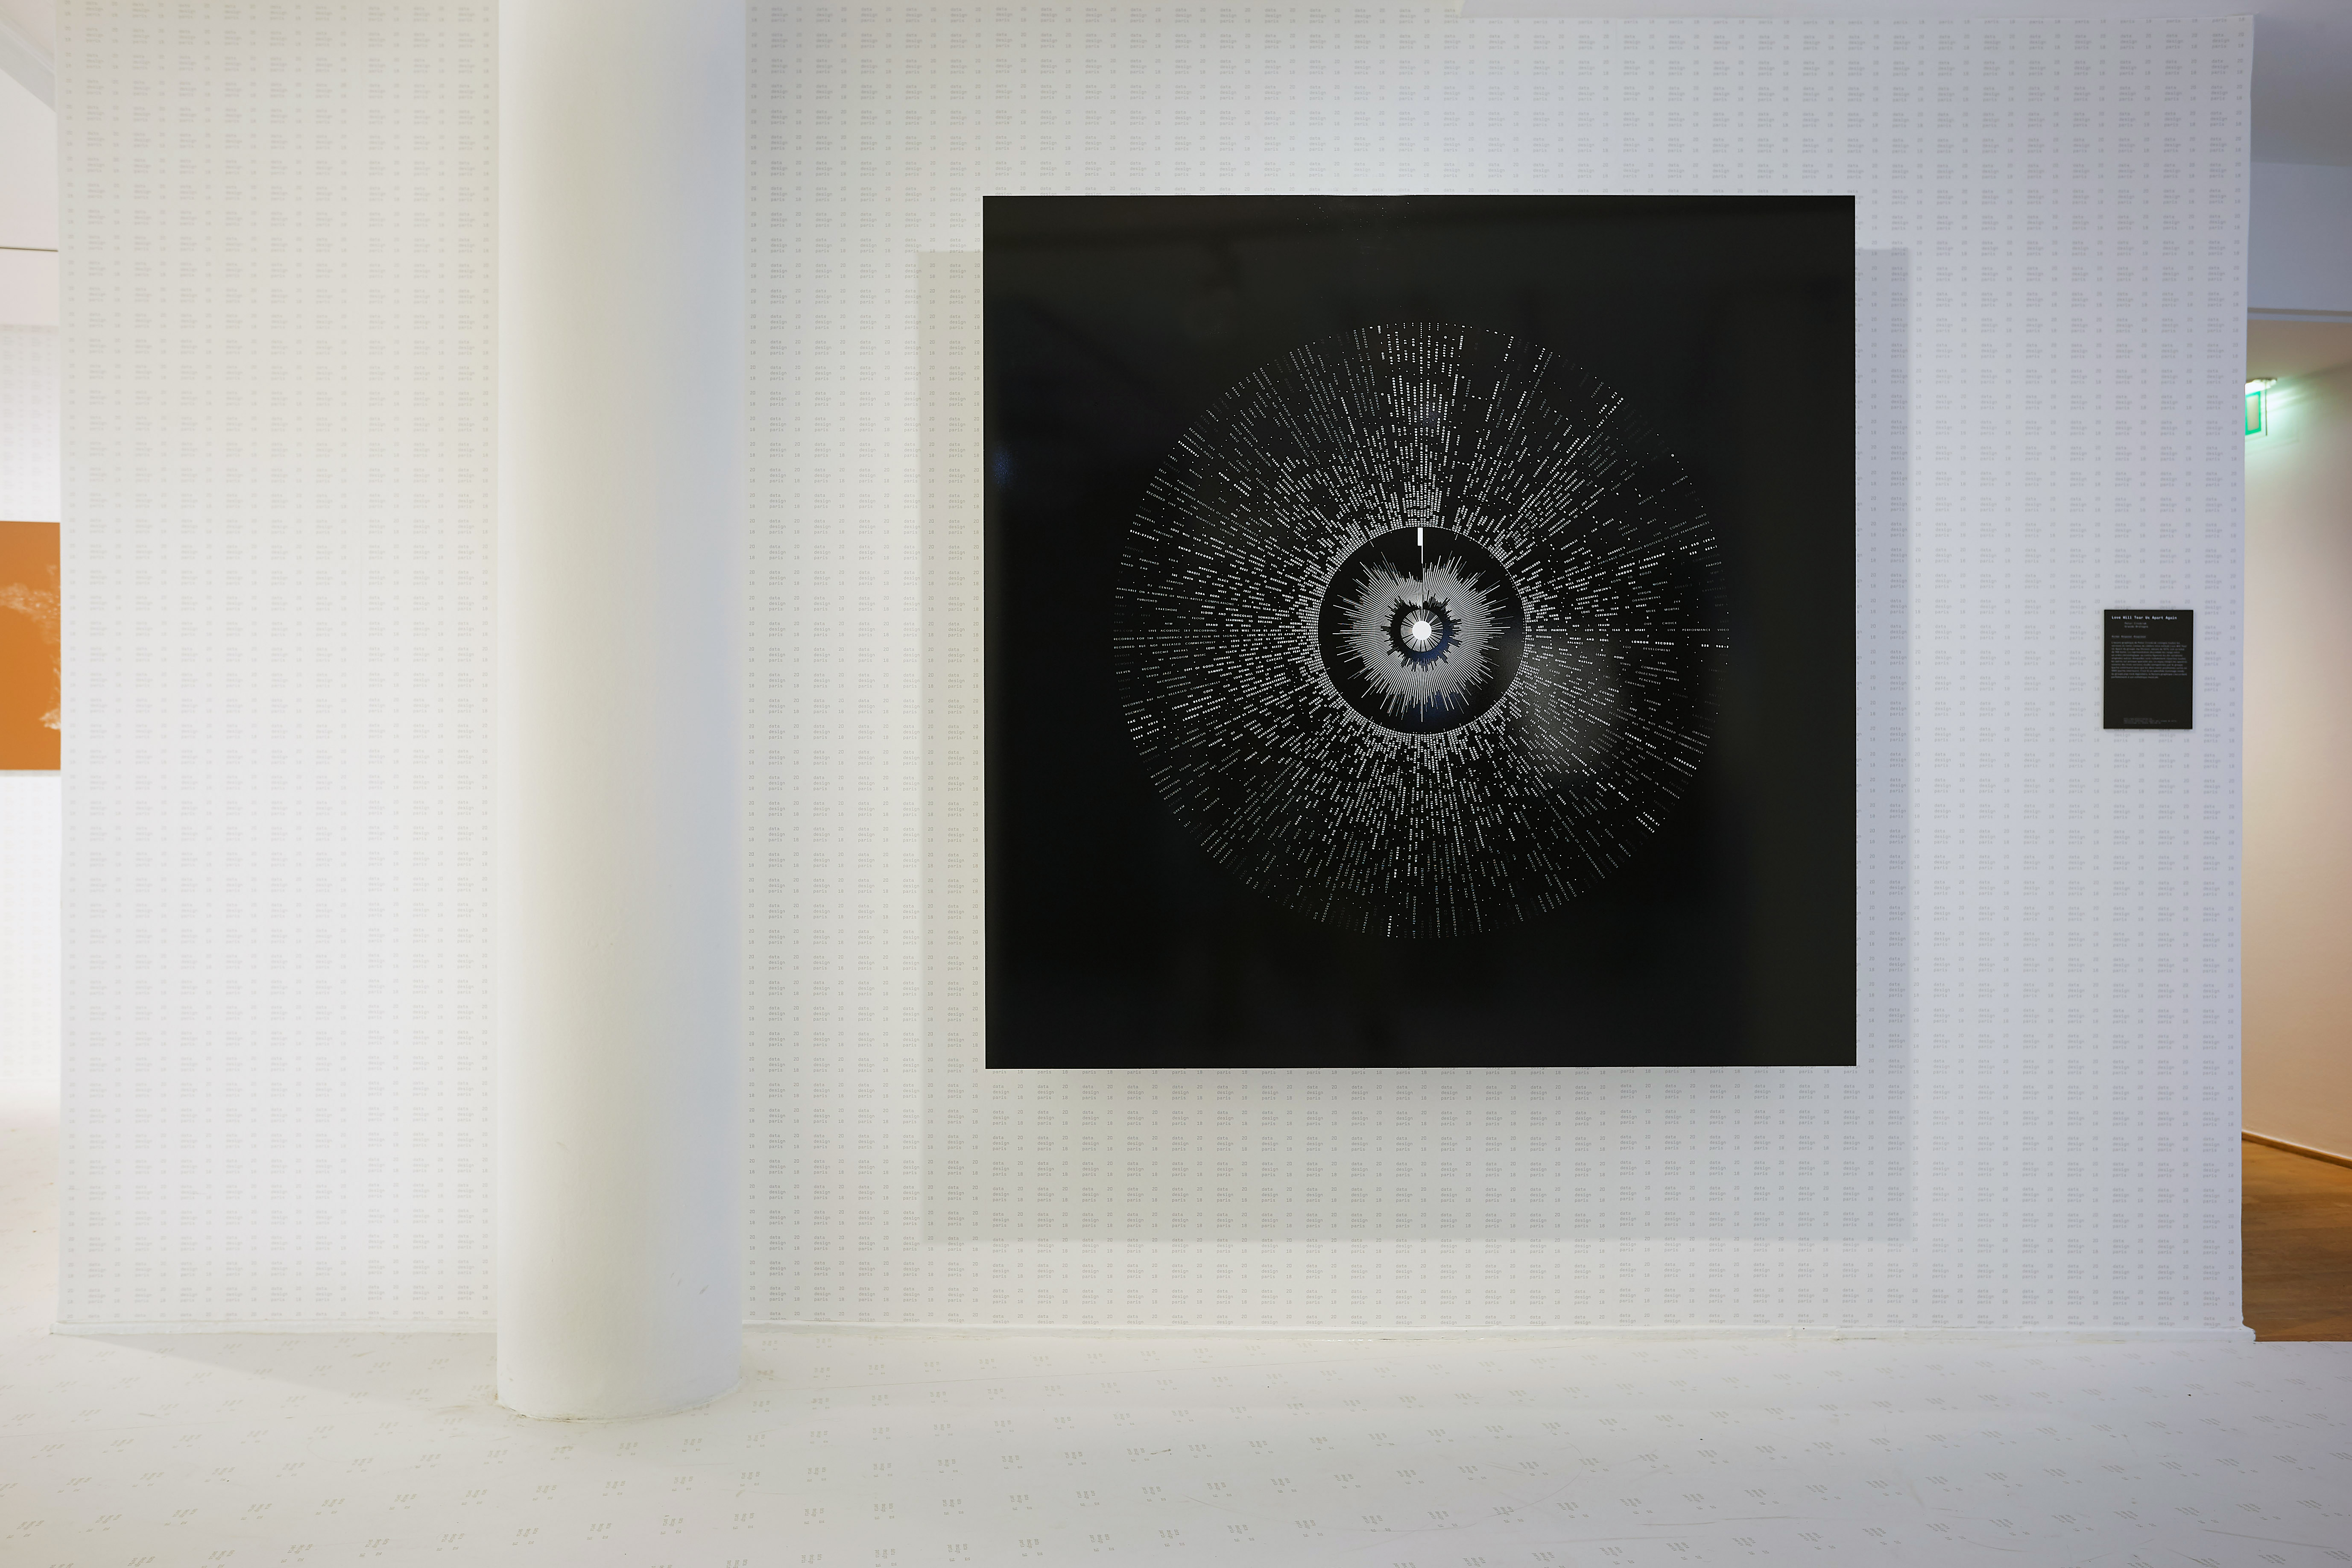
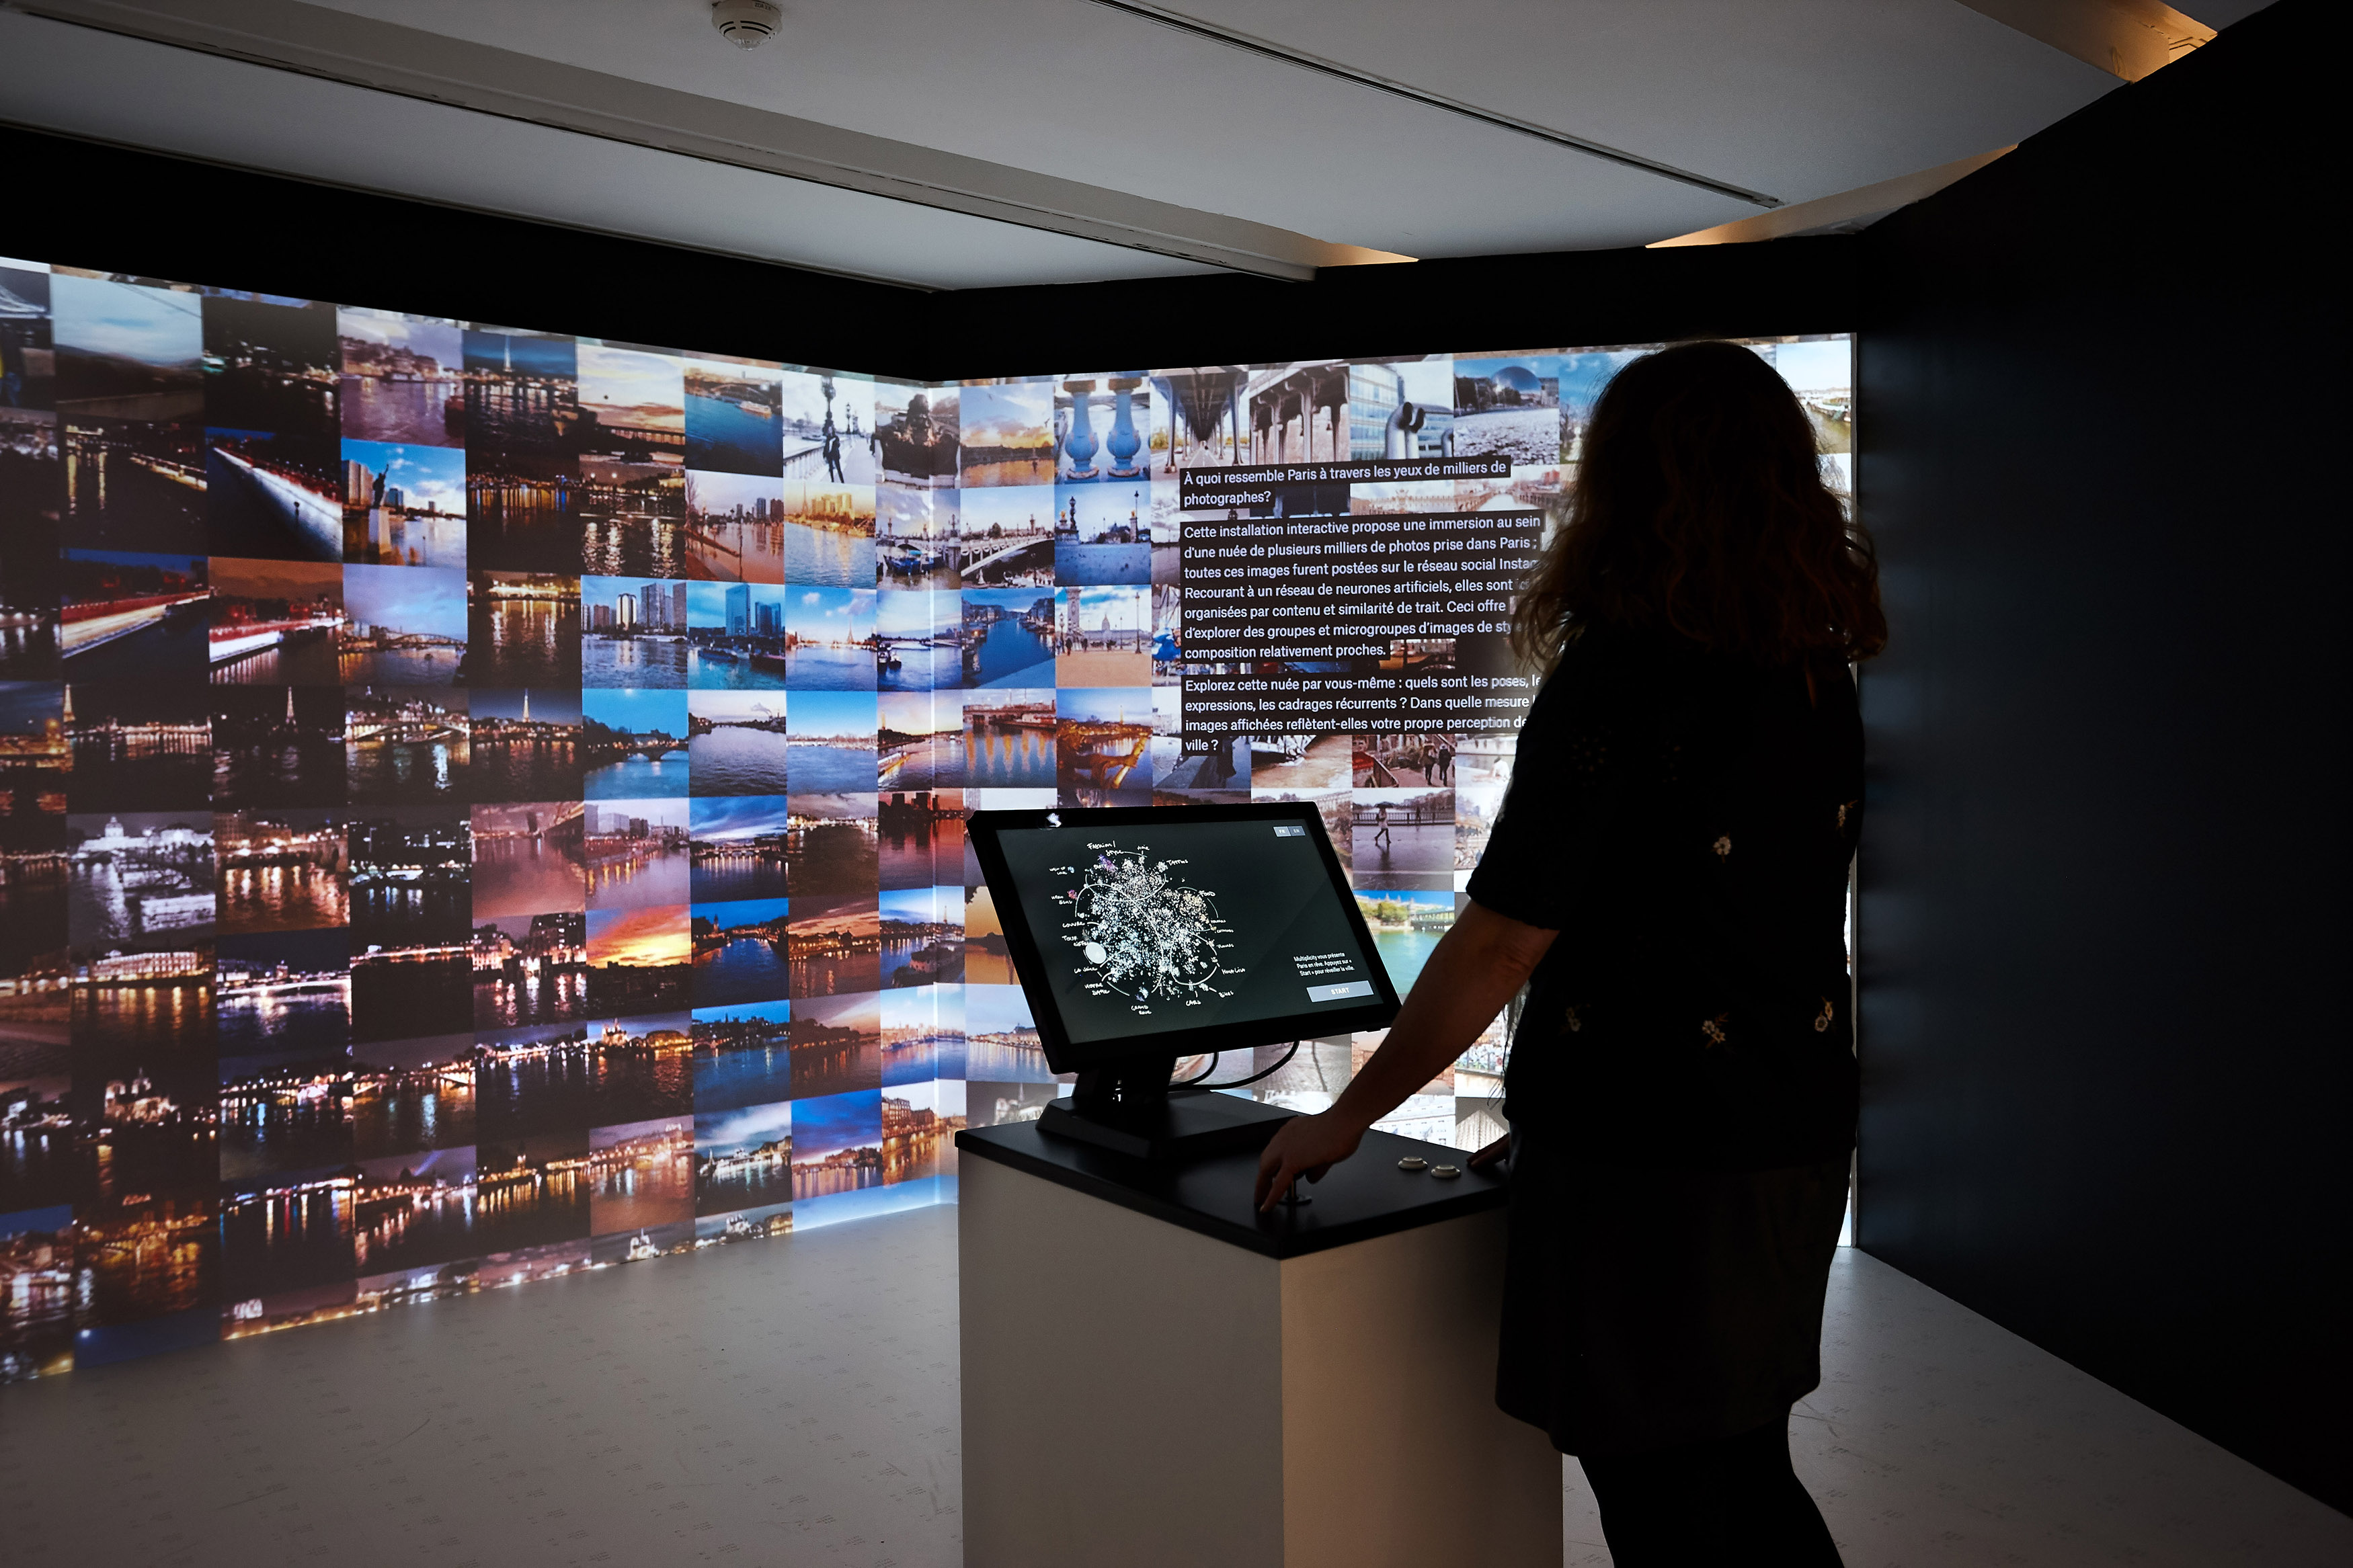
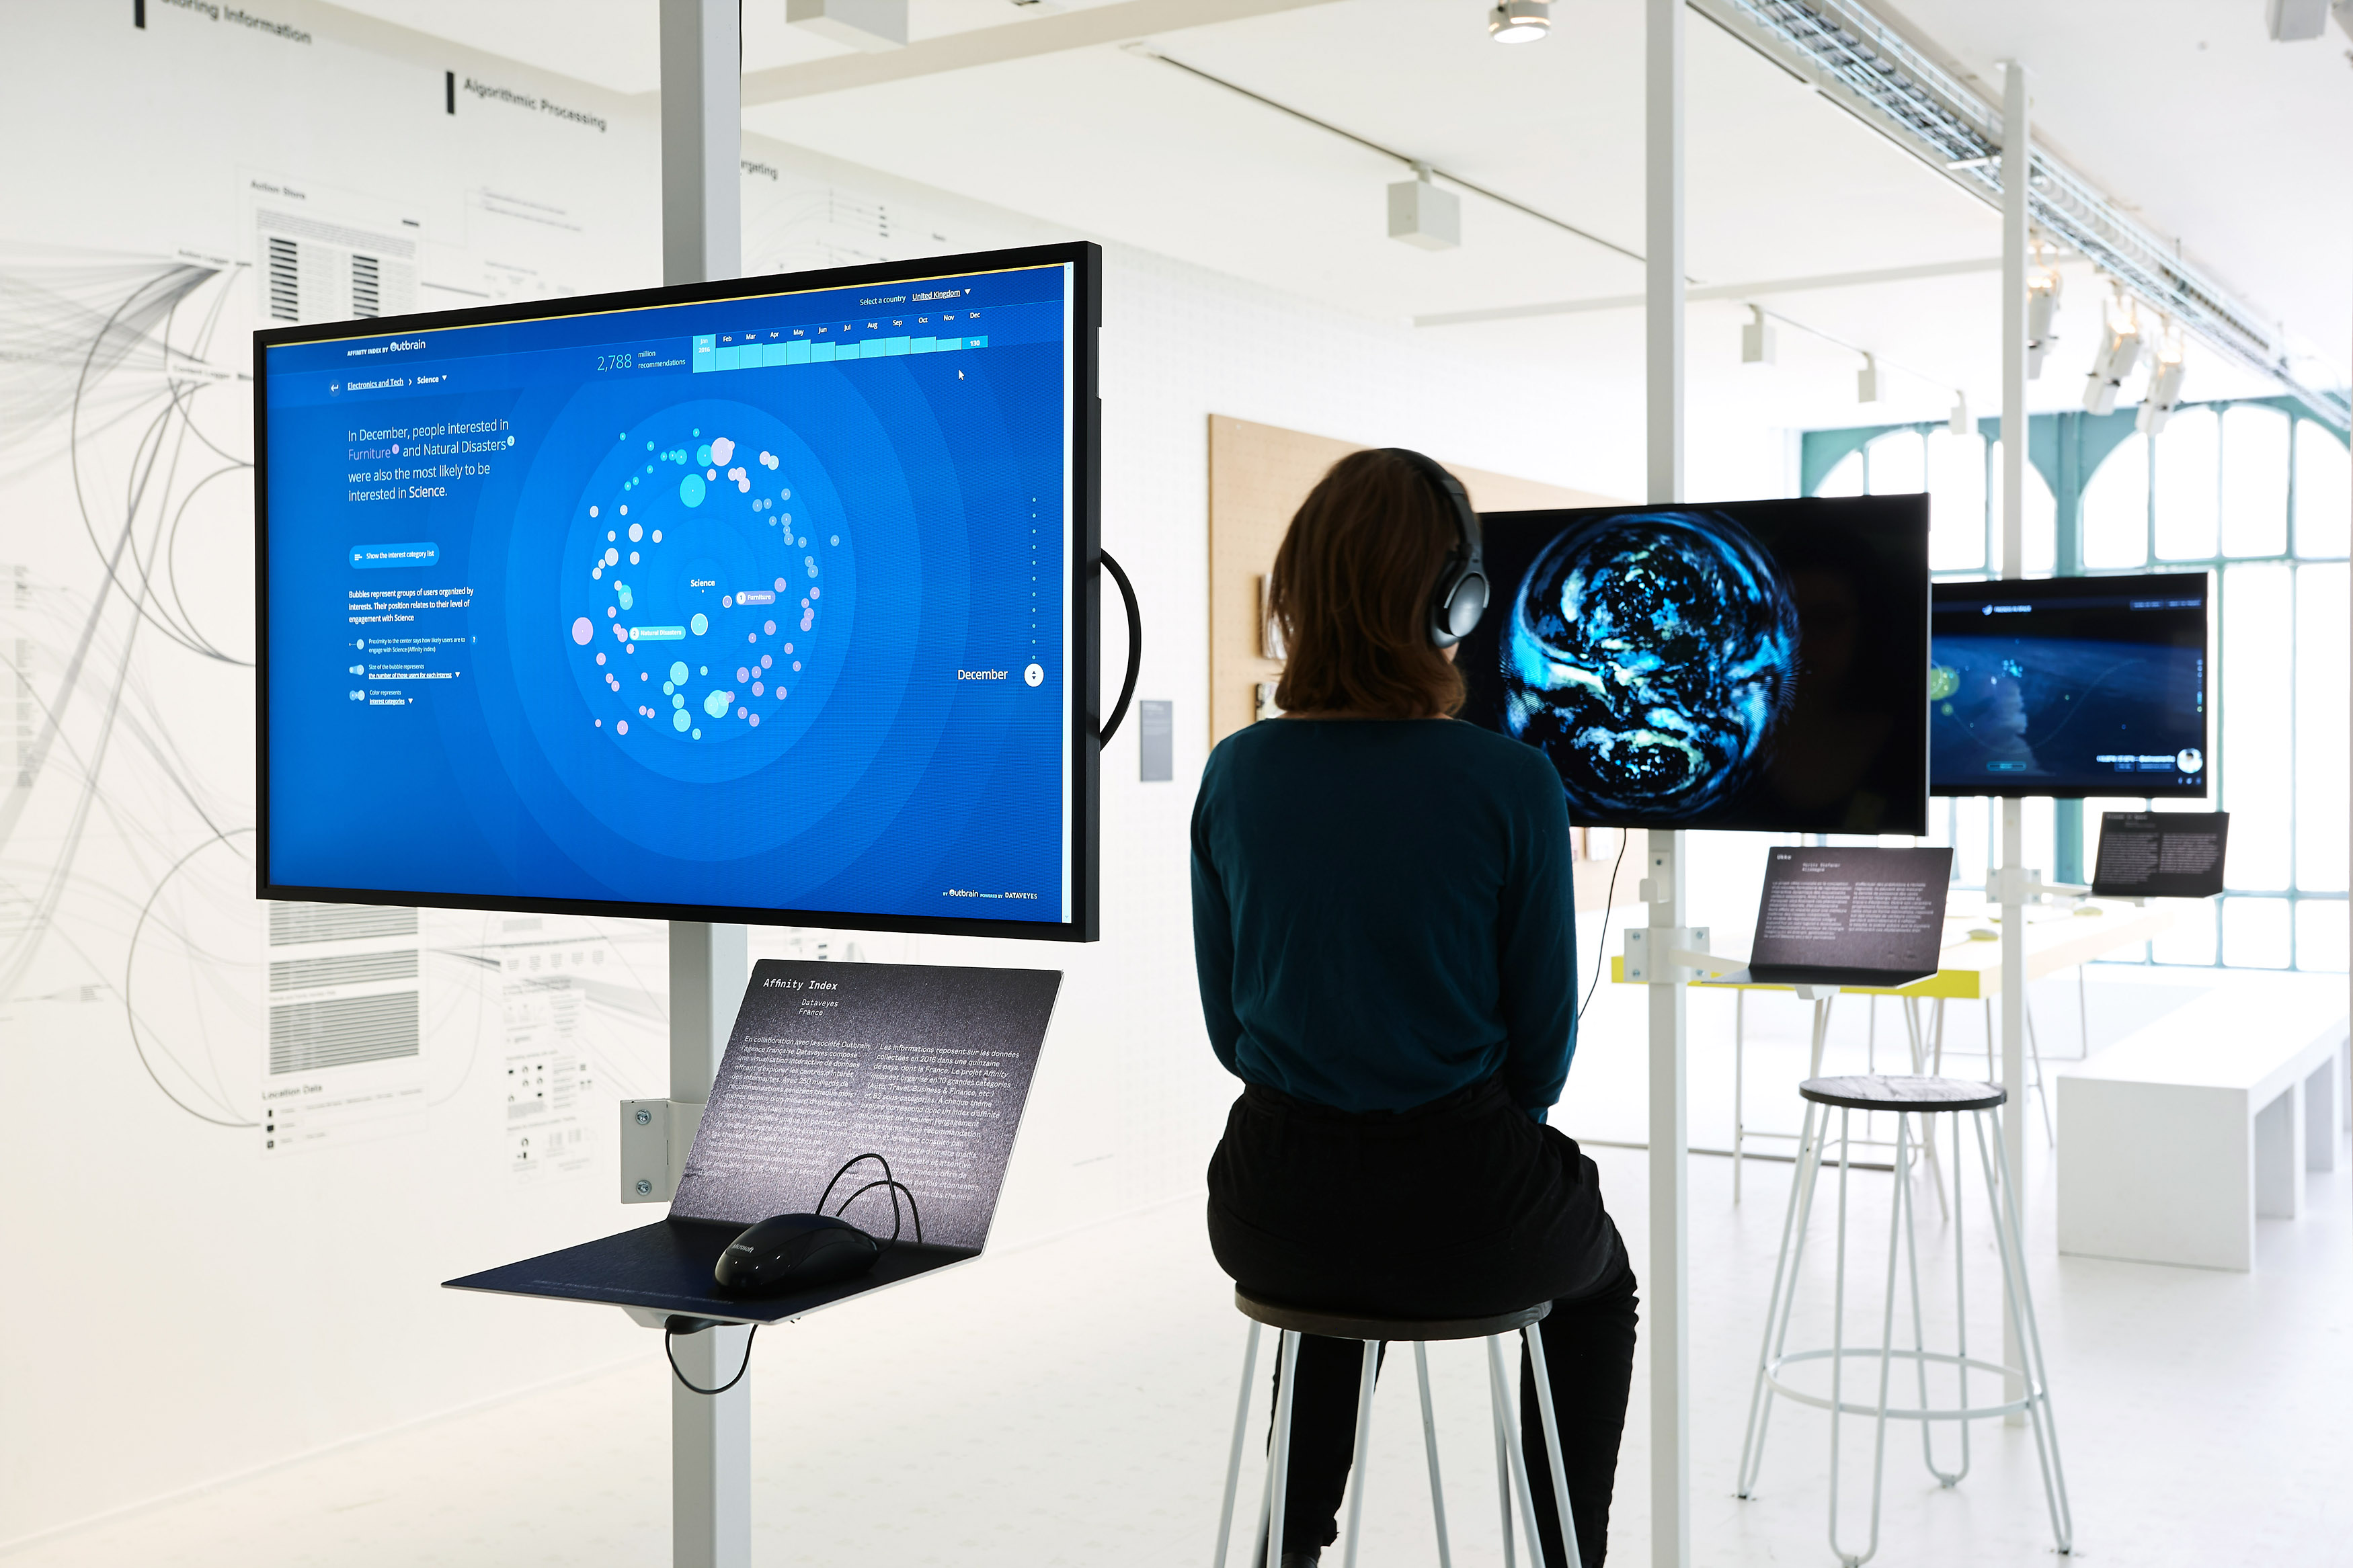
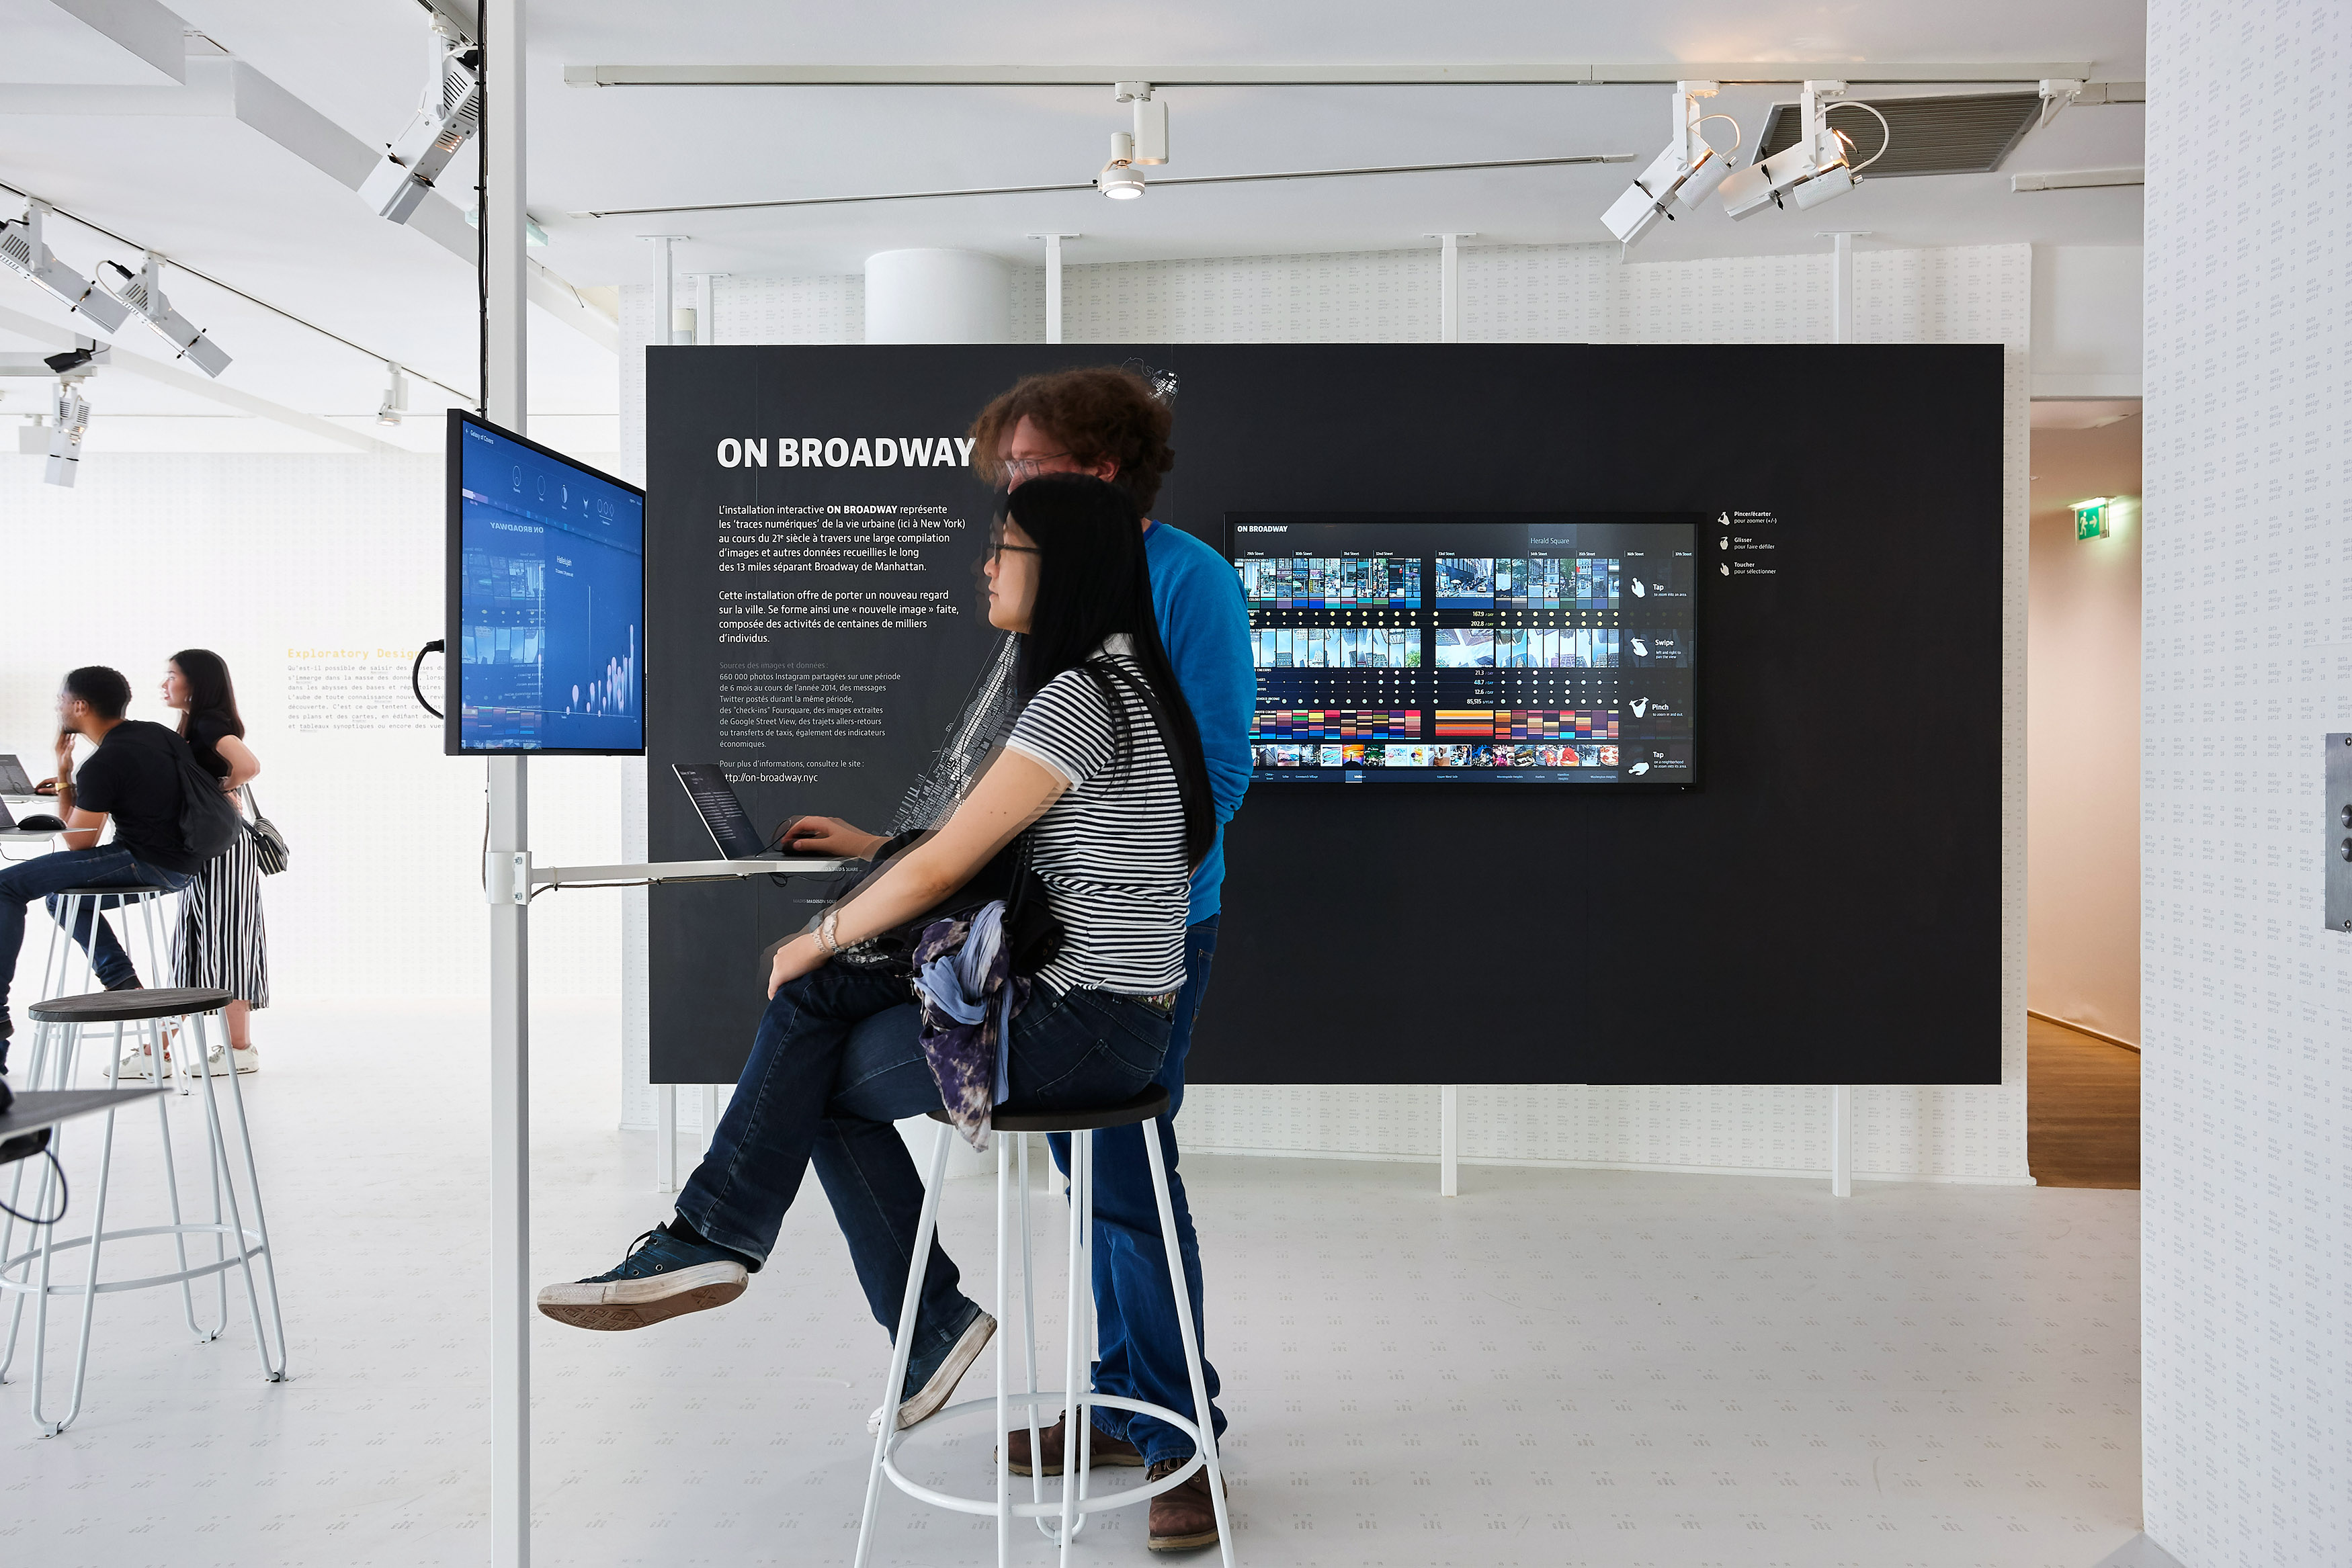
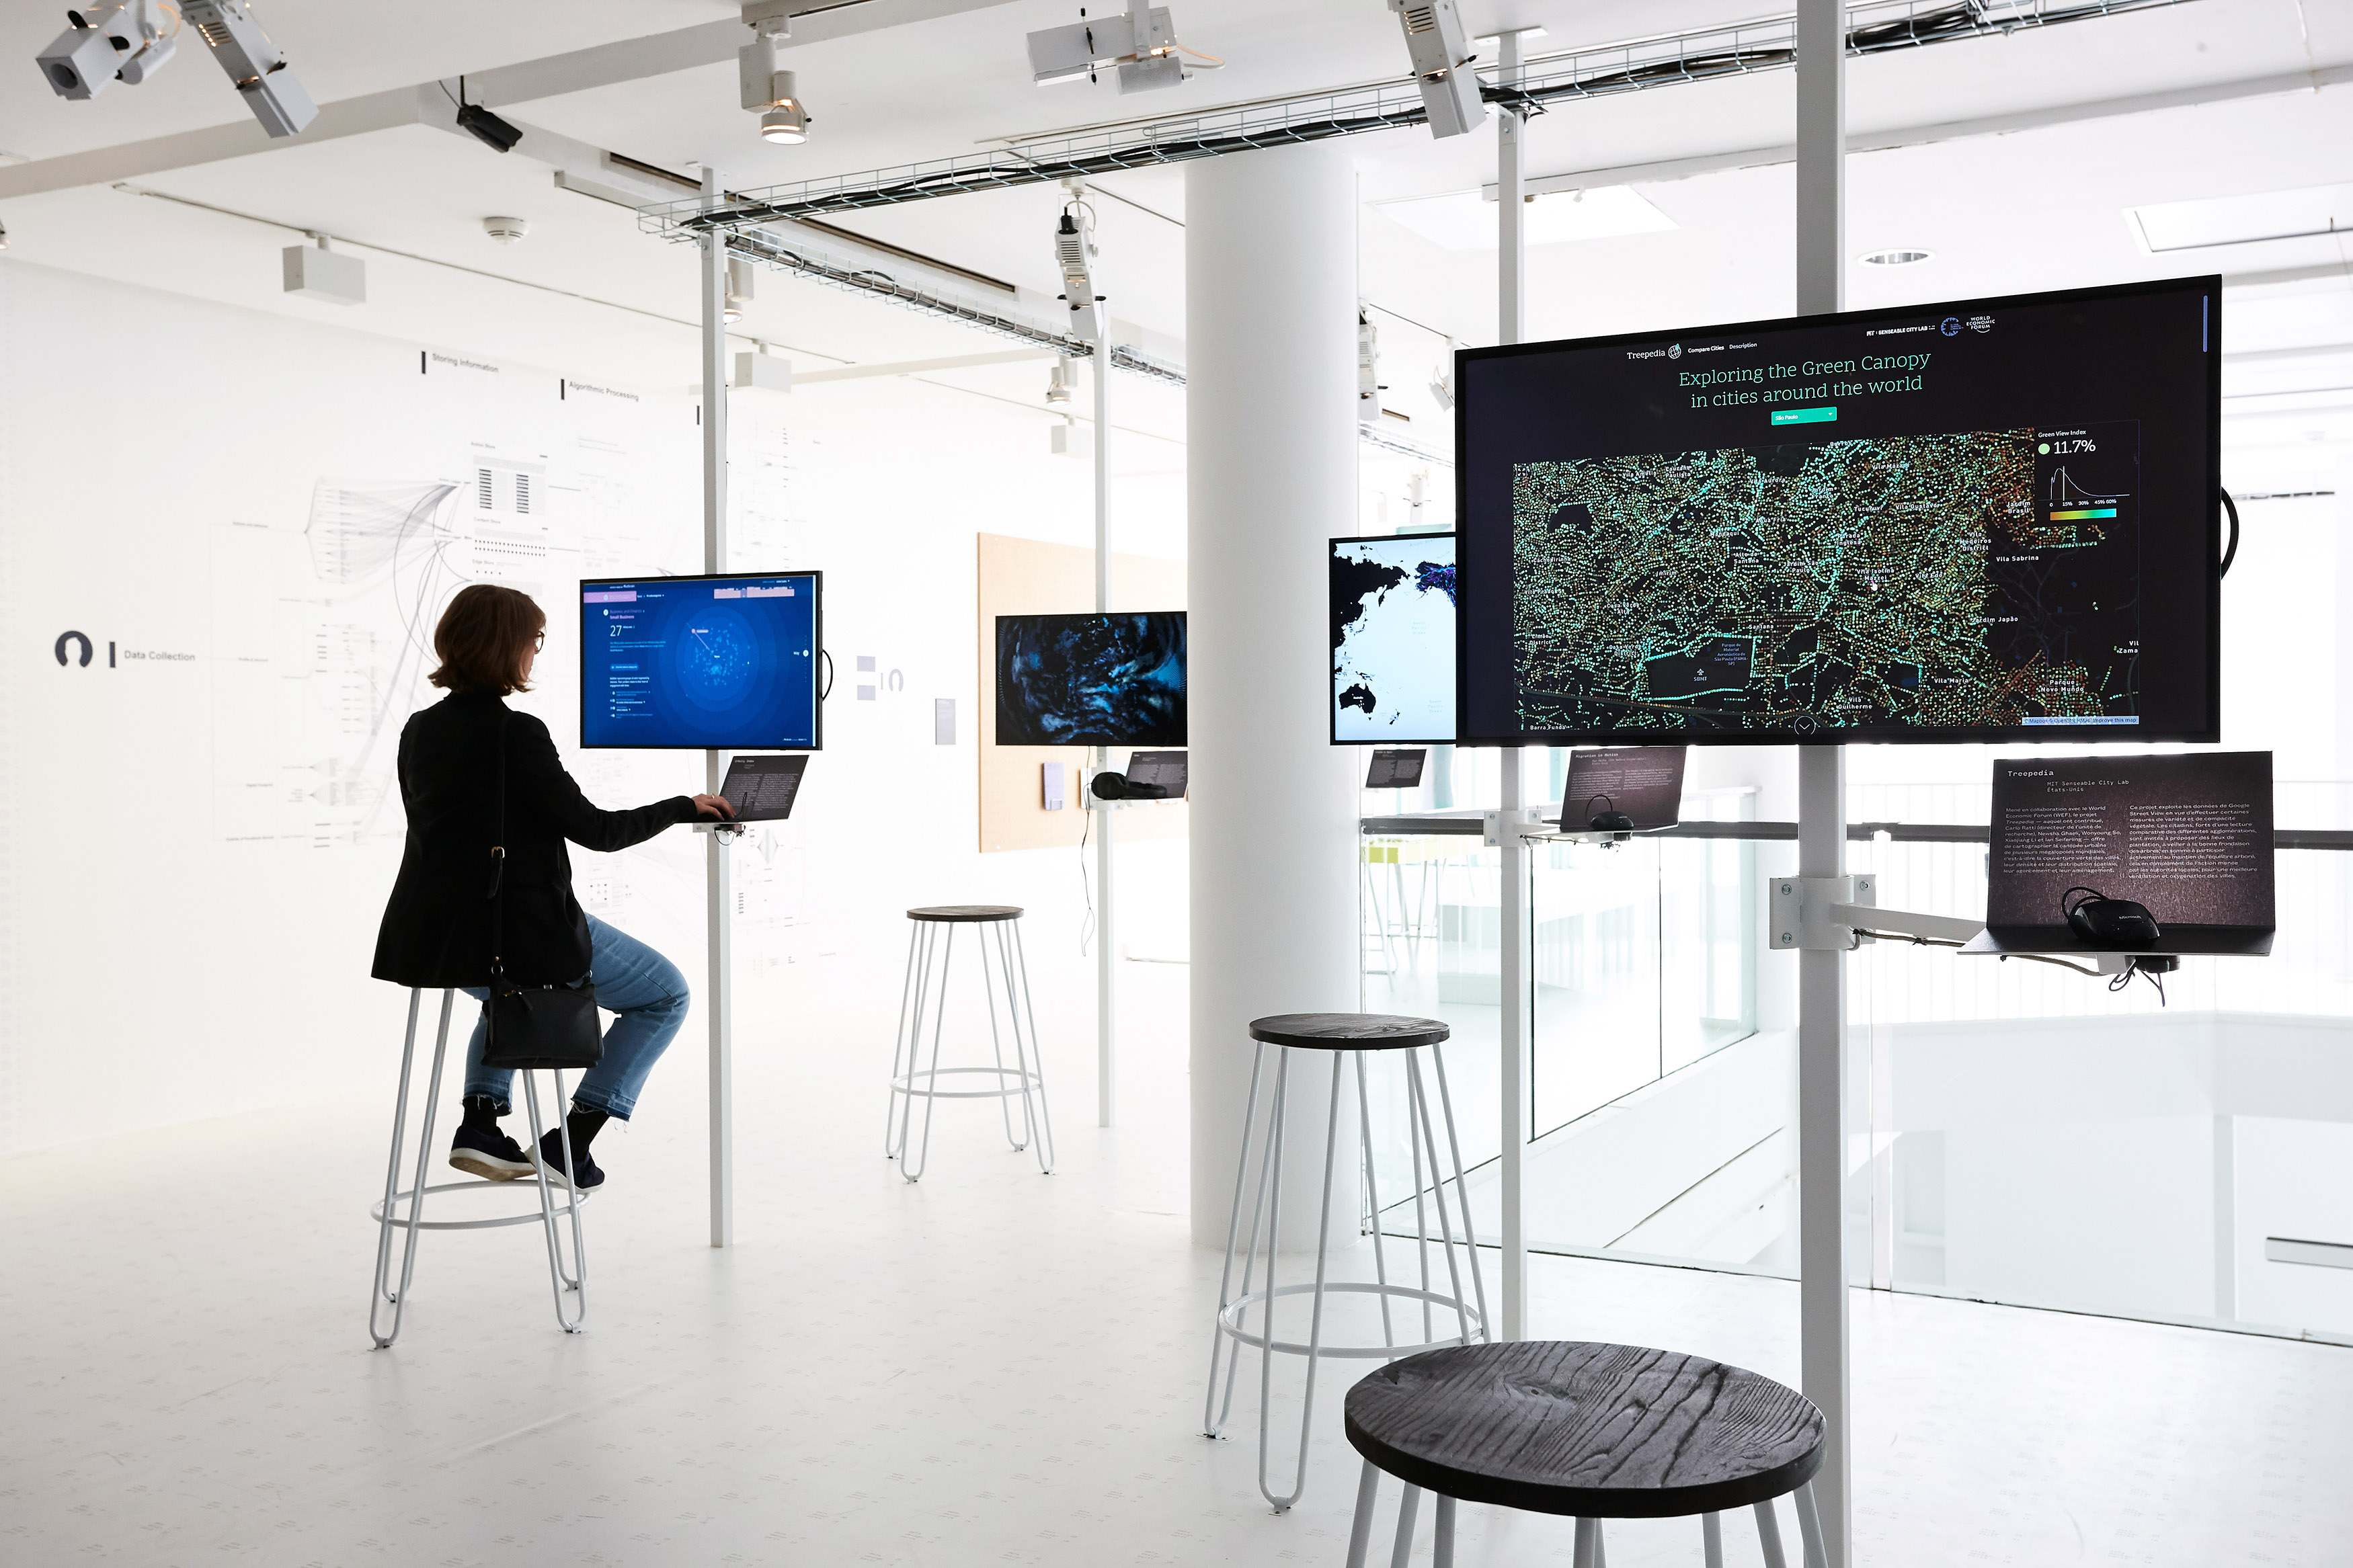
An international exhibition at the EDF Foundation space (400 m2) in Paris dedicated to data design and data art featuring more than 45 pieces: data sculptures, data paintings, data installations, interactive data applications, data games, data visualizations, infographics, and so on. The exhibition dives deep into the arcane world of data-driven design and art. it aims to highlight the richness and variety of the creation in that fields and, through artworks, to challenge preconceived ideas concerning the values and utilities of the data in our contemporary societies. In short, those are the 3 principal pillars on which this exhibition is based: (1) Data as a new creative material/a new medium for designers; (2) Data designers as new present-day adventurers; (3) From the dataification of the world to a new data literacy. The exhibition focuses on the following 3 main broad approaches in data design-art: Exhibitory design, Explanatory design, Exploratory design.
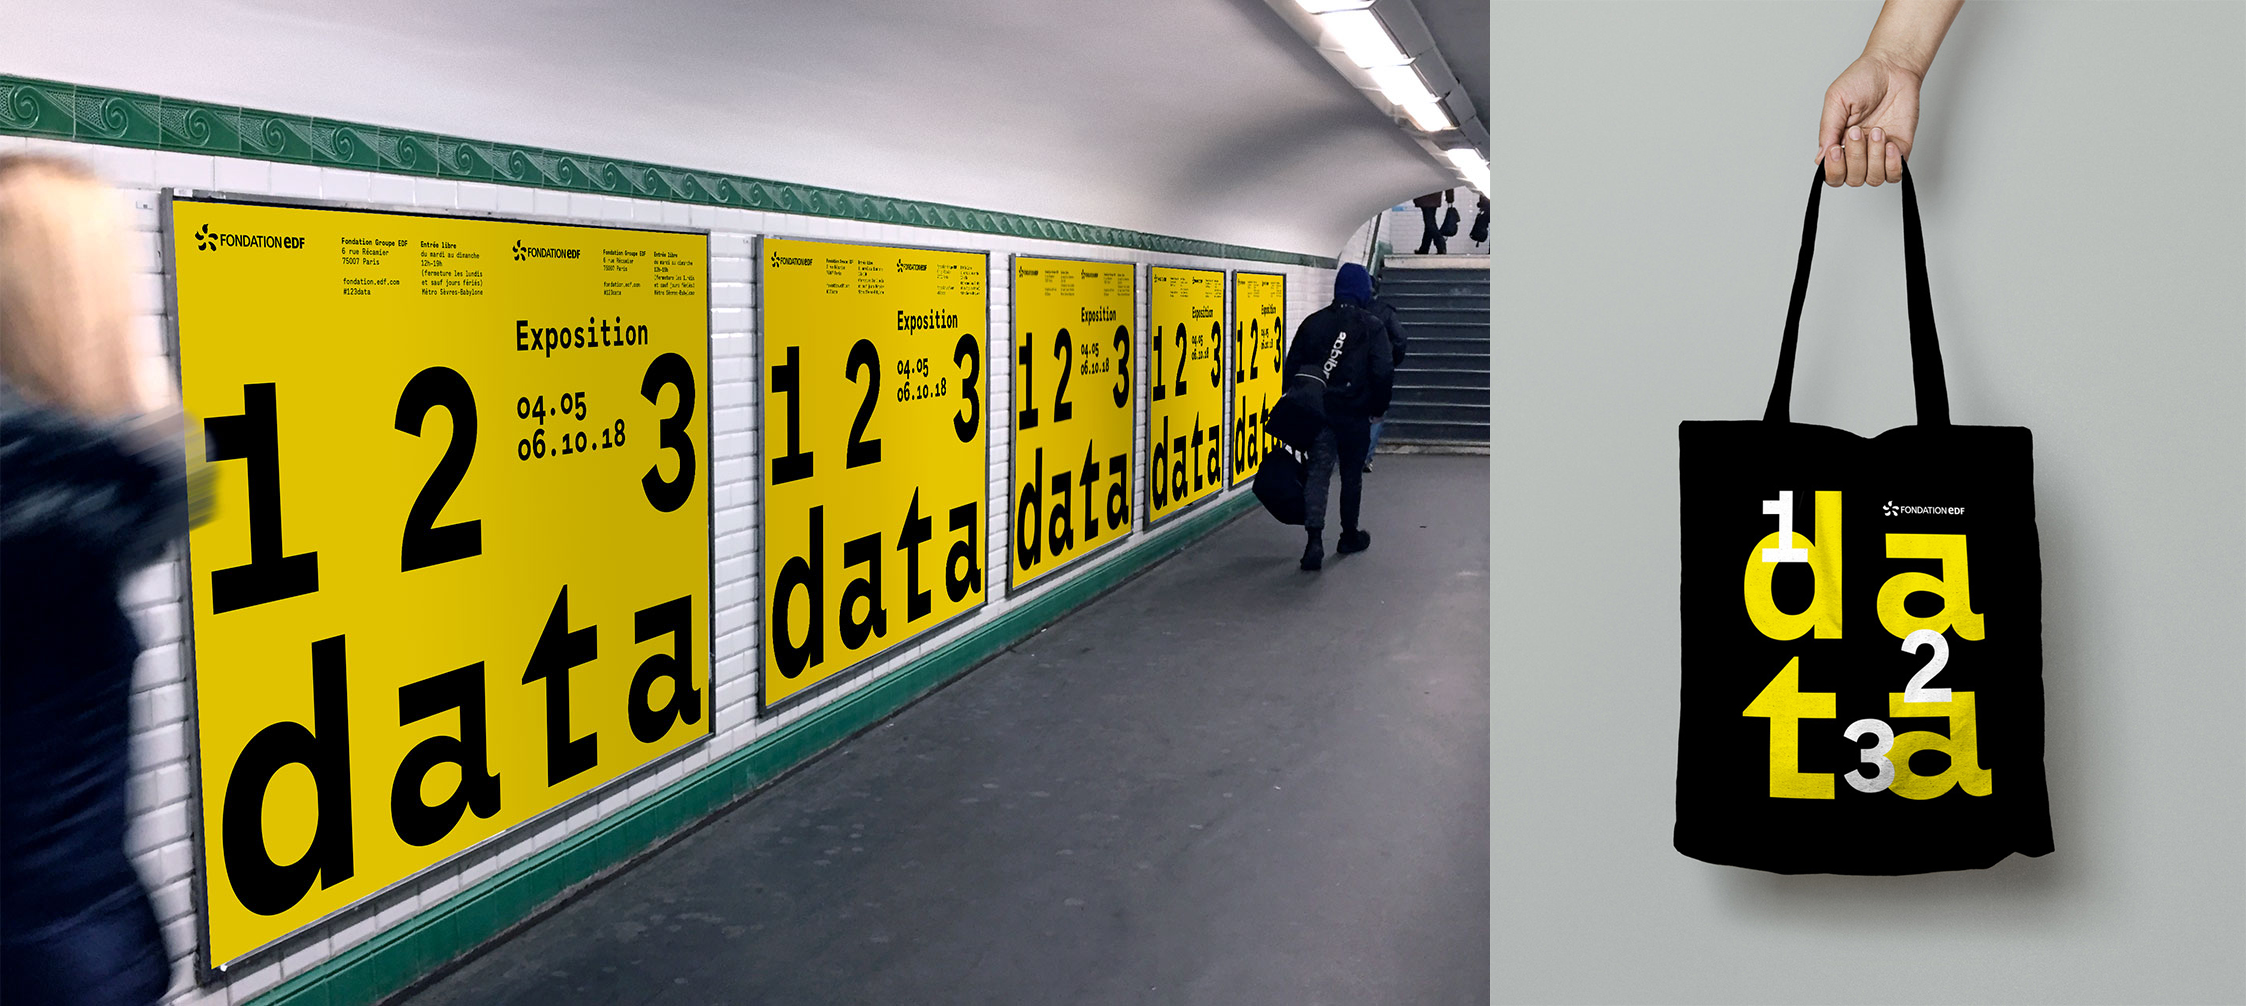
Exhibition “1, 2, 3 data” at the EDF Foundation,
Address: 6 Rue Récamier, 75007 Paris (France),
Exhibition timetable: May, 4-October 6, 2018,
Exhibition curating: David Bihanic,
Scenography and graphic design: Trafik,
Lighting design: Studio 10-30,
Manufacturing: Art Project (PP).
Webpage (EDF Foundation): www.fondation.edf.com[…]; Exhibition website (designed and coded by students from the University Paris 1 Pantheon-Sorbonne): www.123data.paris
Download here the invitation card.
Few words in introduction to the exhibition
We live in a day and age marked by an exponentially growing amount of data being produced, exchanged and generated electronically, whose volume worldwide borders on the 5-zettabyte (1021) mark. To cope with this “information overload”, Design is now, more than ever, paramount in not only addressing the material nature and behavior of such piles of data, but also in ascertaining a spectrum of new user scenarios and outcomes there within. These objectives give rise to new fields of thought and innovation, and prompt people-powered solutions. To satisfy these objectives, Design develops original, graphic shapes aimed at depicting data stocks and flows, as well as translating a number of their volumetric variations (on both a macro and micro level). By doing away with “traditional” Design models oriented around information-fed presentations, Design opts for another vision, striving to devise spaces that, jointly, communicate and characterize data, offering, in turn, a sensitive perception of the relational dynamics inherent in the myriad facets of the data itself. By giving shape, substance and stance to data agregation, gridlock, changes and shifts, Design could not be any better placed to deduct that although the nature of data is immaterial, the existence of the data itself is both real and immanent. Like a giant wonder room, boasting encounters of an extraordinary and eclectic kind, the “1, 2, 3 data” exhibition invites you to plunge into the very heart of the data design process, enabling it to experience the datasphere first-hand by venturing out into the information unknown and unleashing the potential of data having become, as of late, Design’s physical matter. What Design-bred steps or approaches are designers and artists adopting to expose and view these genuinely complex, relationship-based data ecosystems? What is their secret to discerning the multiple advantages, benefits and opportunities that these plethoras of octets harbor in contrast to the dangers and threats lying in wait and whose evolution requires the utmost vigilance and attention? Pleasing to both the eye and mind, the numerous projects and advancements in data design (sculptures, installations, infographics, data visualizations and so on) give you the unique chance to take an active part in the exhibition. — The most pressing questions and topics in today’s society the world over will be addressed, including: environmental/ecological threats, overpopulation, health and access-to-care inequalities, refugee crises, economic development and recession, and many others. Drawing on the awareness raised around data design, the time you spend getting better acquainted with the numeric realm is very likely to positively impact your perception of what Design entails and of the limitless clusters of data able to be retrieved from the real world.
Quelques mots en introduction à l’exposition
Nous vivons une époque marquée par une inflation exponentielle des données produites, générées et échangées informatiquement avoisinant un volume mondial de près de 5 zettabytes (1021), soit 5 milliards de téra-octets. Face à ce déluge informationnel, le design entend jouer un rôle essentiel en vue, d’une part, de résoudre la formalisation et l’expression visuelles de ces amas de données et, d’autre part, d’y déceler de nouvelles orientations et finalités d’emploi ou d’usage. Par là, le design engage la création de formes graphiques originales offrant de dépeindre les stocks autant que les flux de données, également de traduire leurs nombreuses variations volumétriques à l’échelle macro et micro. Complétant, perfectionnant les modèles de conception “classiques” donnant priorité à la présentation des données elles-mêmes, le design déploie de véritables espaces de (re-)présentation ouvrant à une appréhension sensible des dynamiques de relation qu’entretiennent les données entre elles. Conférant forme, matière et comportement aux agrégations, congestions, fluctuations et circulations de données, le design parvient à rendre compte du caractère immatériel de celles-ci et de leurs immanentes présences. À la manière d’un immense cabinet de curiosité (joignant l’inédit à l’éclectisme), l’exposition « 1, 2, 3 data » vous convie à une plongée au cœur du ‘process’ de design de données participant ainsi d’une exploration de la datasphère : à la découverte des nouveaux potentiels de la donnée dès lors considérée comme un matériau de création ; quelles démarches, approches créatives empruntent les designers et artistes en vue de représenter, de visualiser ce qui s’apparente à de véritables écosystèmes relationnels complexes de données ? Comment parviennent-ils à déceler les nombreux avantages, bénéfices et opportunités que recouvrent ces pléthores d’octets, en contrepoint des périls et menaces dont il revient, par ailleurs, de faire état. Reposant sur la présentation de projets et réalisations en design de données de factures très différentes (sculptures, installations, infographies, visualisations de données, etc.), vous êtes invités à prendre part active à l’exposition. ― les questions et thématiques de société parmi les plus vives aujourd’hui (à l’échelle planétaire) y sont abordées : menaces environnementales ou écologiques, inégalités sociales, crises migratoires et bien d’autres. ― Fort d’une sensibilisation à la création avec les données, nous espérons que vous retiendrez plus largement de ce voyage en terre numérique ce que le design offre à voir et à saisir du monde actuel.
Exhibitors
Kim Albrecht,
Tiziana Alocci,
Refik Anadol,
Dominikus Baur,
Samuel Bianchini,
David Bowen,
Michaela Büsse,
Dino Citraro,
Owen Cornec,
Peter Crnokrak,
Marian Dörk,
Nicholas Felton,
Sylvia Fredriksson,
Nicolás García Belmonte,
Pau García,
Newsha Ghaeli,
Daniel Goddemeyer,
Dorothée Goffin,
Caroline Goulard,
Léo Gourven,
Wesley Grubbs,
Jonathan Harris,
Greg Hochmuth,
Marcin Ignac,
Ekene Ijeoma,
Susanne Jaschko,
Vladan Joler,
Audrée Lapierre,
Xiaojiang Li,
Giorgia Lupi,
Dan Majka,
Lev Manovich,
Mauro Martino,
David McCandless,
Albertine Meunier,
Cory Mollet,
Iolanda Monso,
Elisenda Muns,
Andreas Nicolas Fischer,
Andrés Ortiz,
Santiago Ortiz,
Michael Pecirno,
Deroy Peraza,
Sébastien Pierre,
Maral Pourkazemi,
Simone Quadri,
Dámaso Randulfe,
Carlo Ratti,
Kim Rees,
Gaëtan Richard,
Eric Rodenbeck,
Gabriele Rossi,
Herwig Scherabon,
Ian Seiferling,
Wonyoung So,
Erin Schenck,
Rachel Seavey,
Matan Stauber,
Moritz Stefaner,
Hendrik Strobelt,
Jer Thorp,
Justinien Tribillon,
Juan-Pablo Velez,
Benoit Vidal,
Richard Vijgen,
Filipe Vilas-Boas,
Claire Wehrung,
Benjamin Wiederkehr,
Jan Willem Tulp,
Ben Willers,
Fan Xiang,
Nathan Yau,
Piero Zagami,
Shunshan Zhu.
Photos in the exhibition space


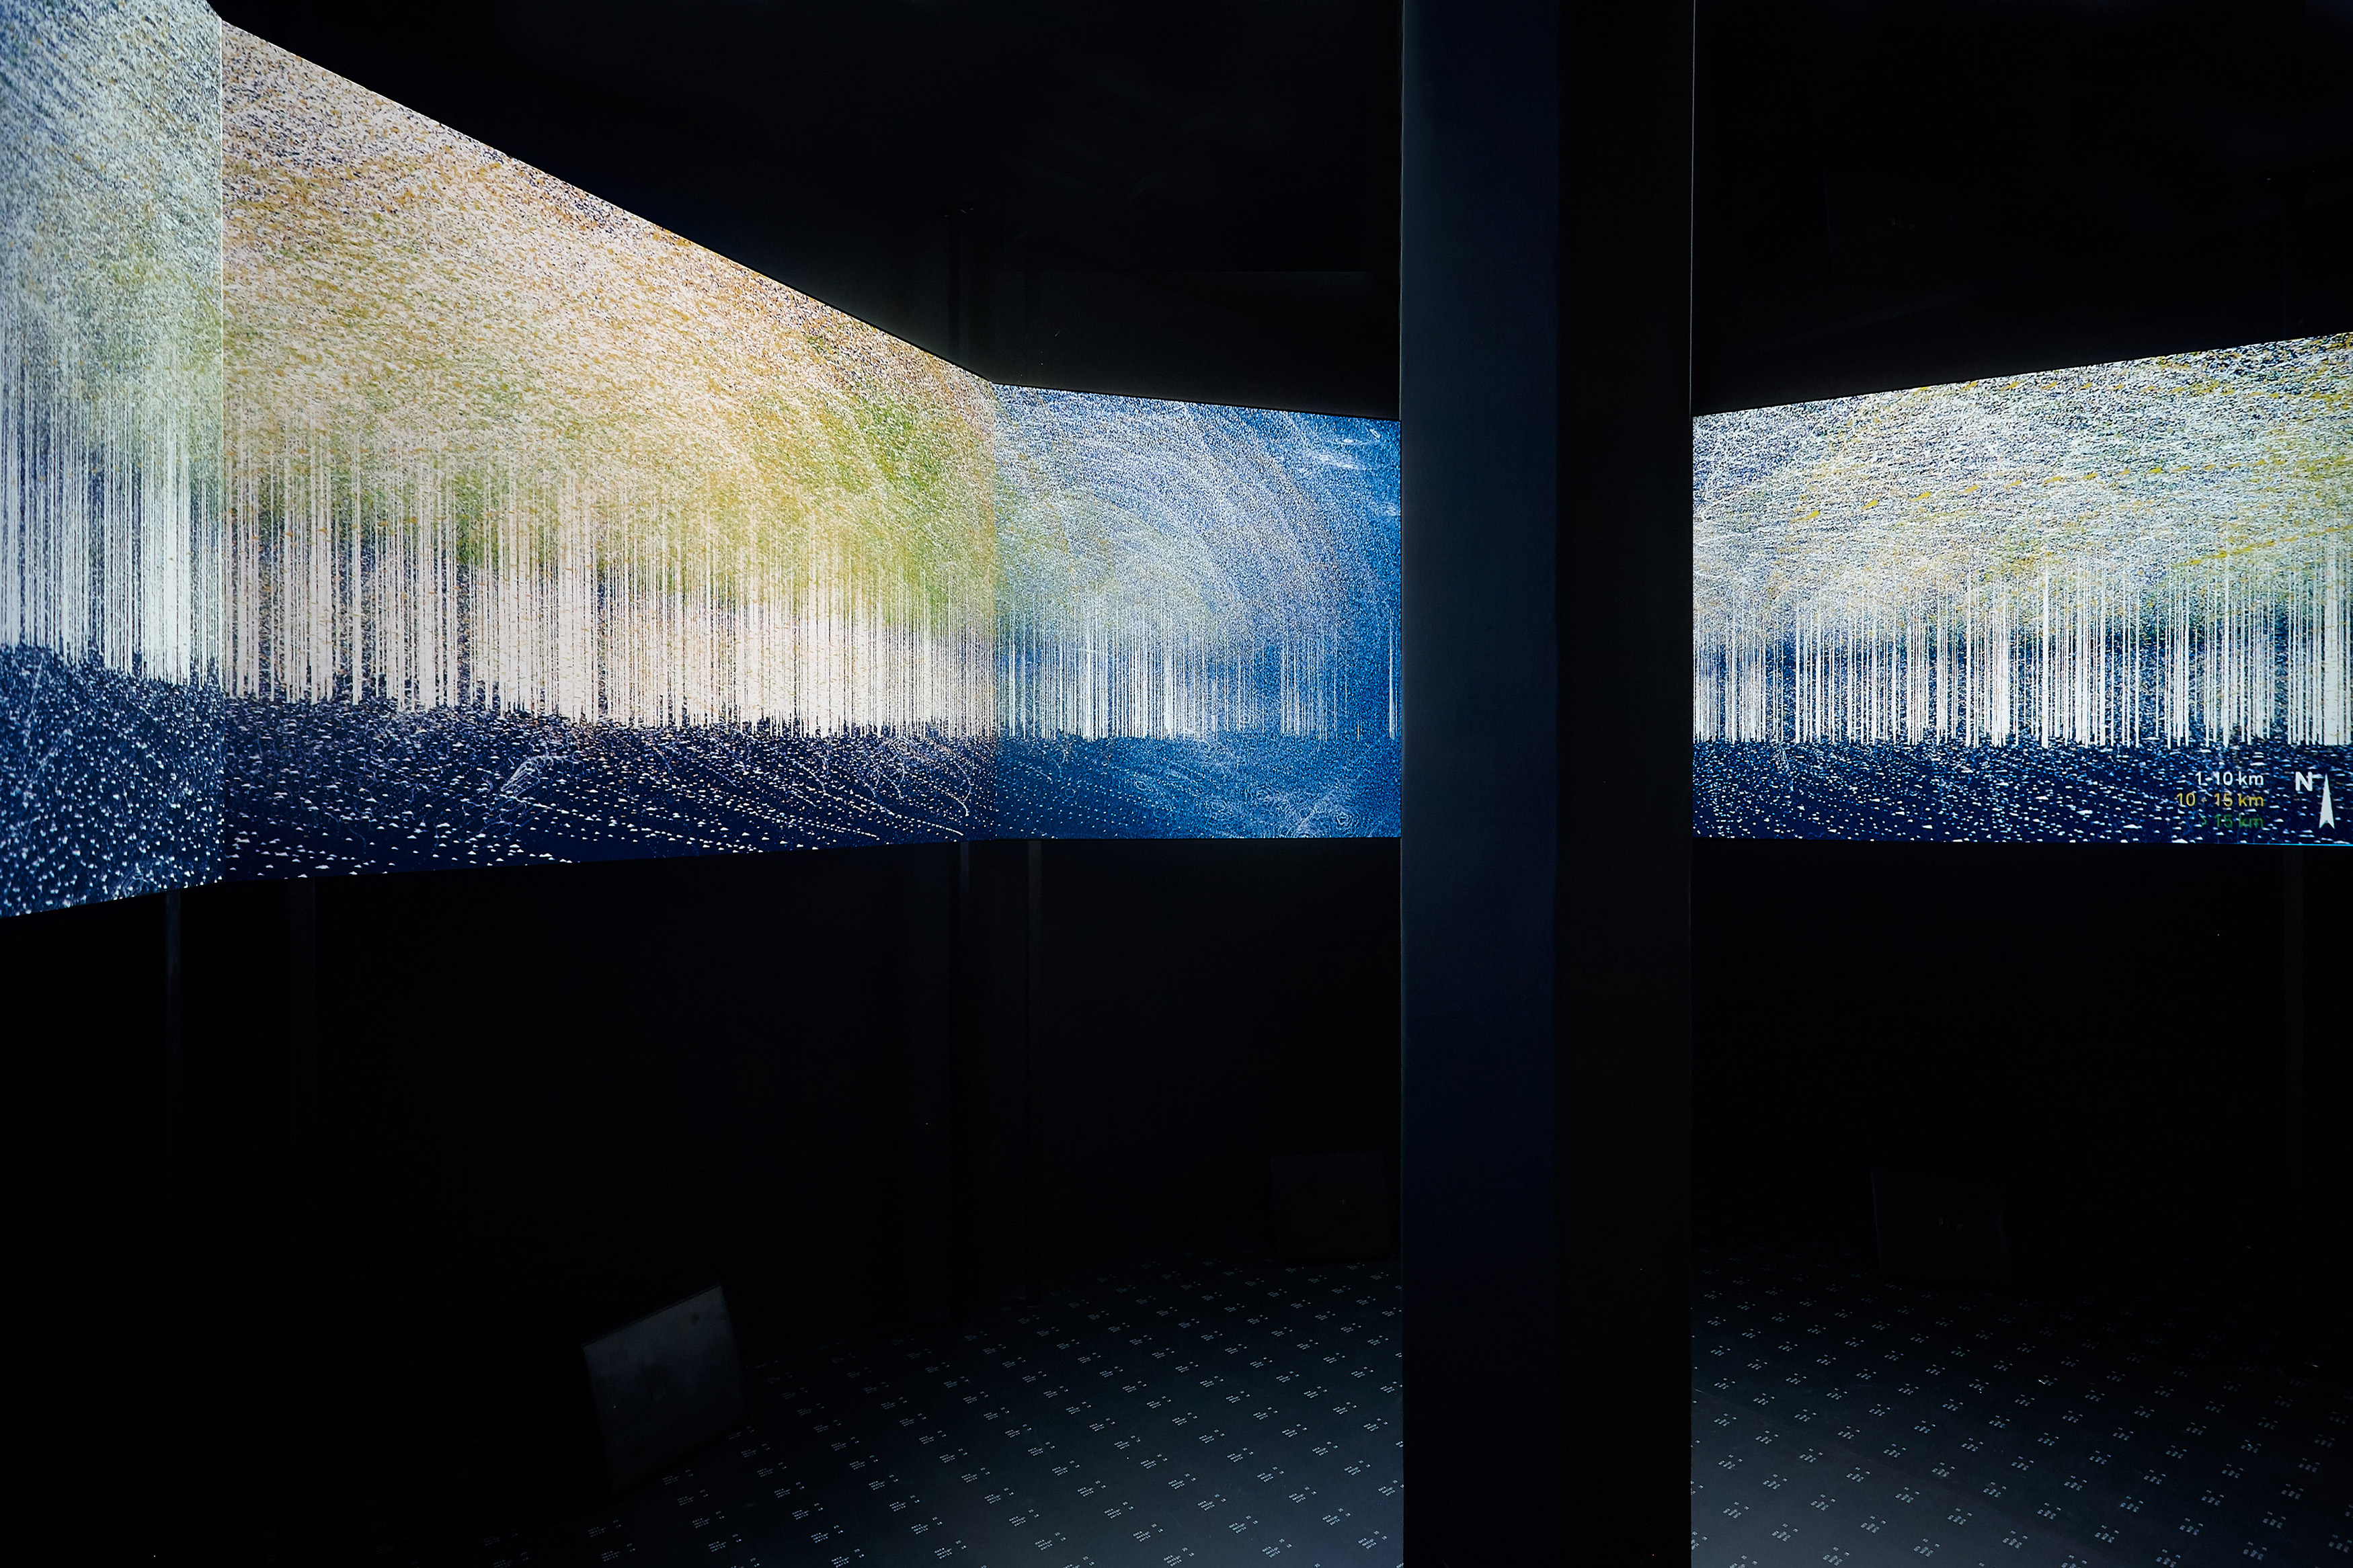
Photos: Laurent Lecat.
Video
Video: Damien Bourniquel | Post-production: David Bihanic.
Media coverage
TV broadcast
TV report directed by Thomas Hervé for the program Télématin broadcast on France 2, June, 14, 2018. URL: www.youtube.com[…]
TV report directed by Fleur Baudon for the program La Matinale LCI Week-End (spécial “coup de coeur”) broadcast on LCI, June, 7, 2018. URL (replay):
www.expointhecity.com[…]
TV report broadcast on TV5 Monde, June, 14, 2018. URL: tv5monde.com[…]
TV report broadcast on ViàGrandParis, May, 15, 2018: viagrandparis.tv[…]
TV report broadcast on Hub Institute, September, 12, 2018: hubinstitute.com[…]
TV report broadcast on Fine Life TV, 2018: vimeo
Radio broadcast
Invited to take part in the radio program (directed by David Abiker) entitled “C’est arrivé cette semaine” broadcast on Europe 1, May, 12, 2018. URL (podcast): www.europe1.fr[…]
Interview with Hélène Chevallier for the radio program entitled “C’est déjà demain” broadcast on FranceInter, May, 7, 2018. URL (podcast): www.franceinter.fr[…]
Interview with Florence Dauly broadcast on Radio Campus Paris, May, 23, 2018. URL (podcast): www.radiocampusparis.org[…]
Printing/online press
Inteview with Julie Ackermann, Art and Big Data: how to represent the data deluge?, “Art et Big Data : comment représenter la déferlante des données ?”, Interview published in Les Inrockuptibles magazine, June, 12, 2018. URL: www.lesinrocks.com[…]
Nicolas Thely, Données à voir et à penser – à propos de 1, 2, 3 Data, Article published in AOC journal, June, 1, 2018. URL: aoc.media[…]
Thierry Voisin, A la Fondation EDF, l’effrayante réalité des ondes magnétiques, Article published in Télérama magazine, May, 17, 2018. URL:
www.telerama.fr[…]
Emeline Collet, Expo gratuite à Paris : sous la data, l’œuvre d’art, Article published in Le Parisien Journal, May, 7, 2018. URL:
www.leparisien.fr[…]
Marie-Armelle Christien, 1.2.3 data, la première exposition française sur le data design, Article published in Intramuros magazine, June, 6, 2018. URL: intramuros.fr[…]
Marie-Armelle Christien, Les data : nouvelle tendance du design?, Article published in Intramuros magazine, June, 6, 2018. URL: intramuros.fr[…]
Paris Exhibition Explores Data Visualization, Article published in ParisVoice website. URL: parisvoice.com[…]
Les data investissent la Fondation EDF, Article published in Tema Archi magazine, May, 31, 2018. URL: tema.archi[…]
Article published in Paris Art newspaper. URL: www.paris-art.com[…]
1, 2, 3 DATA à la fondation EDF, Article published in Sortir à Paris newpaper, May, 2, 2018. URL: www.sortiraparis.com[…]
Exposition 1,2,3 data, Article published in MaCité-U newspaper, May, 3, 2018. URL: www.macite-u.com[…]
1,2,3 data, Article published in Que Faire à Paris journal (The City Hall of Paris). URL: quefaire.paris.fr[…]
1,2,3 Data | Exposition collective, Article published in Arts Hebdo Medias journal. URL: artshebdomedias.com[…]
Alexia Malige, 1,2,3 data à la Fondation EDF, Article published in À Nous Paris journal, May, 3, 2018. URL: www.anousparis.fr[…]
Christophe Bys, 123 data à l’espace EDF, ou quand la data devient la glaise de l’artiste 2.0, Article published in Usine Nouvelle journal, May, 12, 2018. URL: www.usinenouvelle.com[…]
Patrice Huchet, De la data à l’œuvre d’art. 123 Data, première exposition sur le data-graphisme, Article published in Mowwgli magazine, May, 22, 2018. URL: www.mowwgli.com[…]
« 1, 2, 3 Data » : la fondation EDF expose les données comme forme, Article published in Eduscol (the Ministry of National Education). URL:
eduscol.education.fr[…]
Exposition 1,2,3 data, Article published in Up-Magazine, June, 14, 2018. URL: www.up-magazine.info[…]
Jean Marc Lebeaupin, 1,2,3 data, Article published in ArtSixMic magazine, June, 17, 2018. www.artsixmic.fr[…]
Julie Ackermann, Les 5 expos gratuites à ne pas manquer en juin à Paris, Article published in Beaux Arts magazine, June, 8, 2018. URL: www.beauxarts.com[…]
Exposition 1,2,3 data, Article published in Decryptageo journal, April, 20, 2018. URL:
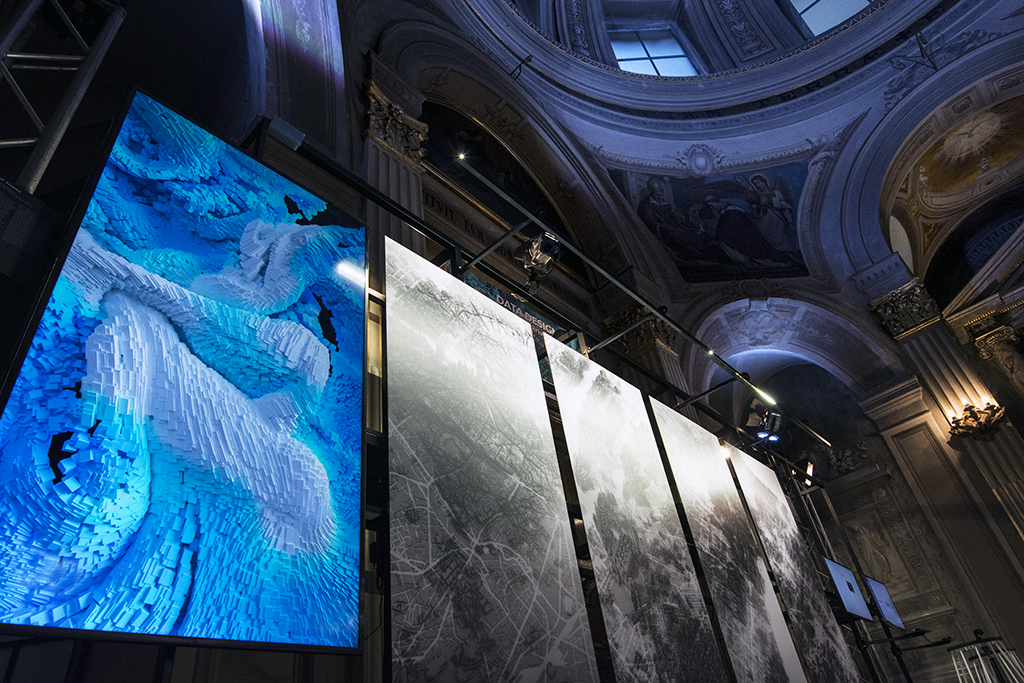
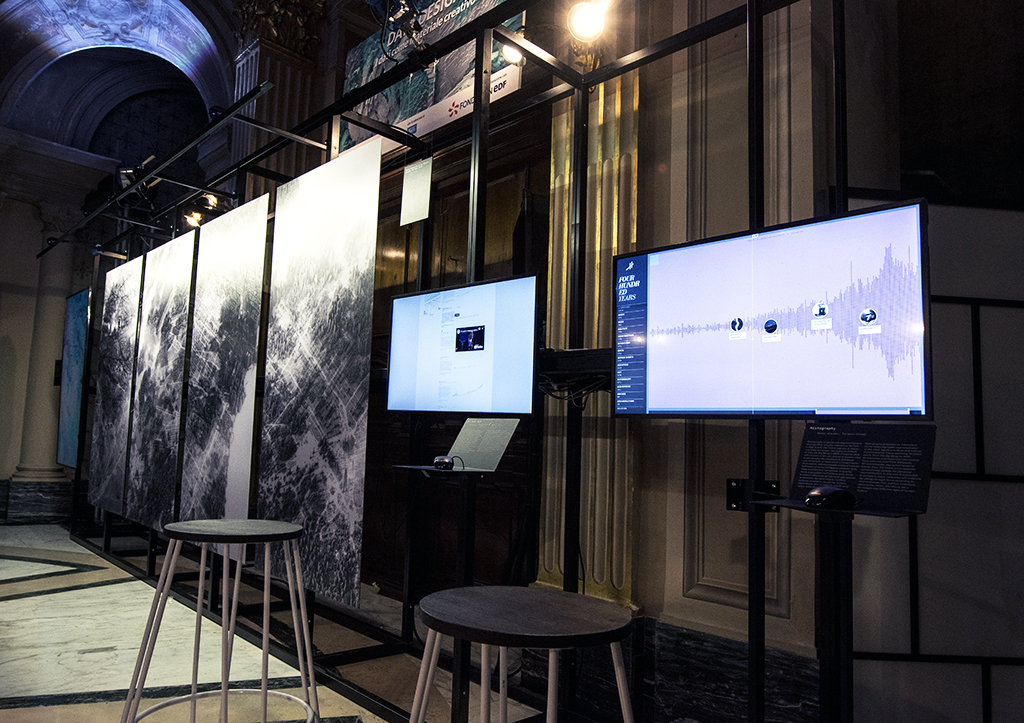
[Exhibition] “1, 2, 3 data” touring exhibition — first stage: Rome (Italy)
Organized in collaboration with Edison Spa and l’Institut Français” (the French Institute), this exhibition occupies a splendid Chapel during Four months (from december 2018 to march 2019) — Edison Spa, Via del Quirinale, 26, 00187 Roma
In italian: Data Design, I dati come materiale creativo
Viviamo in un’epoca dominata da un’inflazione esponenziale di dati prodotti, generati e scambiati con mezzi informatici : il volume mondiale complessivo sfiora i 5 zettabyte (10²¹), pari a 5 miliardi di teraoctet. Di fronte a tale abbondanza di informazioni, il design può giocare un ruolo fondamentale, da un lato per formalizzare ed esprimere visivamente queste quantità di dati e, dall’altro, per capire quali potrebbero essere i nuovi orientamenti e le nuove finalità di impiego o utilizzo. Per riuscire in questa duplice sfida, il design si dedica alla creazione di formati grafici originali, funzionali a rappresentare l’universo dei dati e a tradurre le loro variazioni volumetriche su macro e micro scala. Completando e perfezionando i modelli di stampo “classico” che danno la precedenza alla semplice presentazione di dati, il design sviluppa veri e propri spazi di presentazione e rappresentazione, entro i quali si delinea una percezione sensoriale delle dinamiche di relazione tra i dati stessi. Conferendo forma, sostanza e direzione alle aggregazioni, congestioni, fluttuazioni e circolazioni di dati, il design riesce a far emergere il loro carattere immateriale e la loro immanente presenza. Proprio come una camera delle meraviglie, unendo l’inedito all’eclettico, la mostra è un invito a scoprire il nuovo potenziale dei dati, considerati da questo momento come un materiale di creazione : quali pratiche e approcci creativi utilizzano artisti e designer per rappresentare, visualizzare veri e propri ecosistemi relazionali complessi di dati ? Come riescono a svelare gli innumerevoli benefici e opportunità celati in questa pletora di octet – ma al tempo stesso a far luce sui pericoli di cui è necessario tener conto ? Pensata per raccontare il cosiddetto “Data Design” attraverso molteplici progetti e concretizzazioni (installazioni, animazioni, infografiche, visualizzazioni di dati, applicazioni, ecc.), il visitatore è invitato a partecipare attivamente al percorso — vengono affrontate le questioni e le tematiche sociali attuali : minacce ambientali o ecologiche, disuguaglianze, inquinamento acustico, protezione dei dati personali, e molti altri. — Forti del potenziale creativo dei dati, ci auguriamo che questo viaggio nella terra del digitale vi permetta di cogliere pienamente quanto ha da offrire il design per osservare e interpretare il mondo contemporaneo.
Photos in the exhibition space

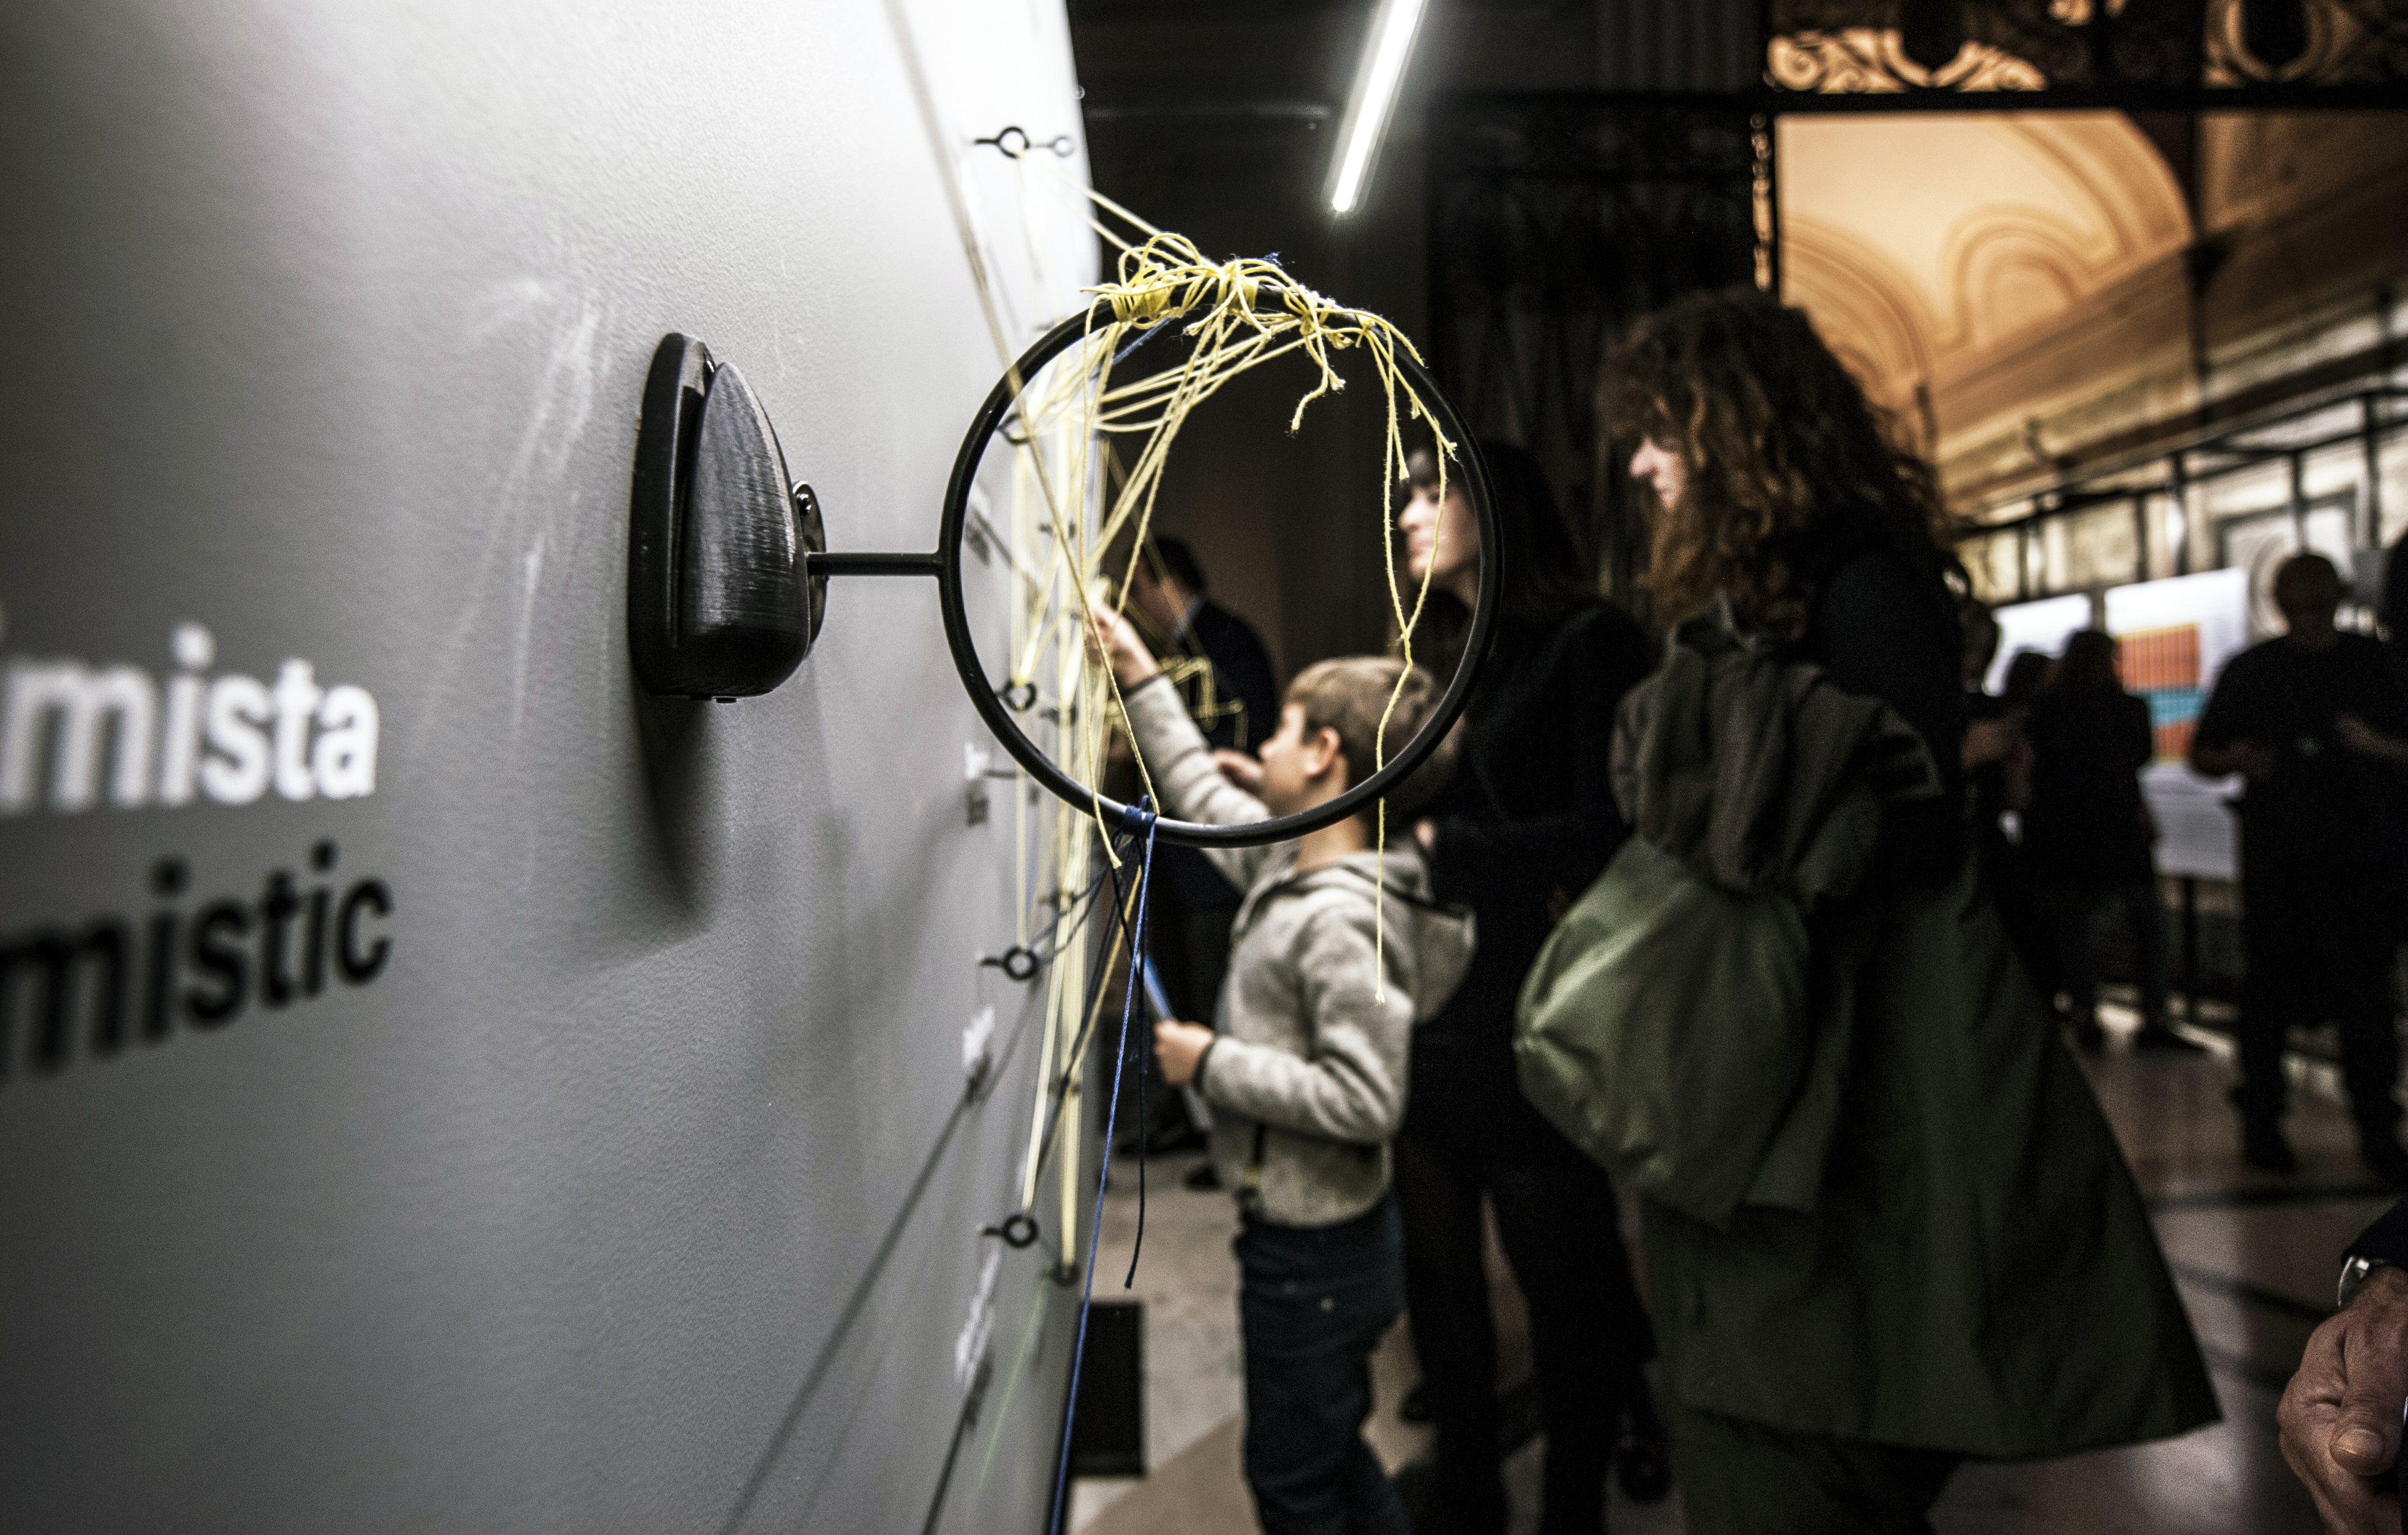

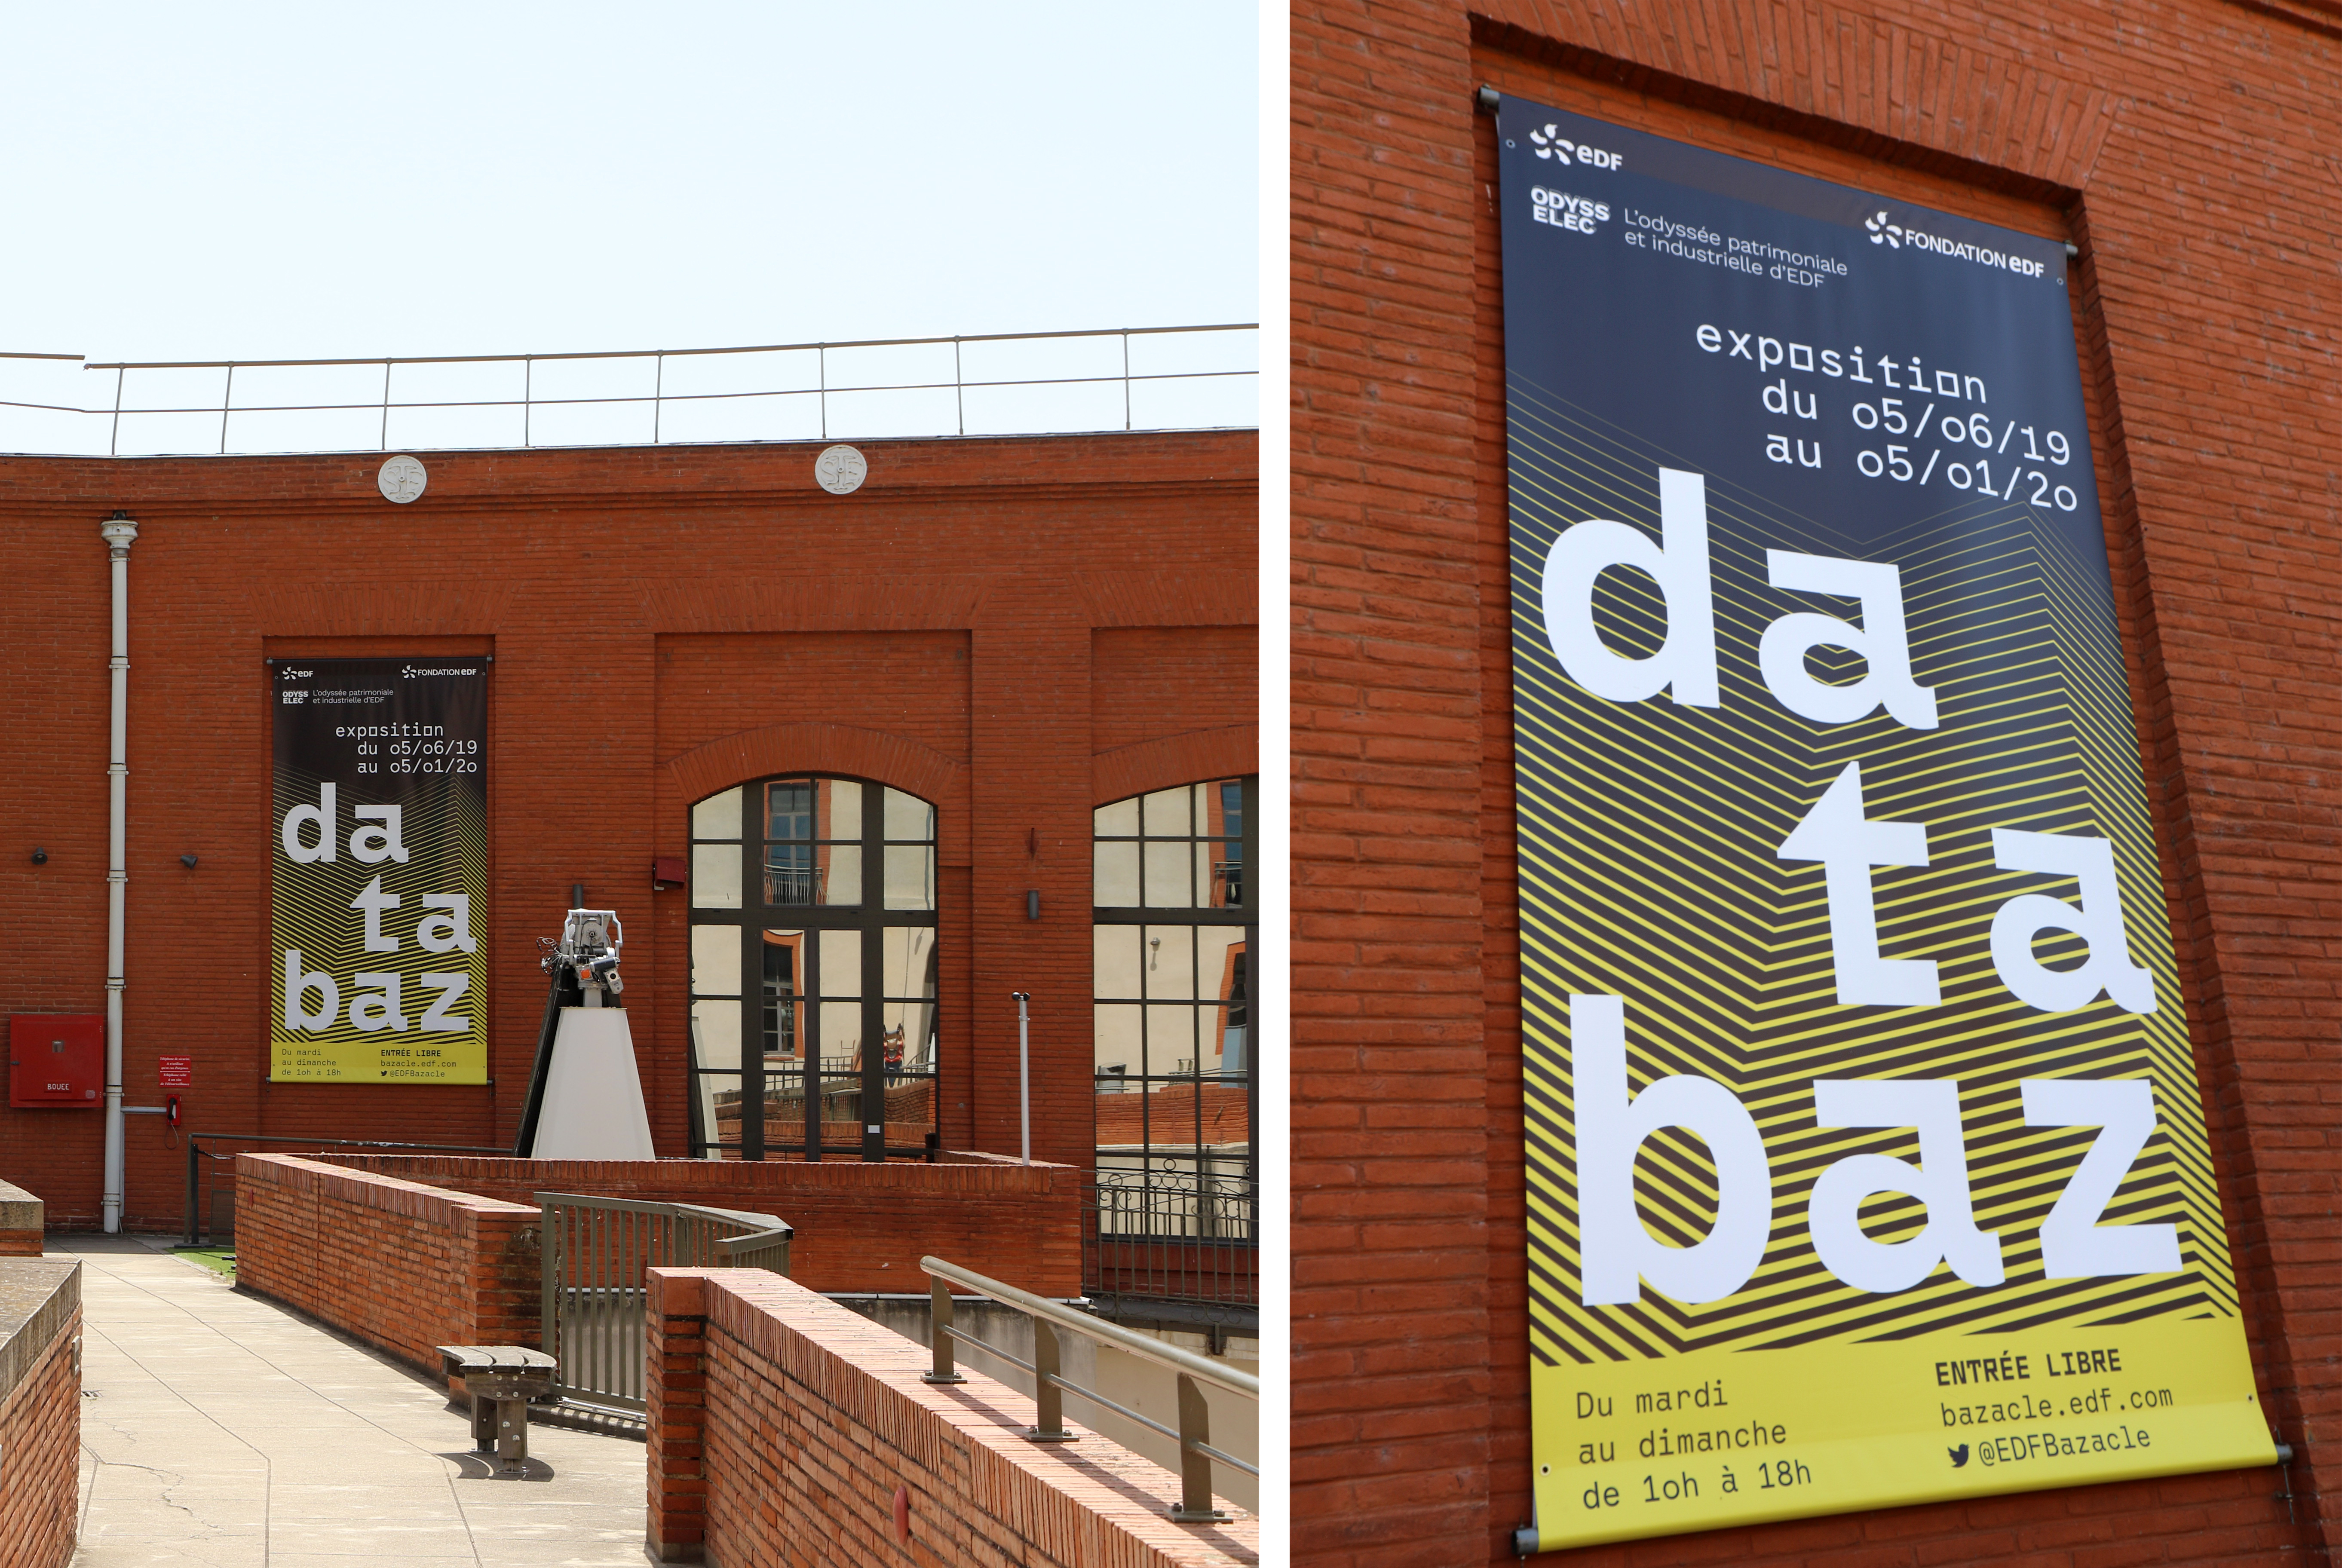
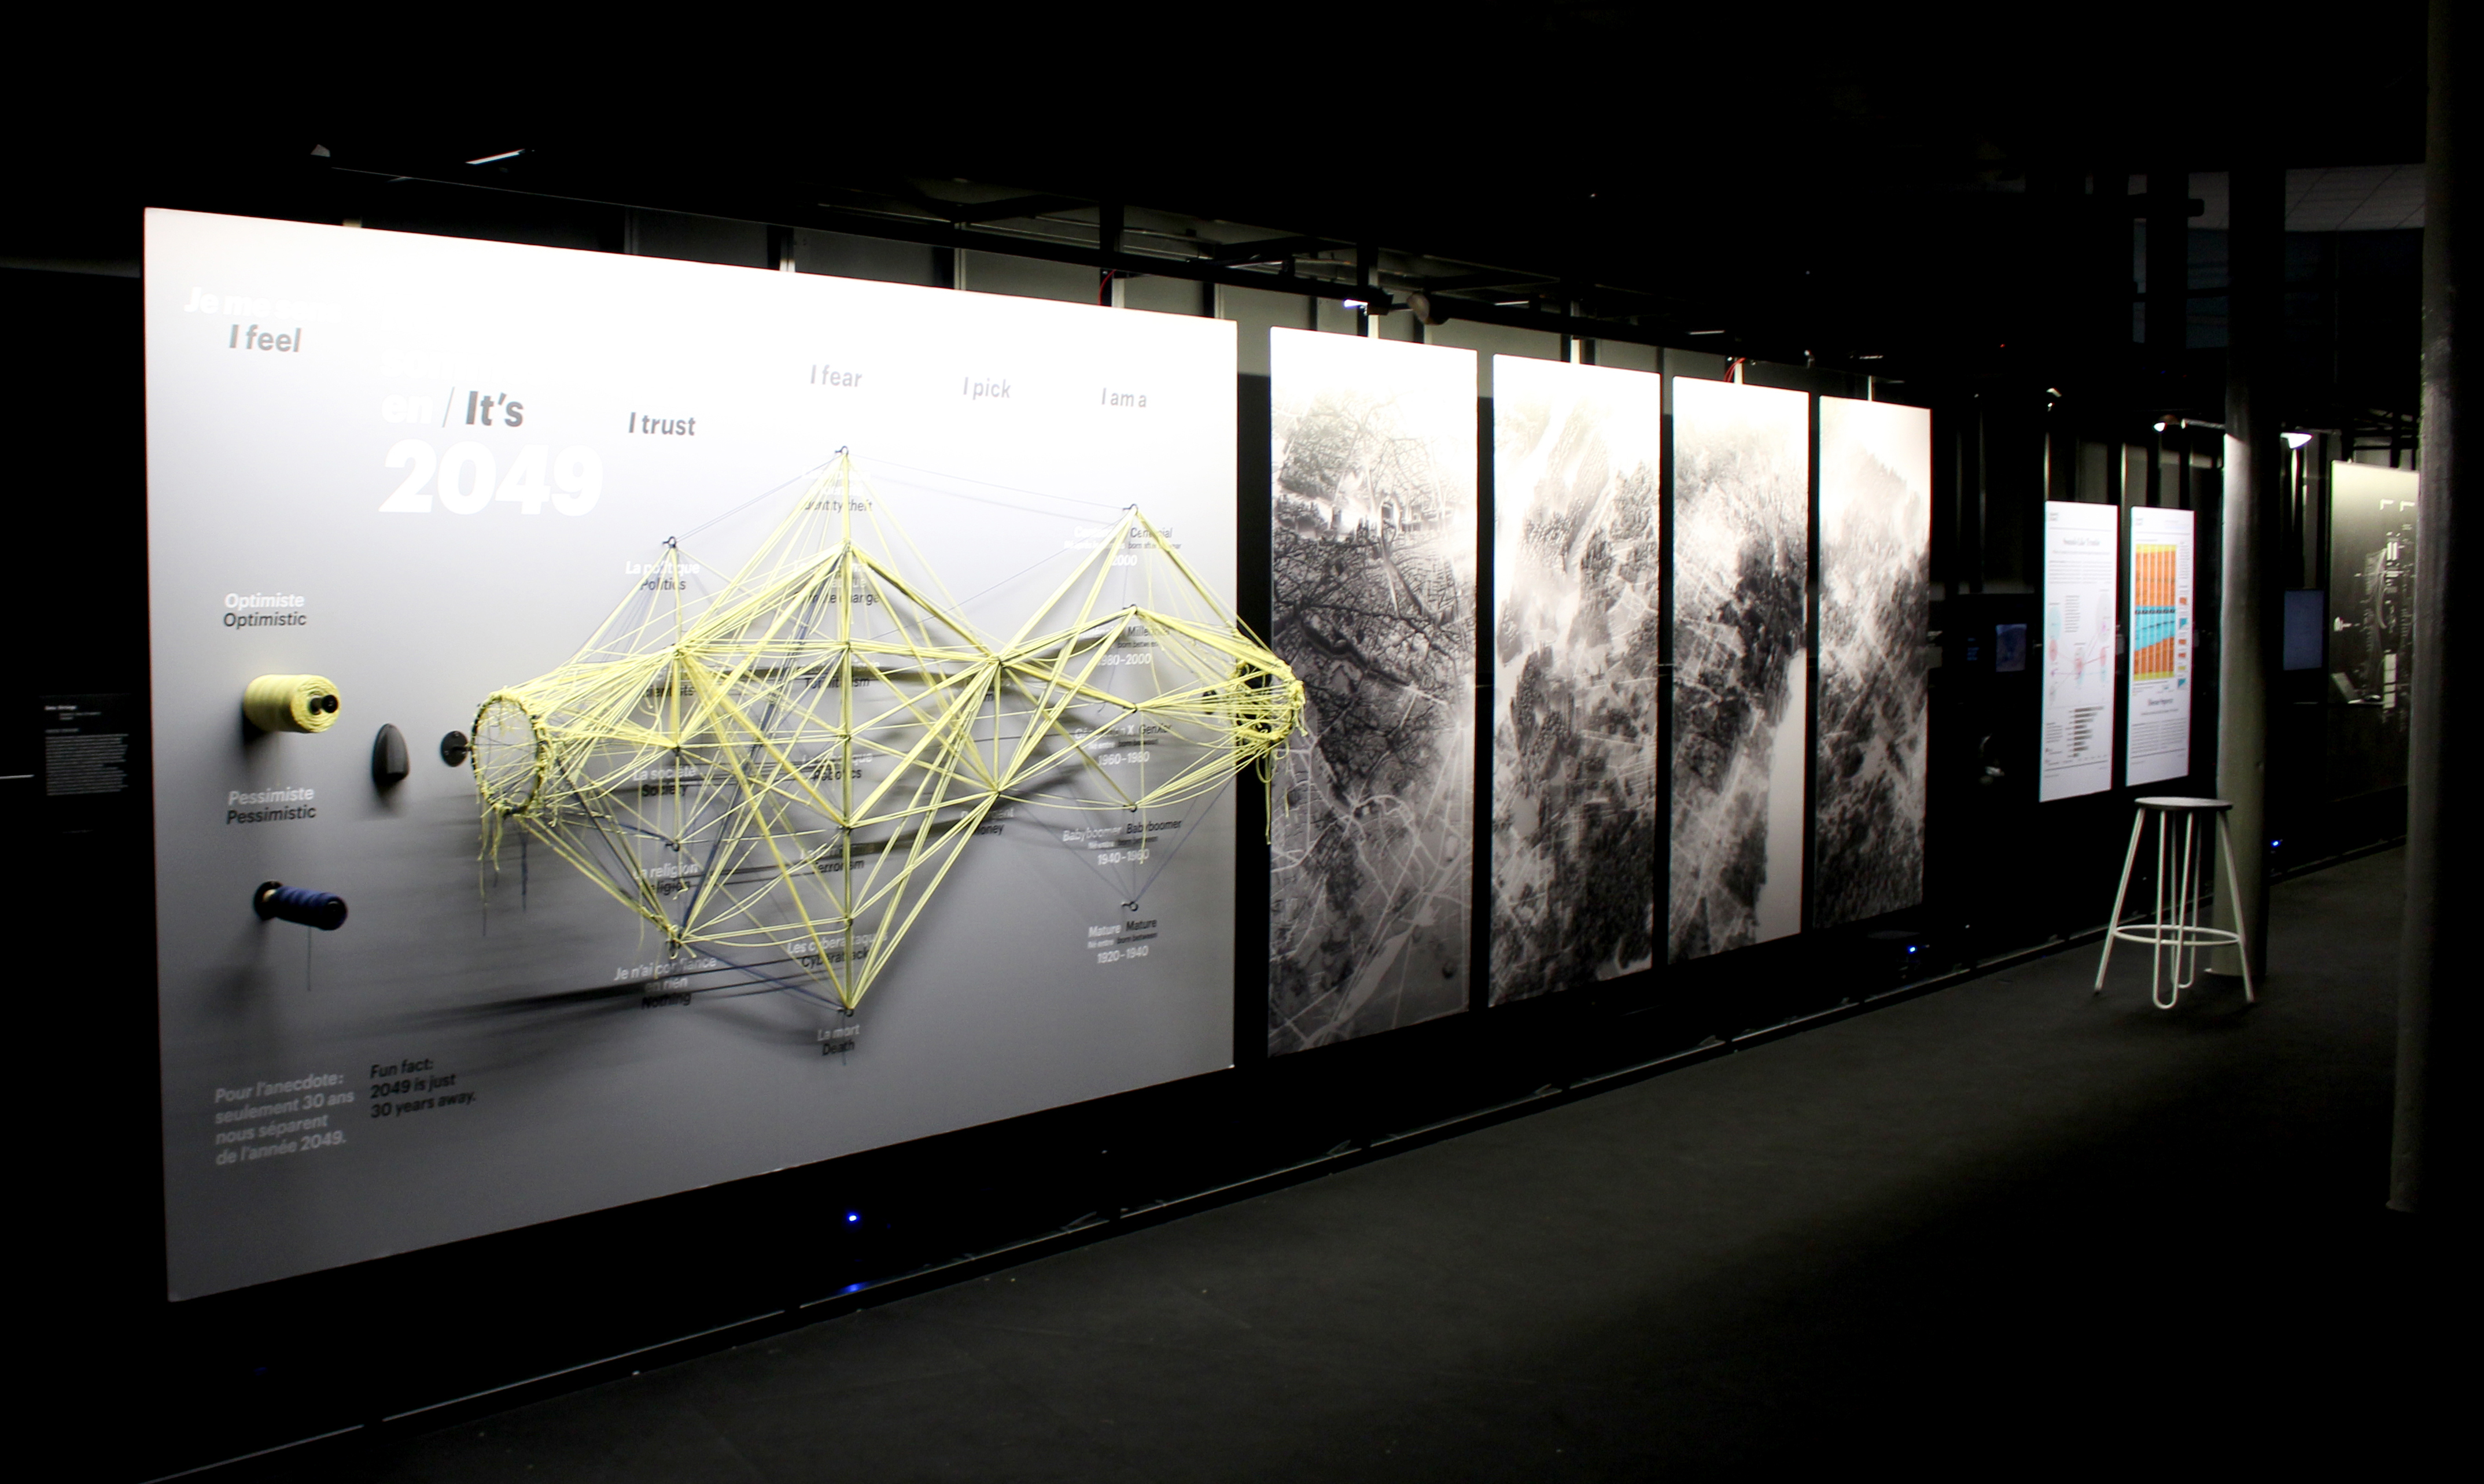
[Exhibition] “databaz” exhibition — second stage of the road show: Toulouse
Organized in collaboration with E&D Group (The Communication Direction), this exhibition occupies the great EDF Bazacle Complex of more than 400m2 (from june 2019 to january 2020) — 11 Quai Saint-Pierre, 31000 Toulouse. This exhbition includes the “Pushed Pulled” project designed and developped in collaboration with the Trafik studio
Video
Video reports
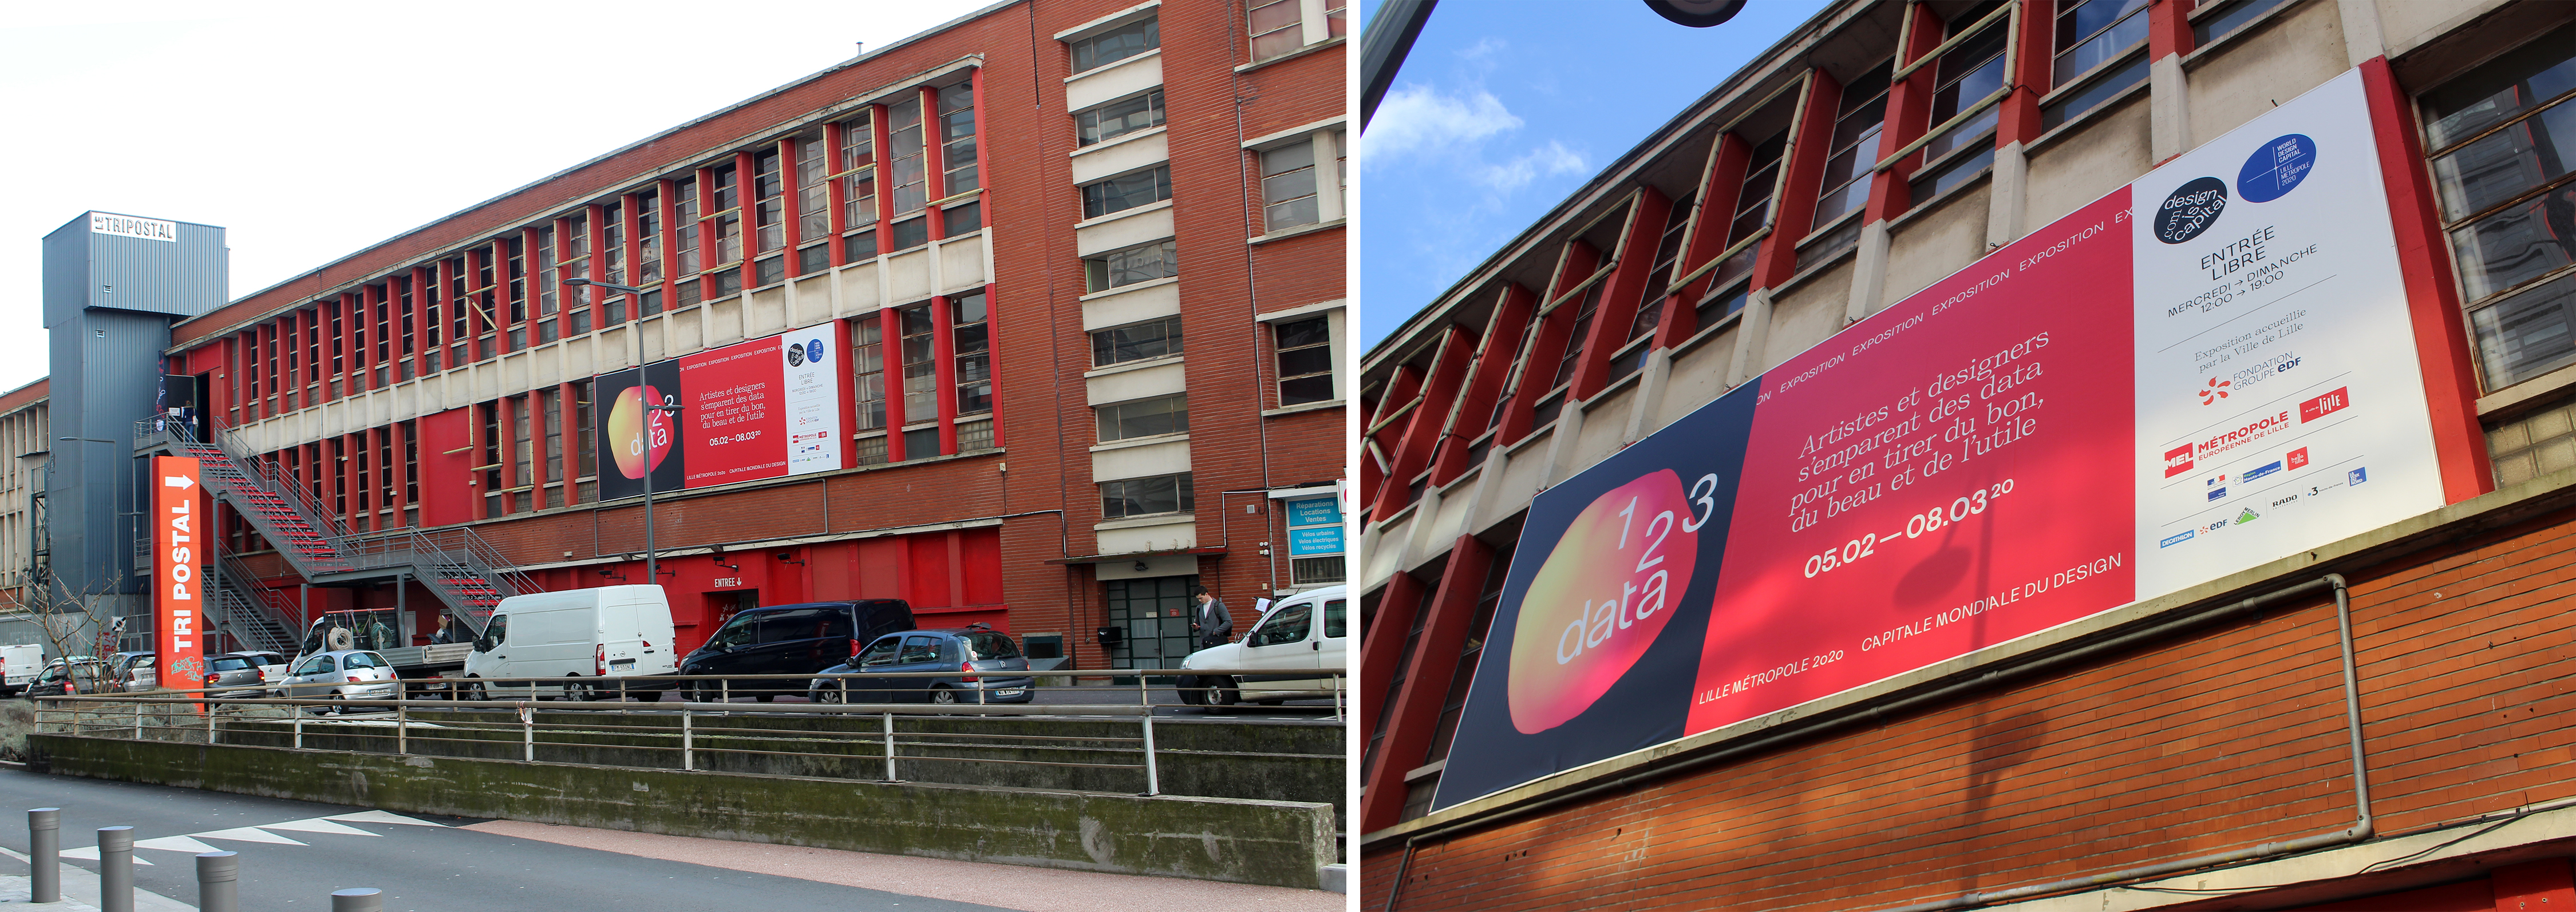
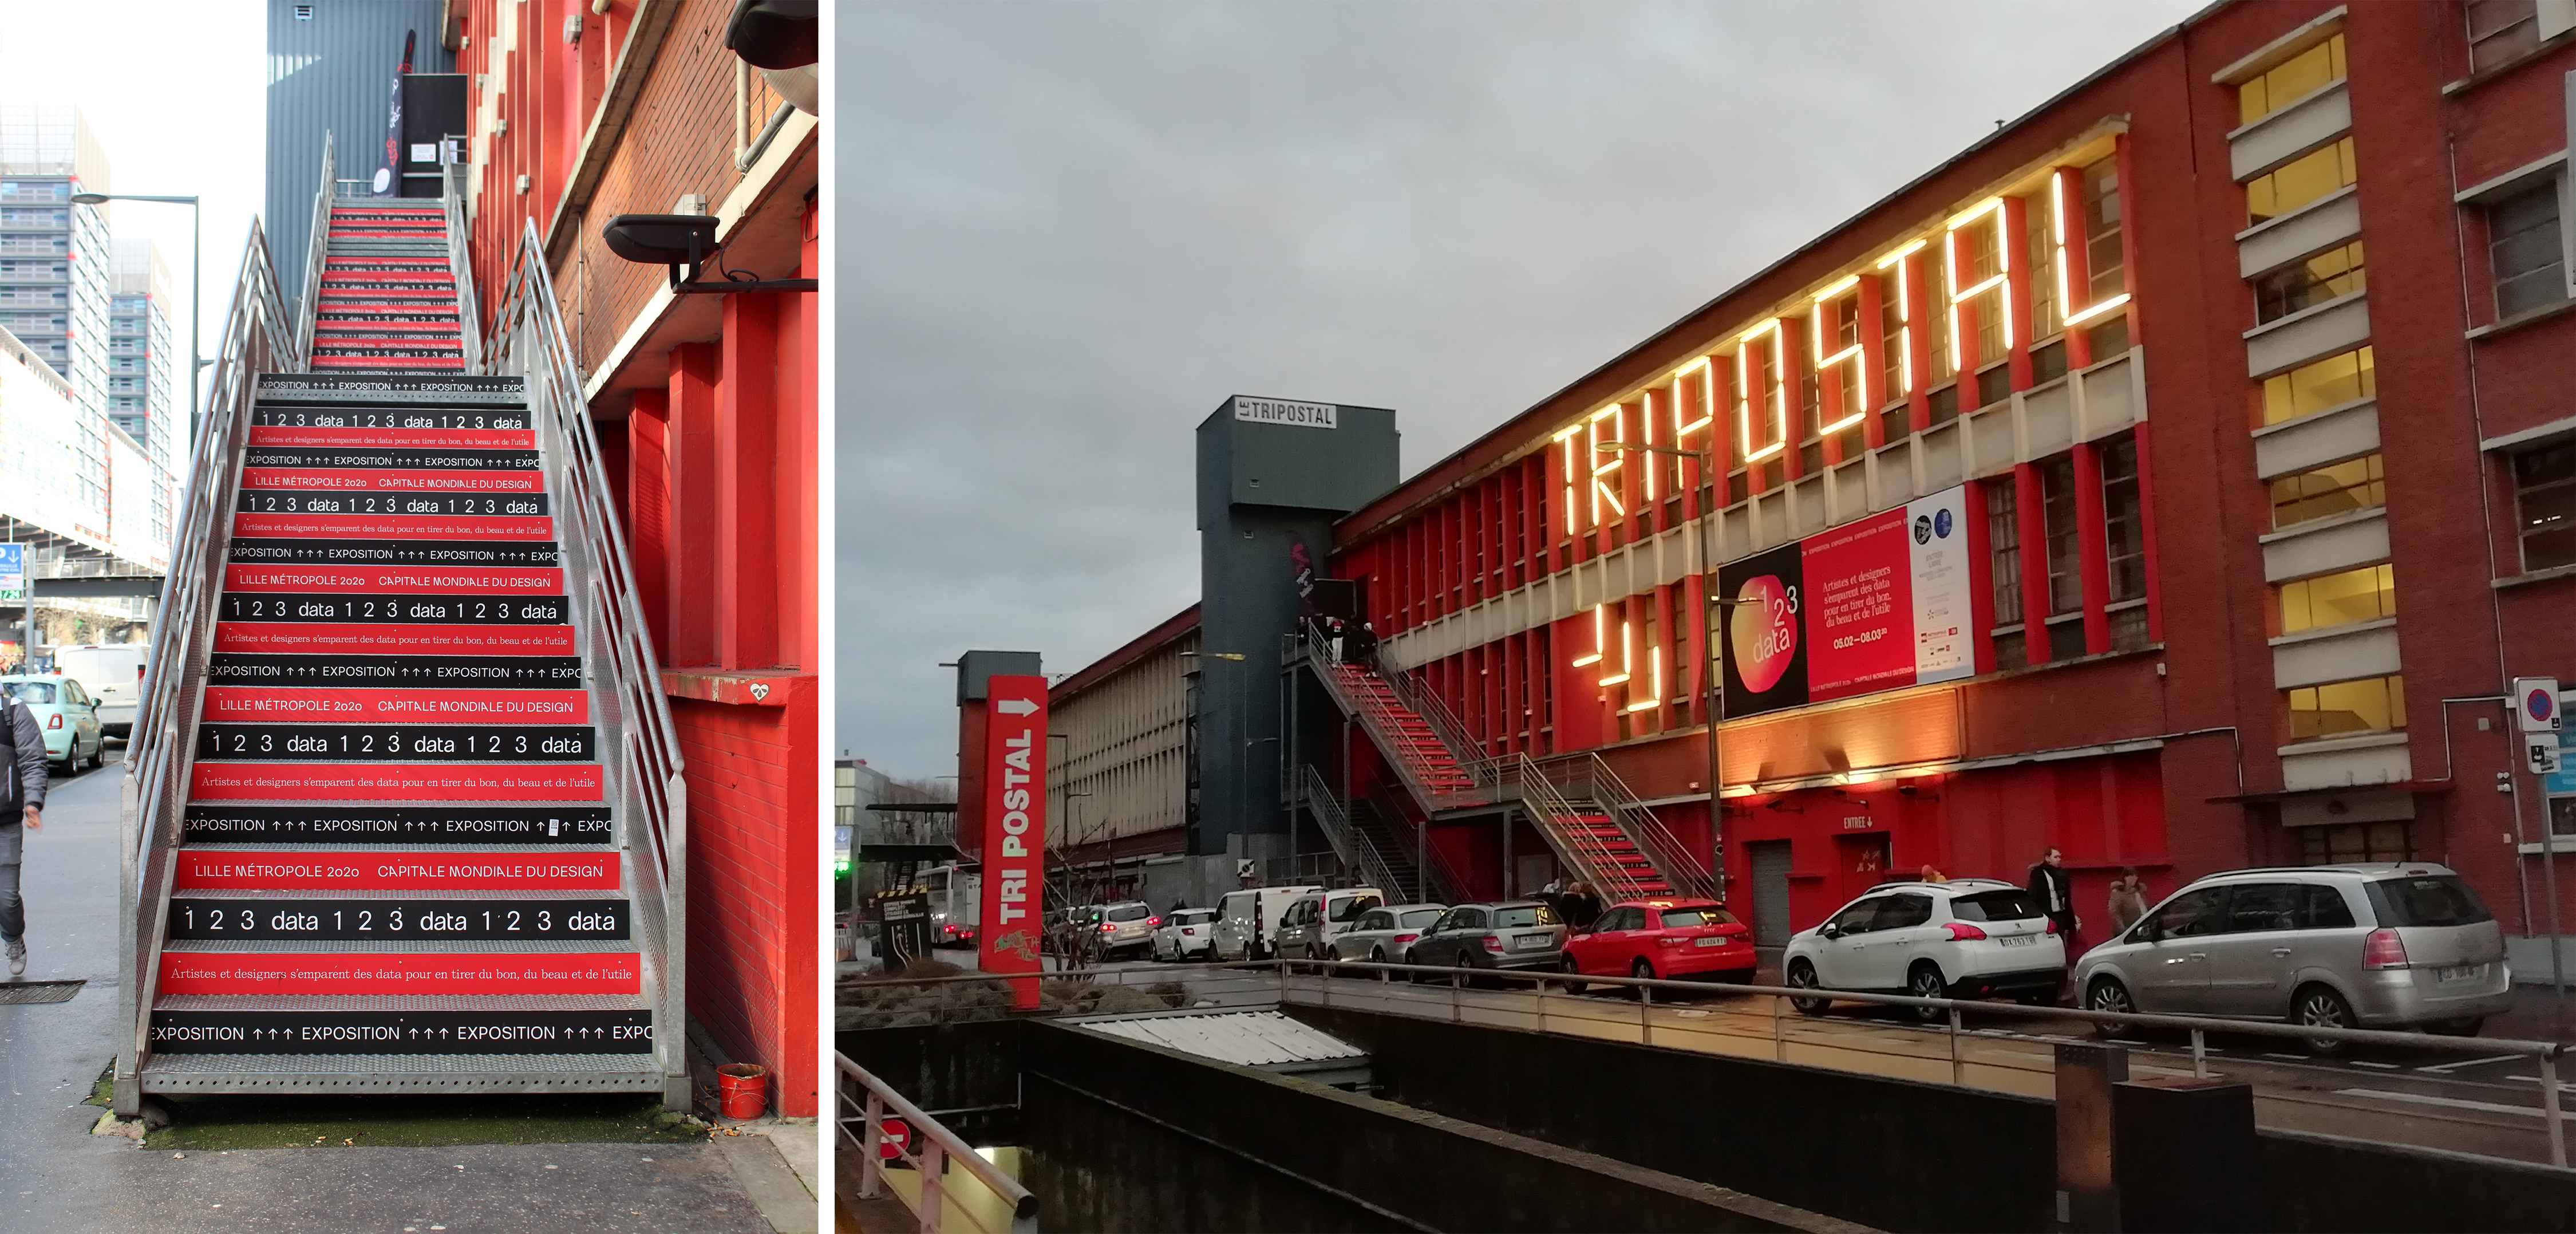
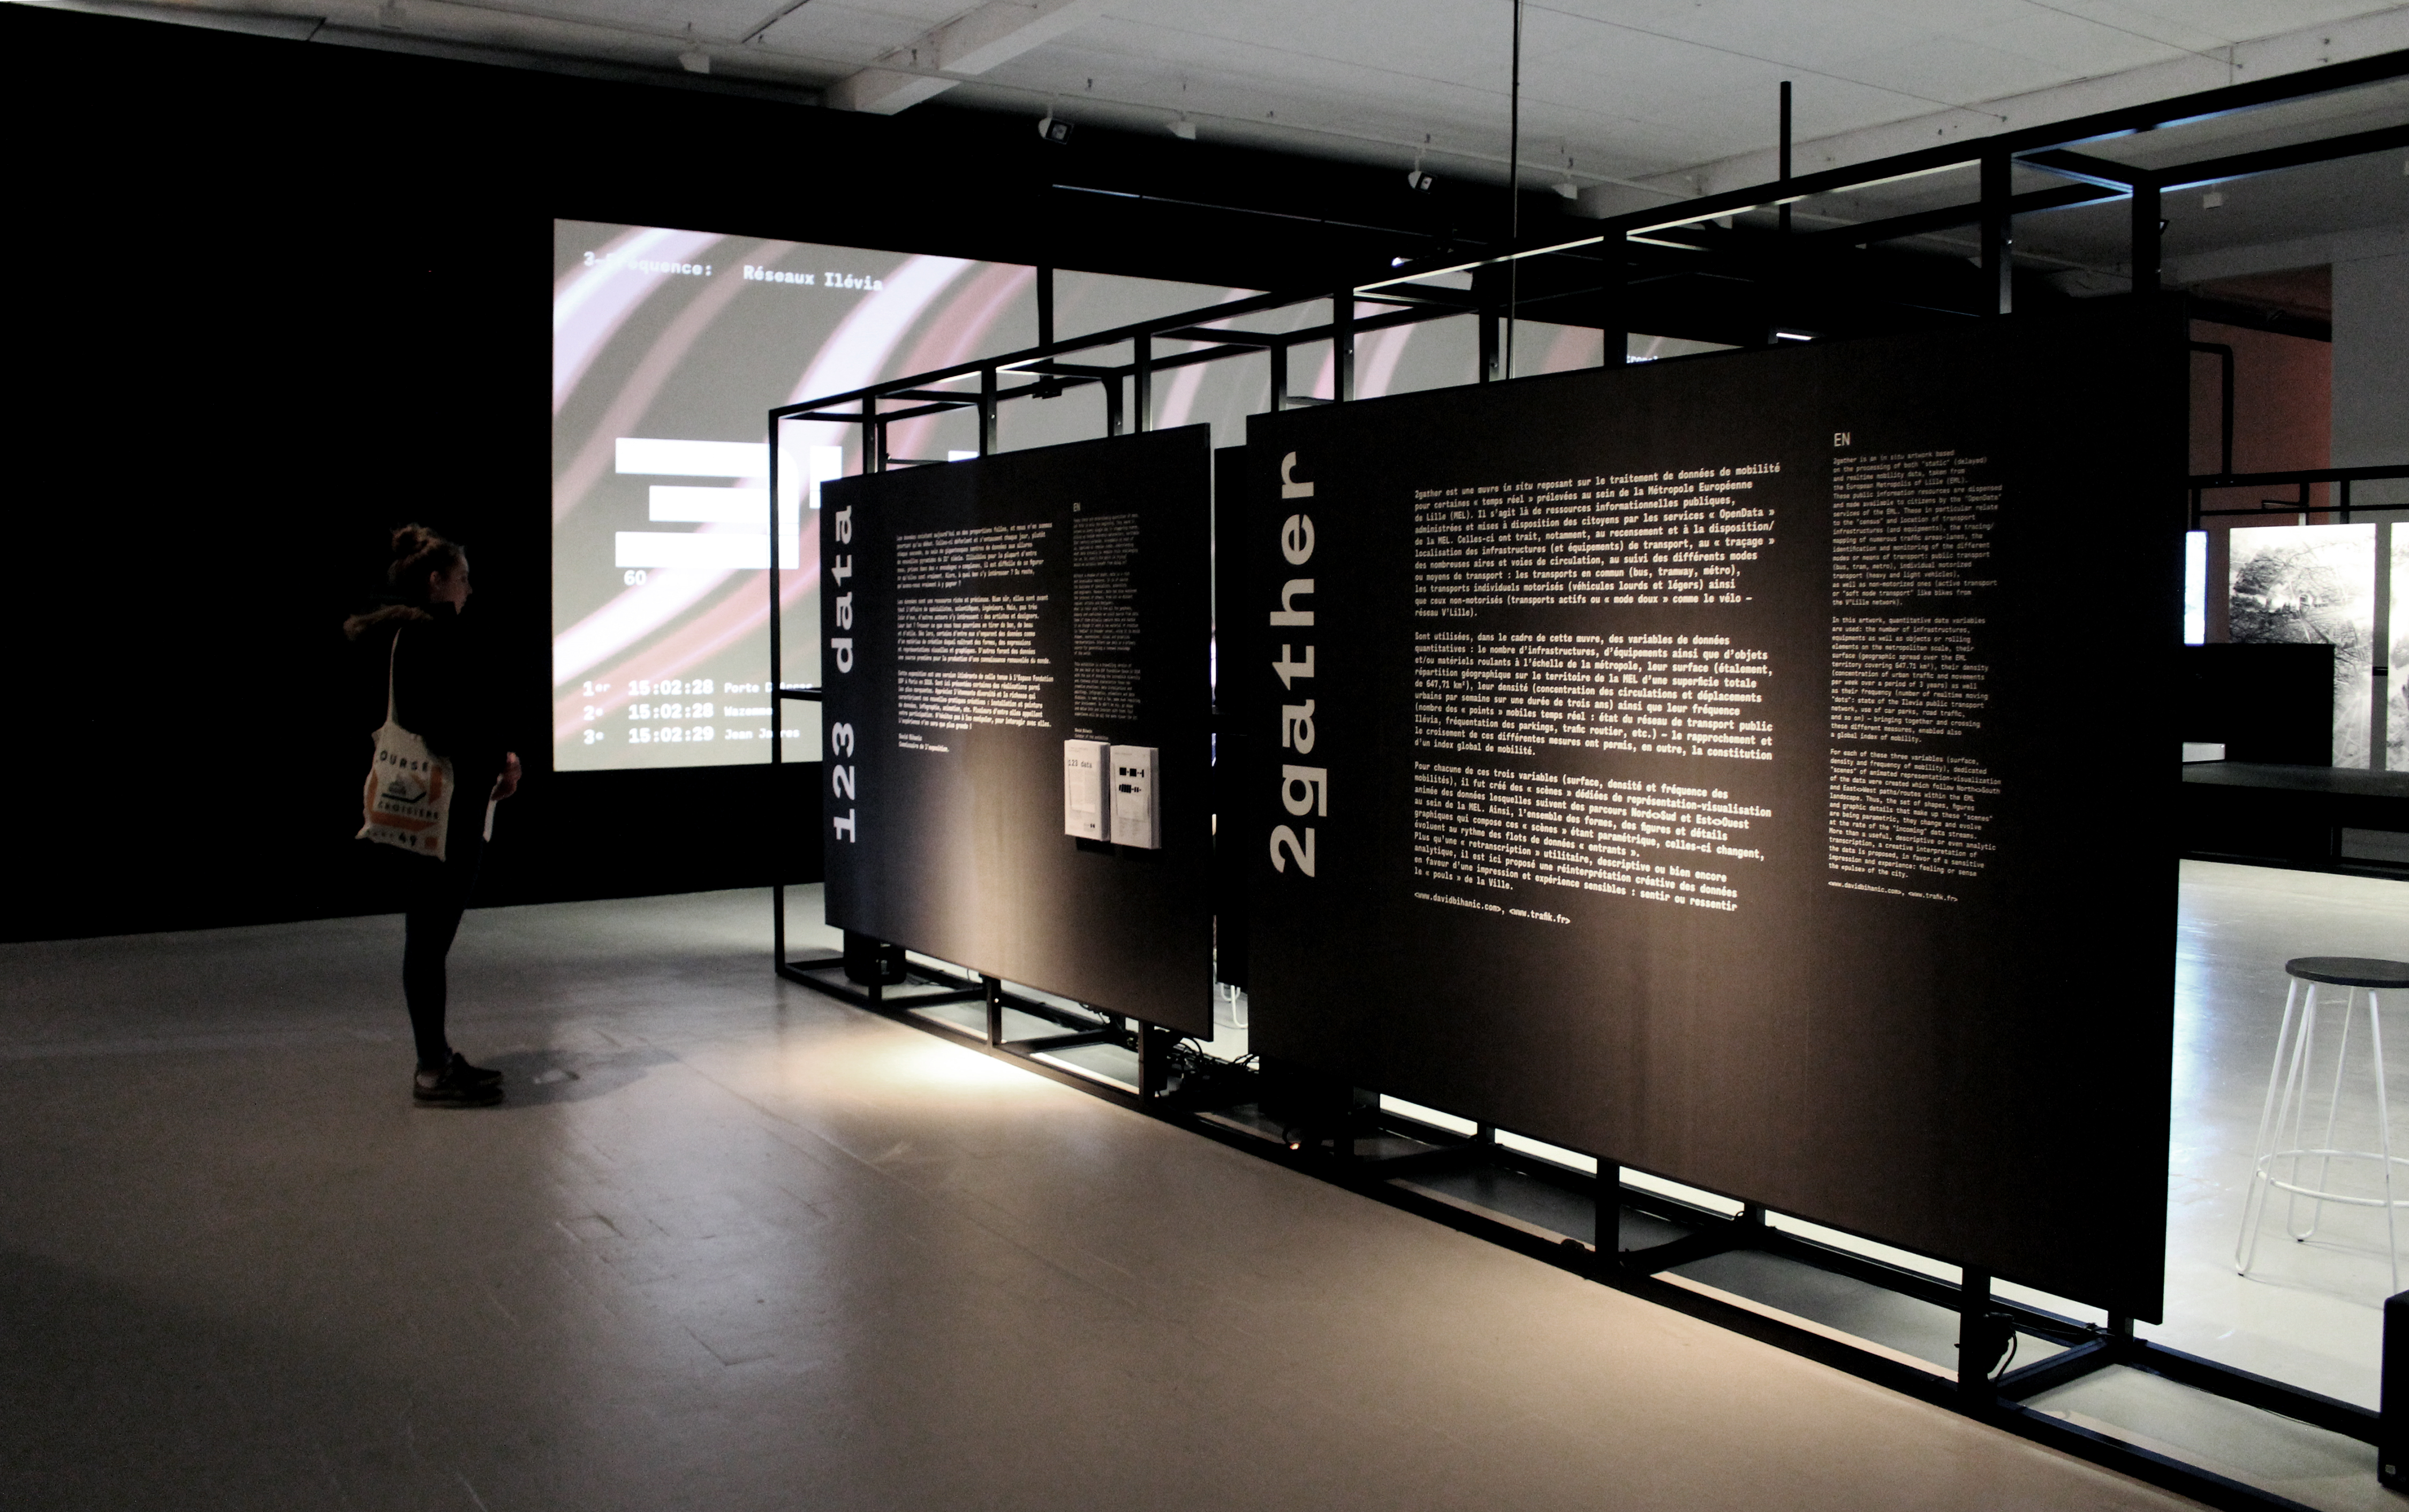
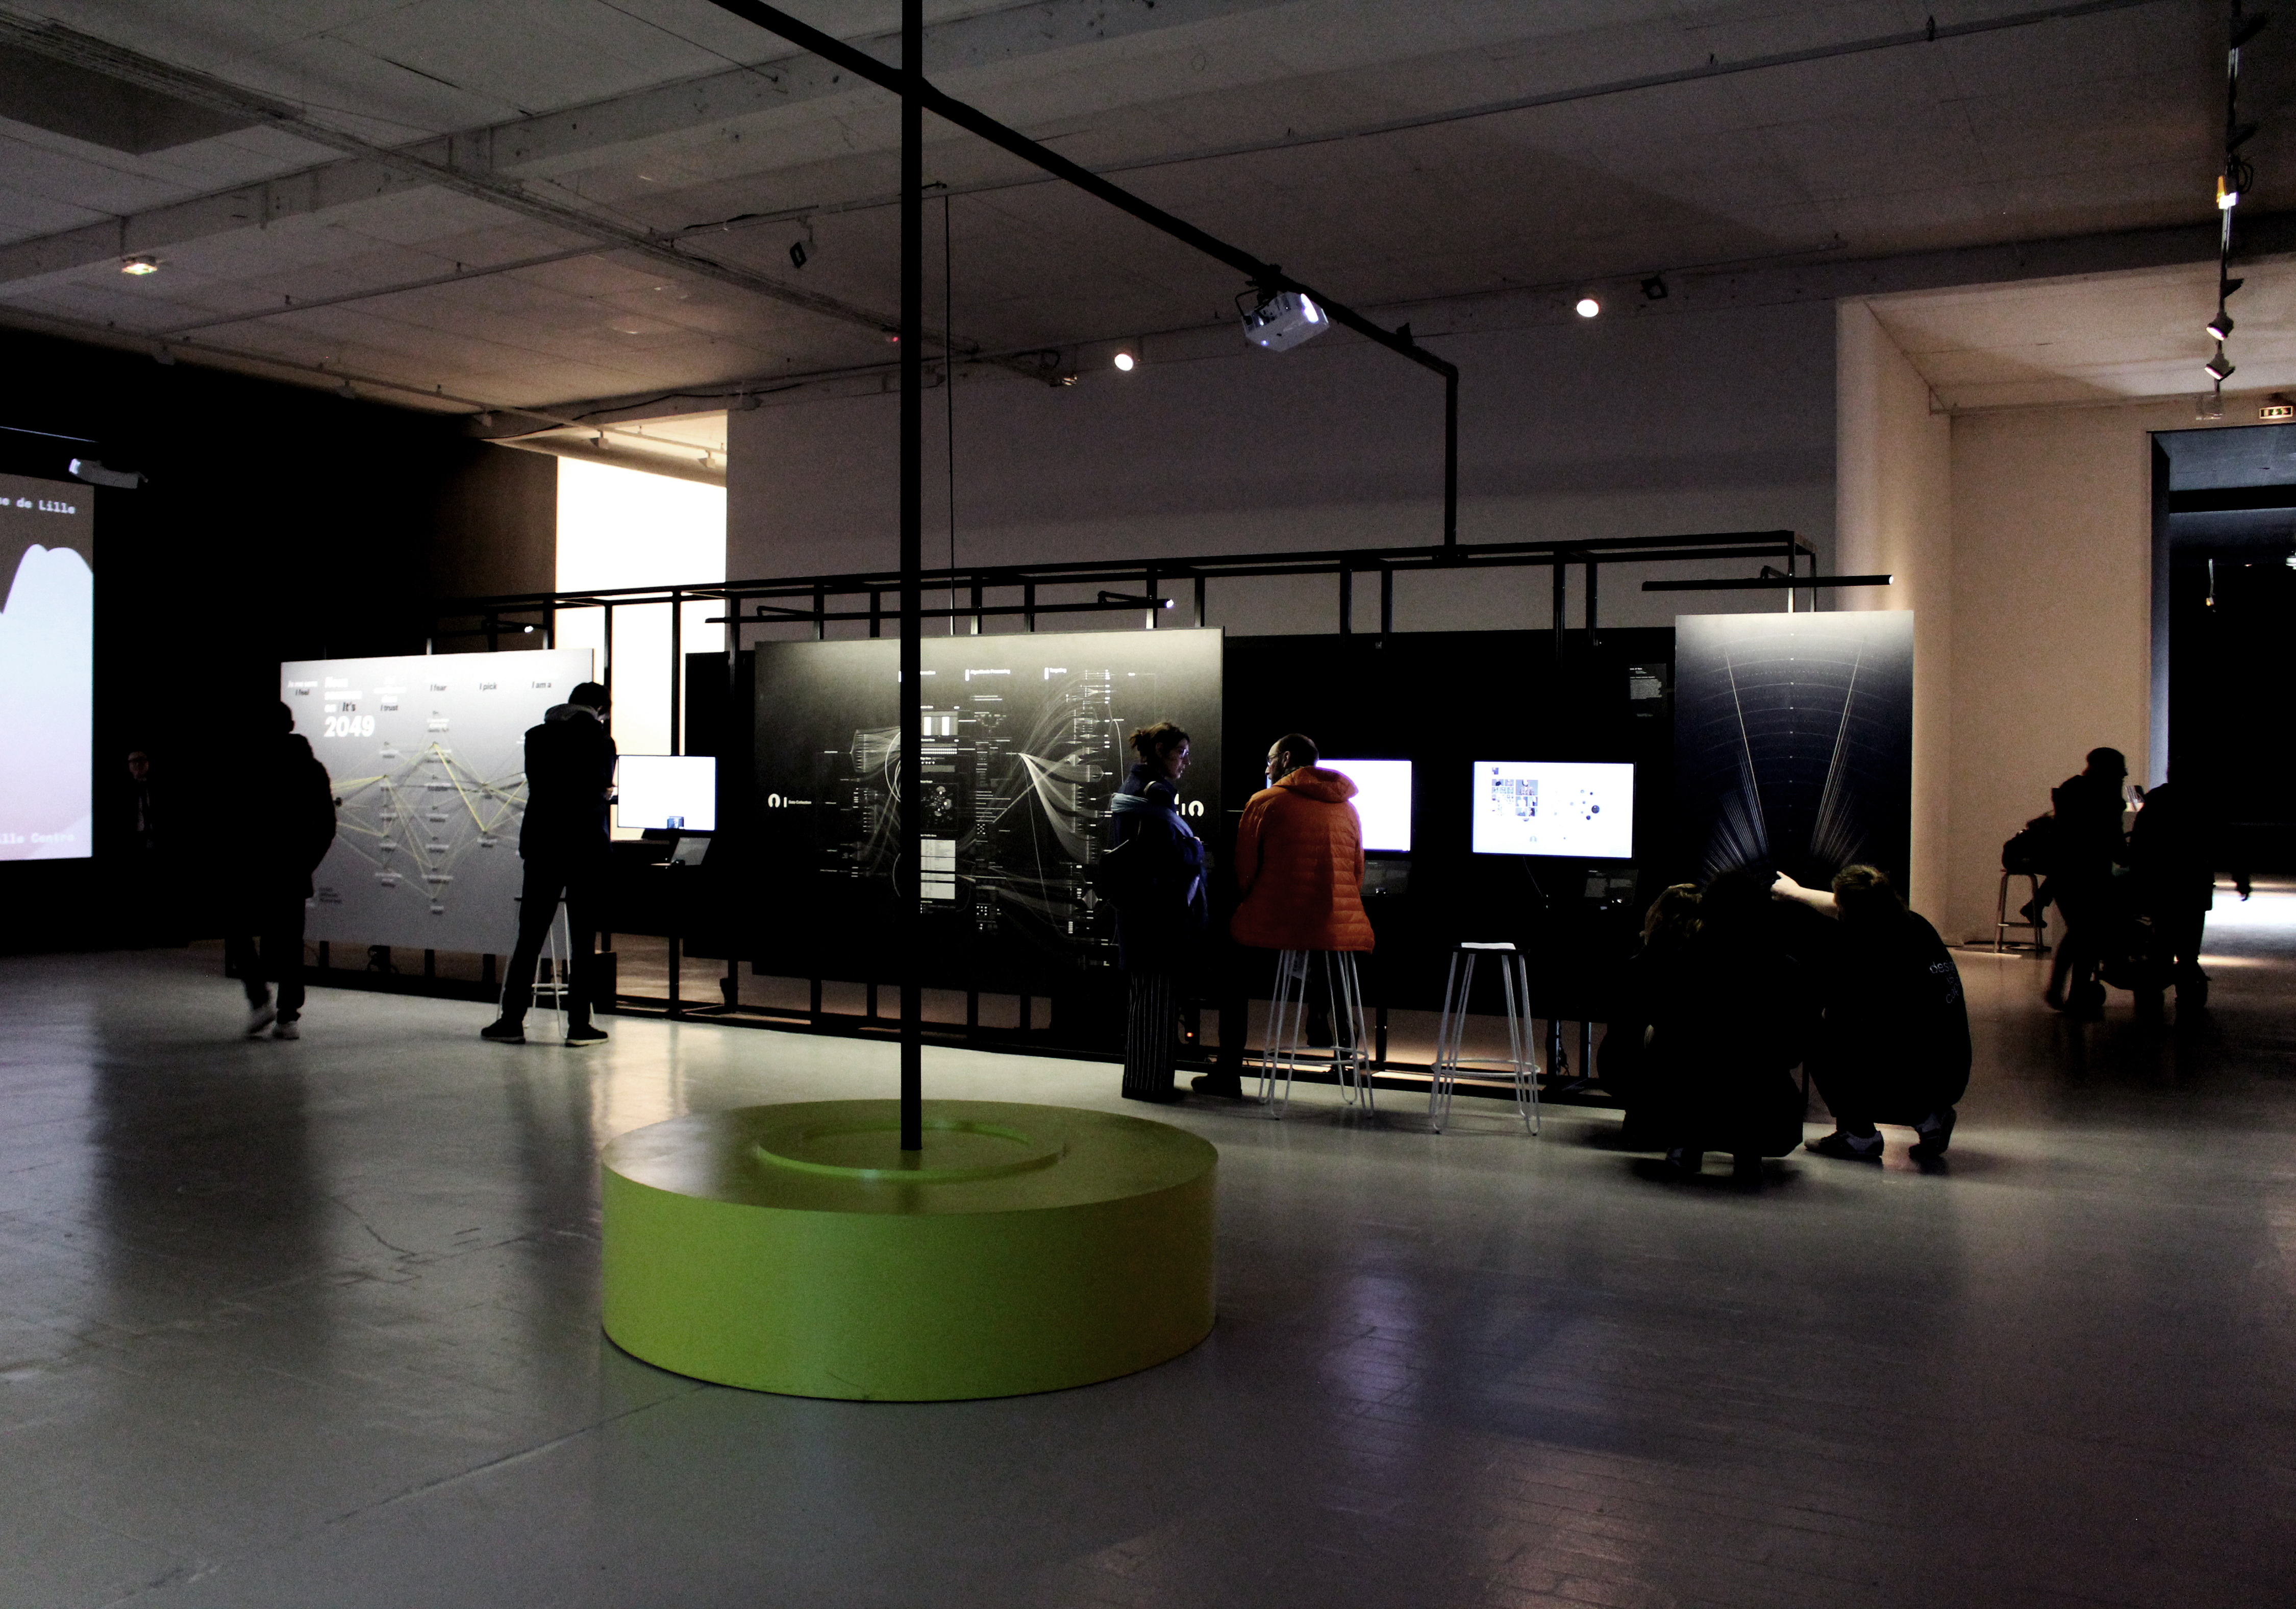
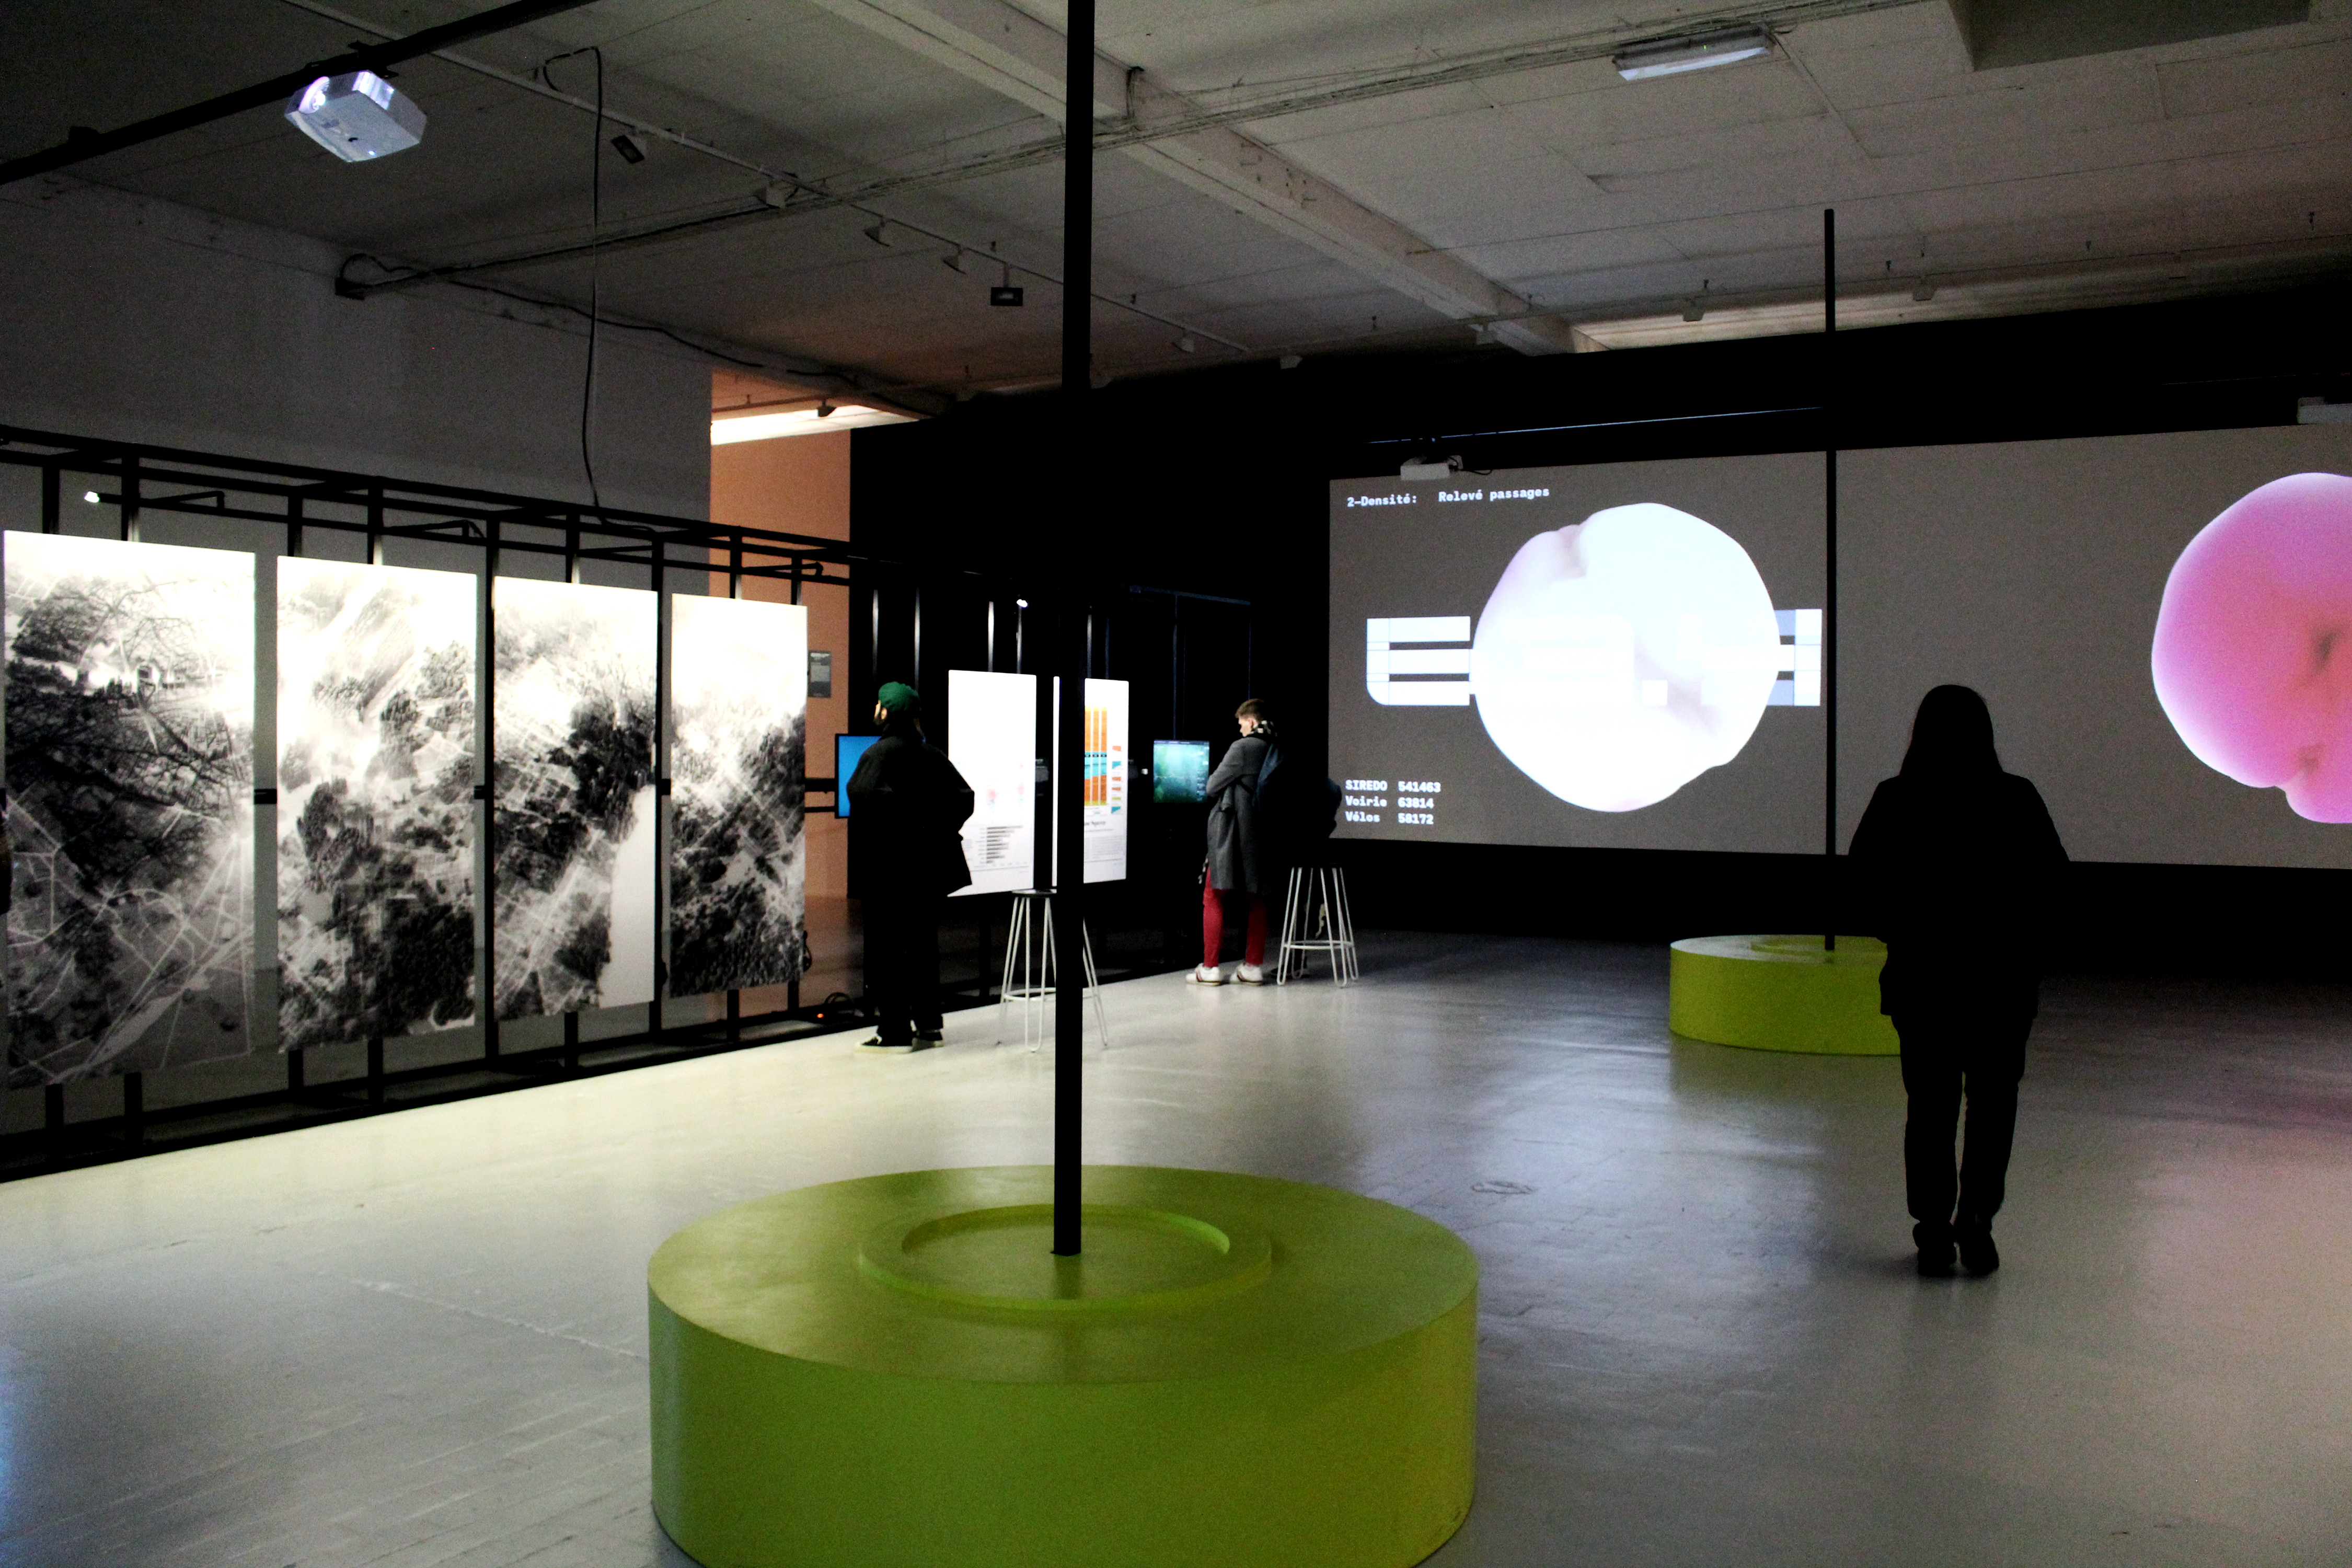
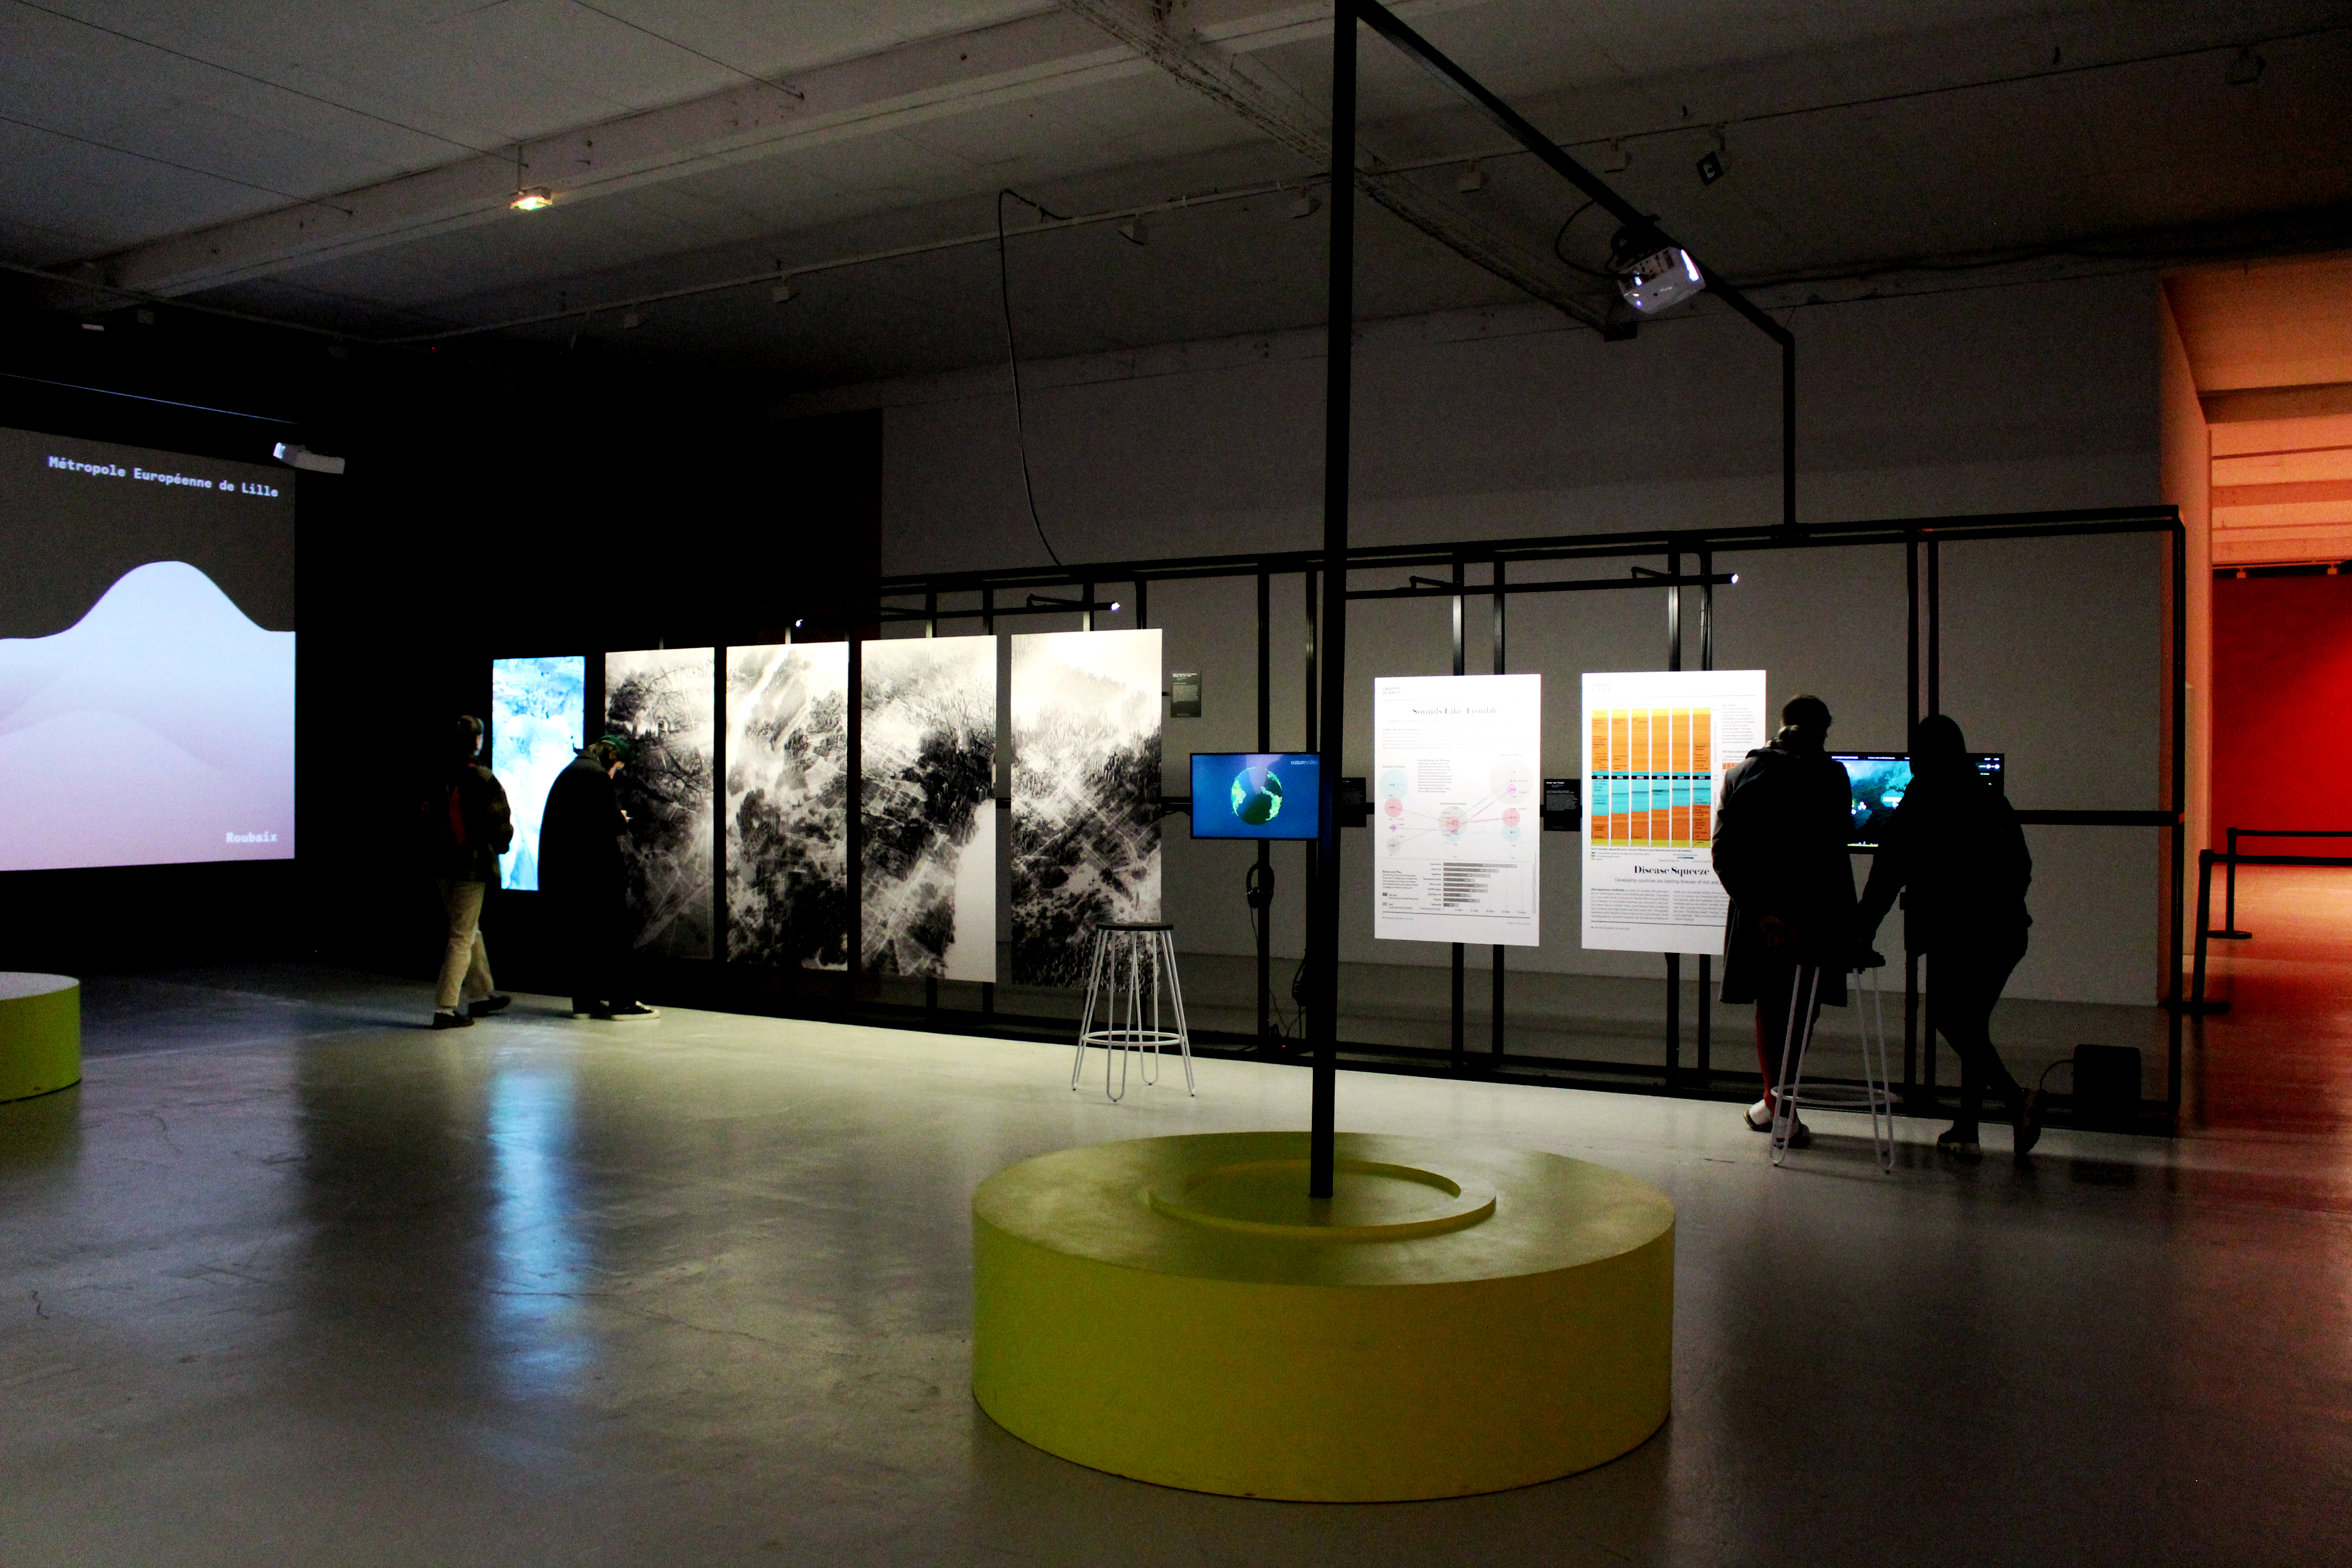
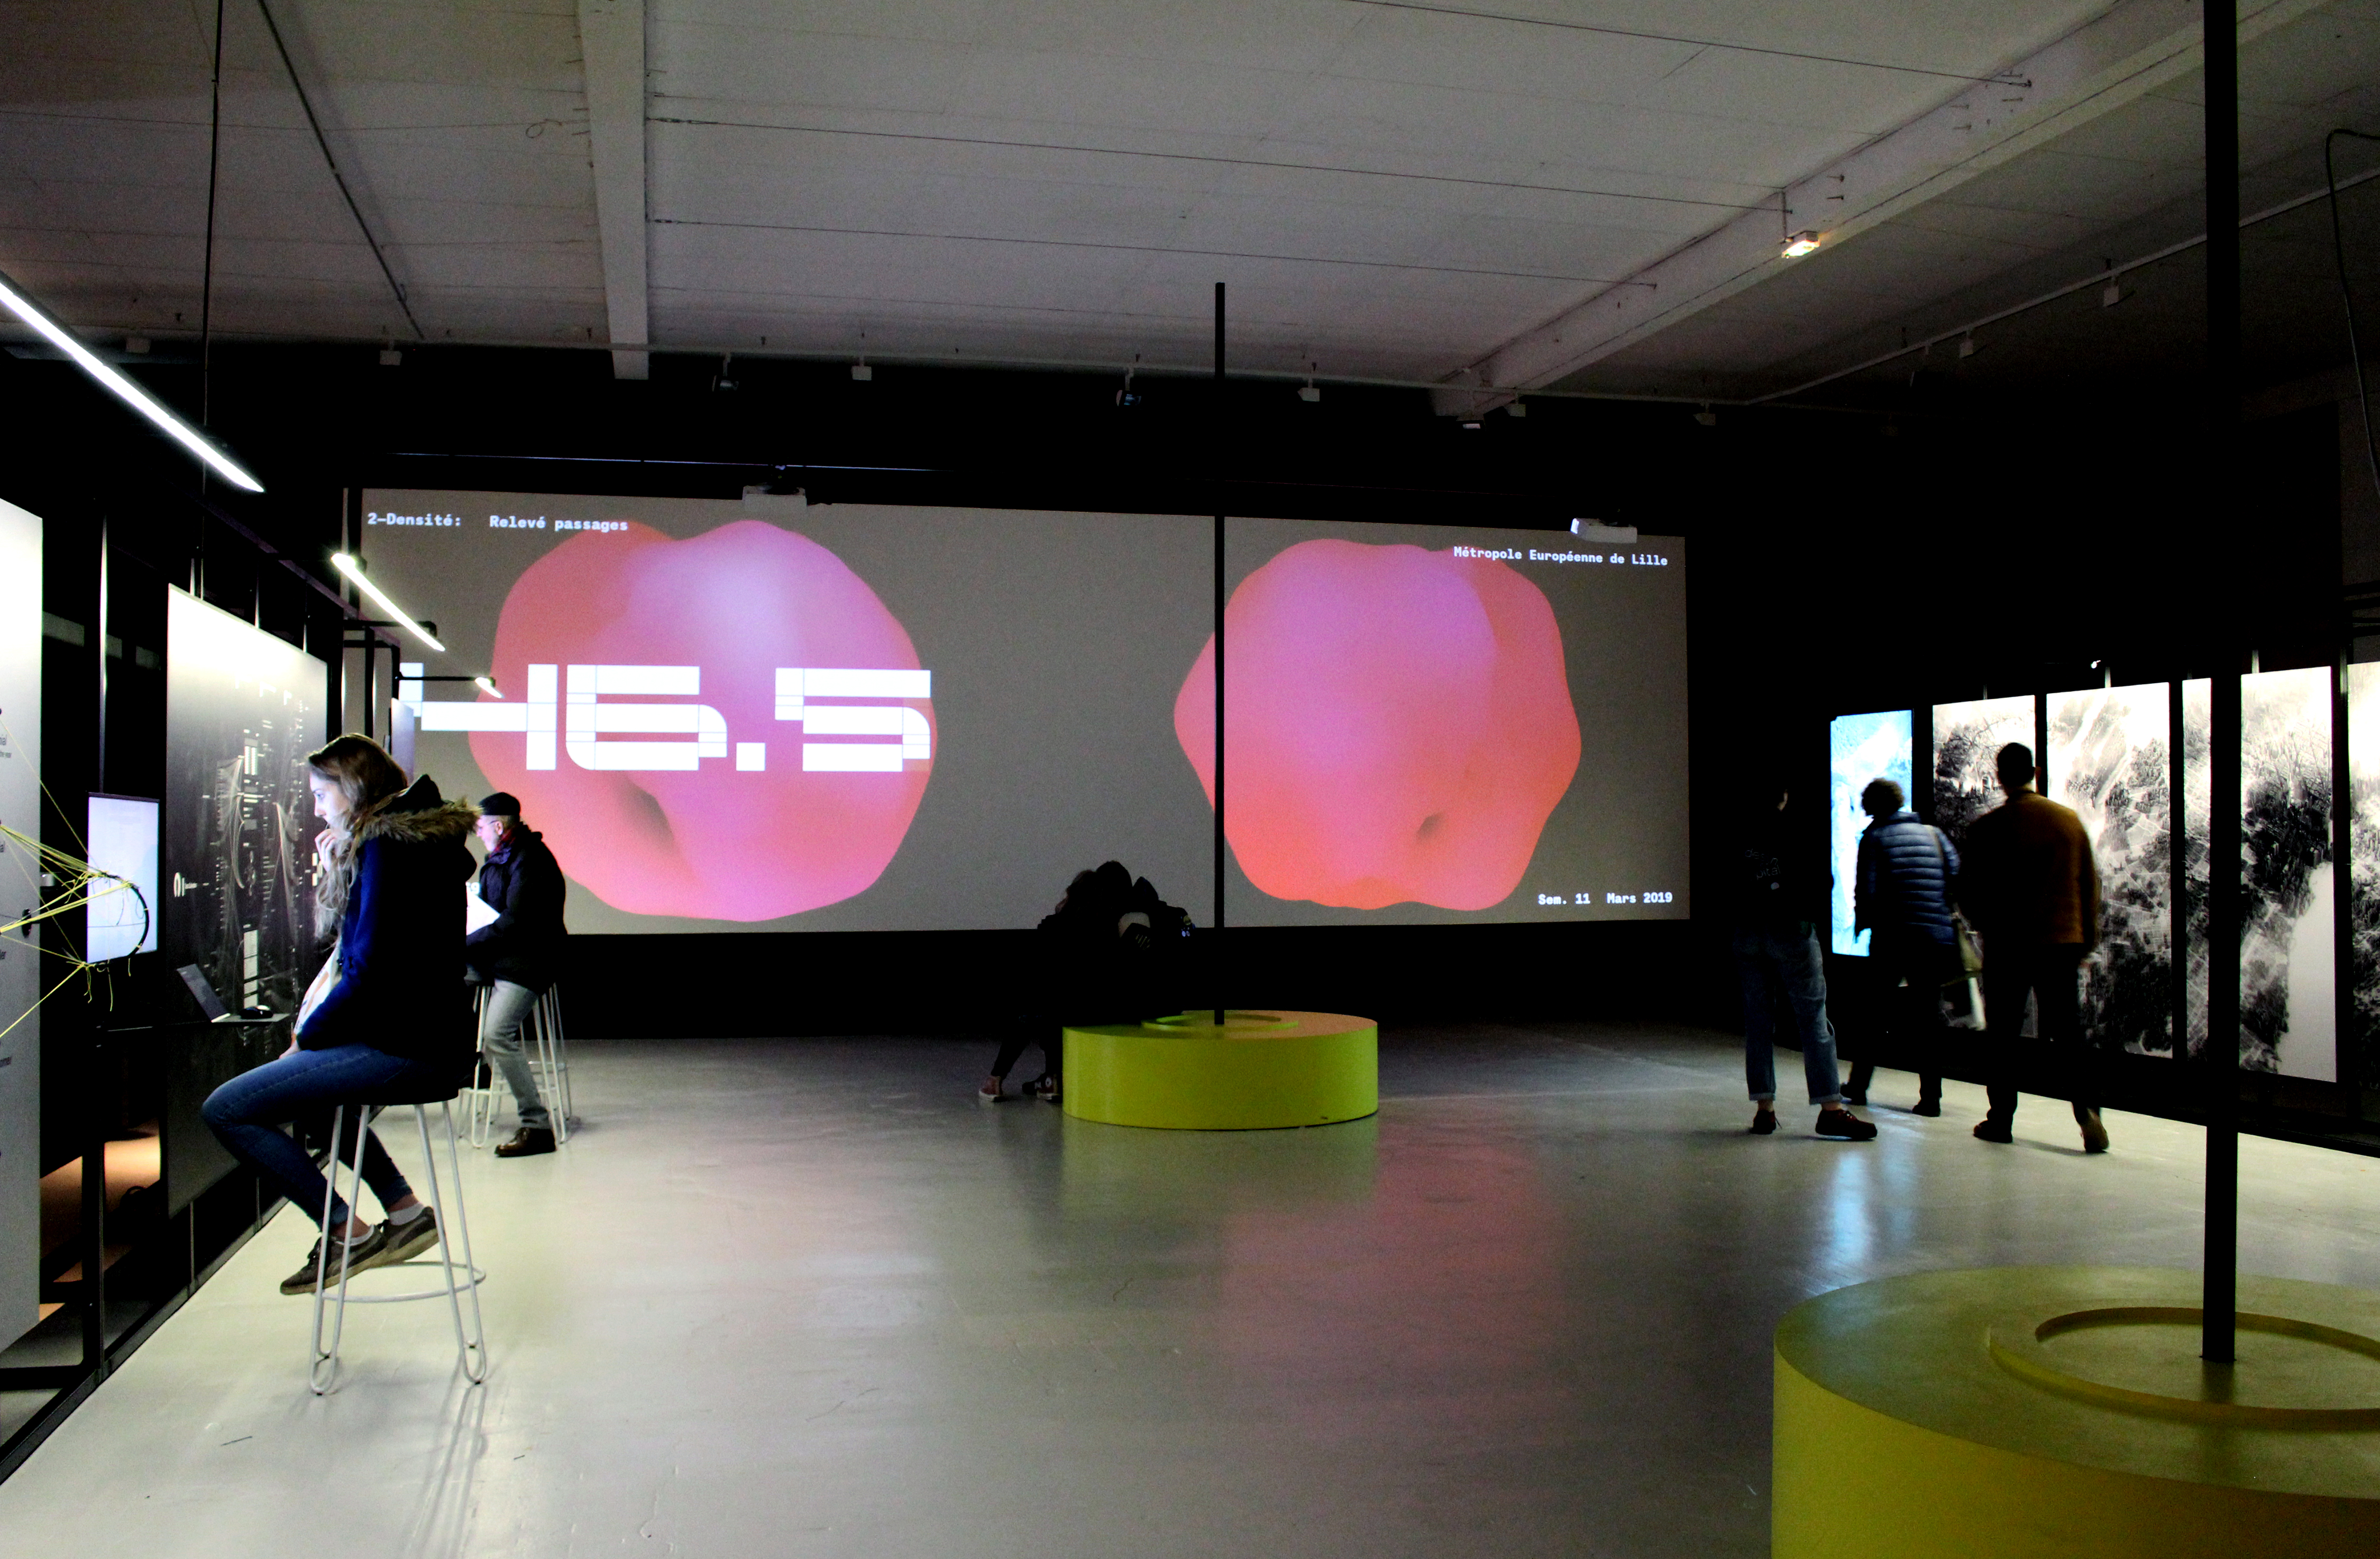
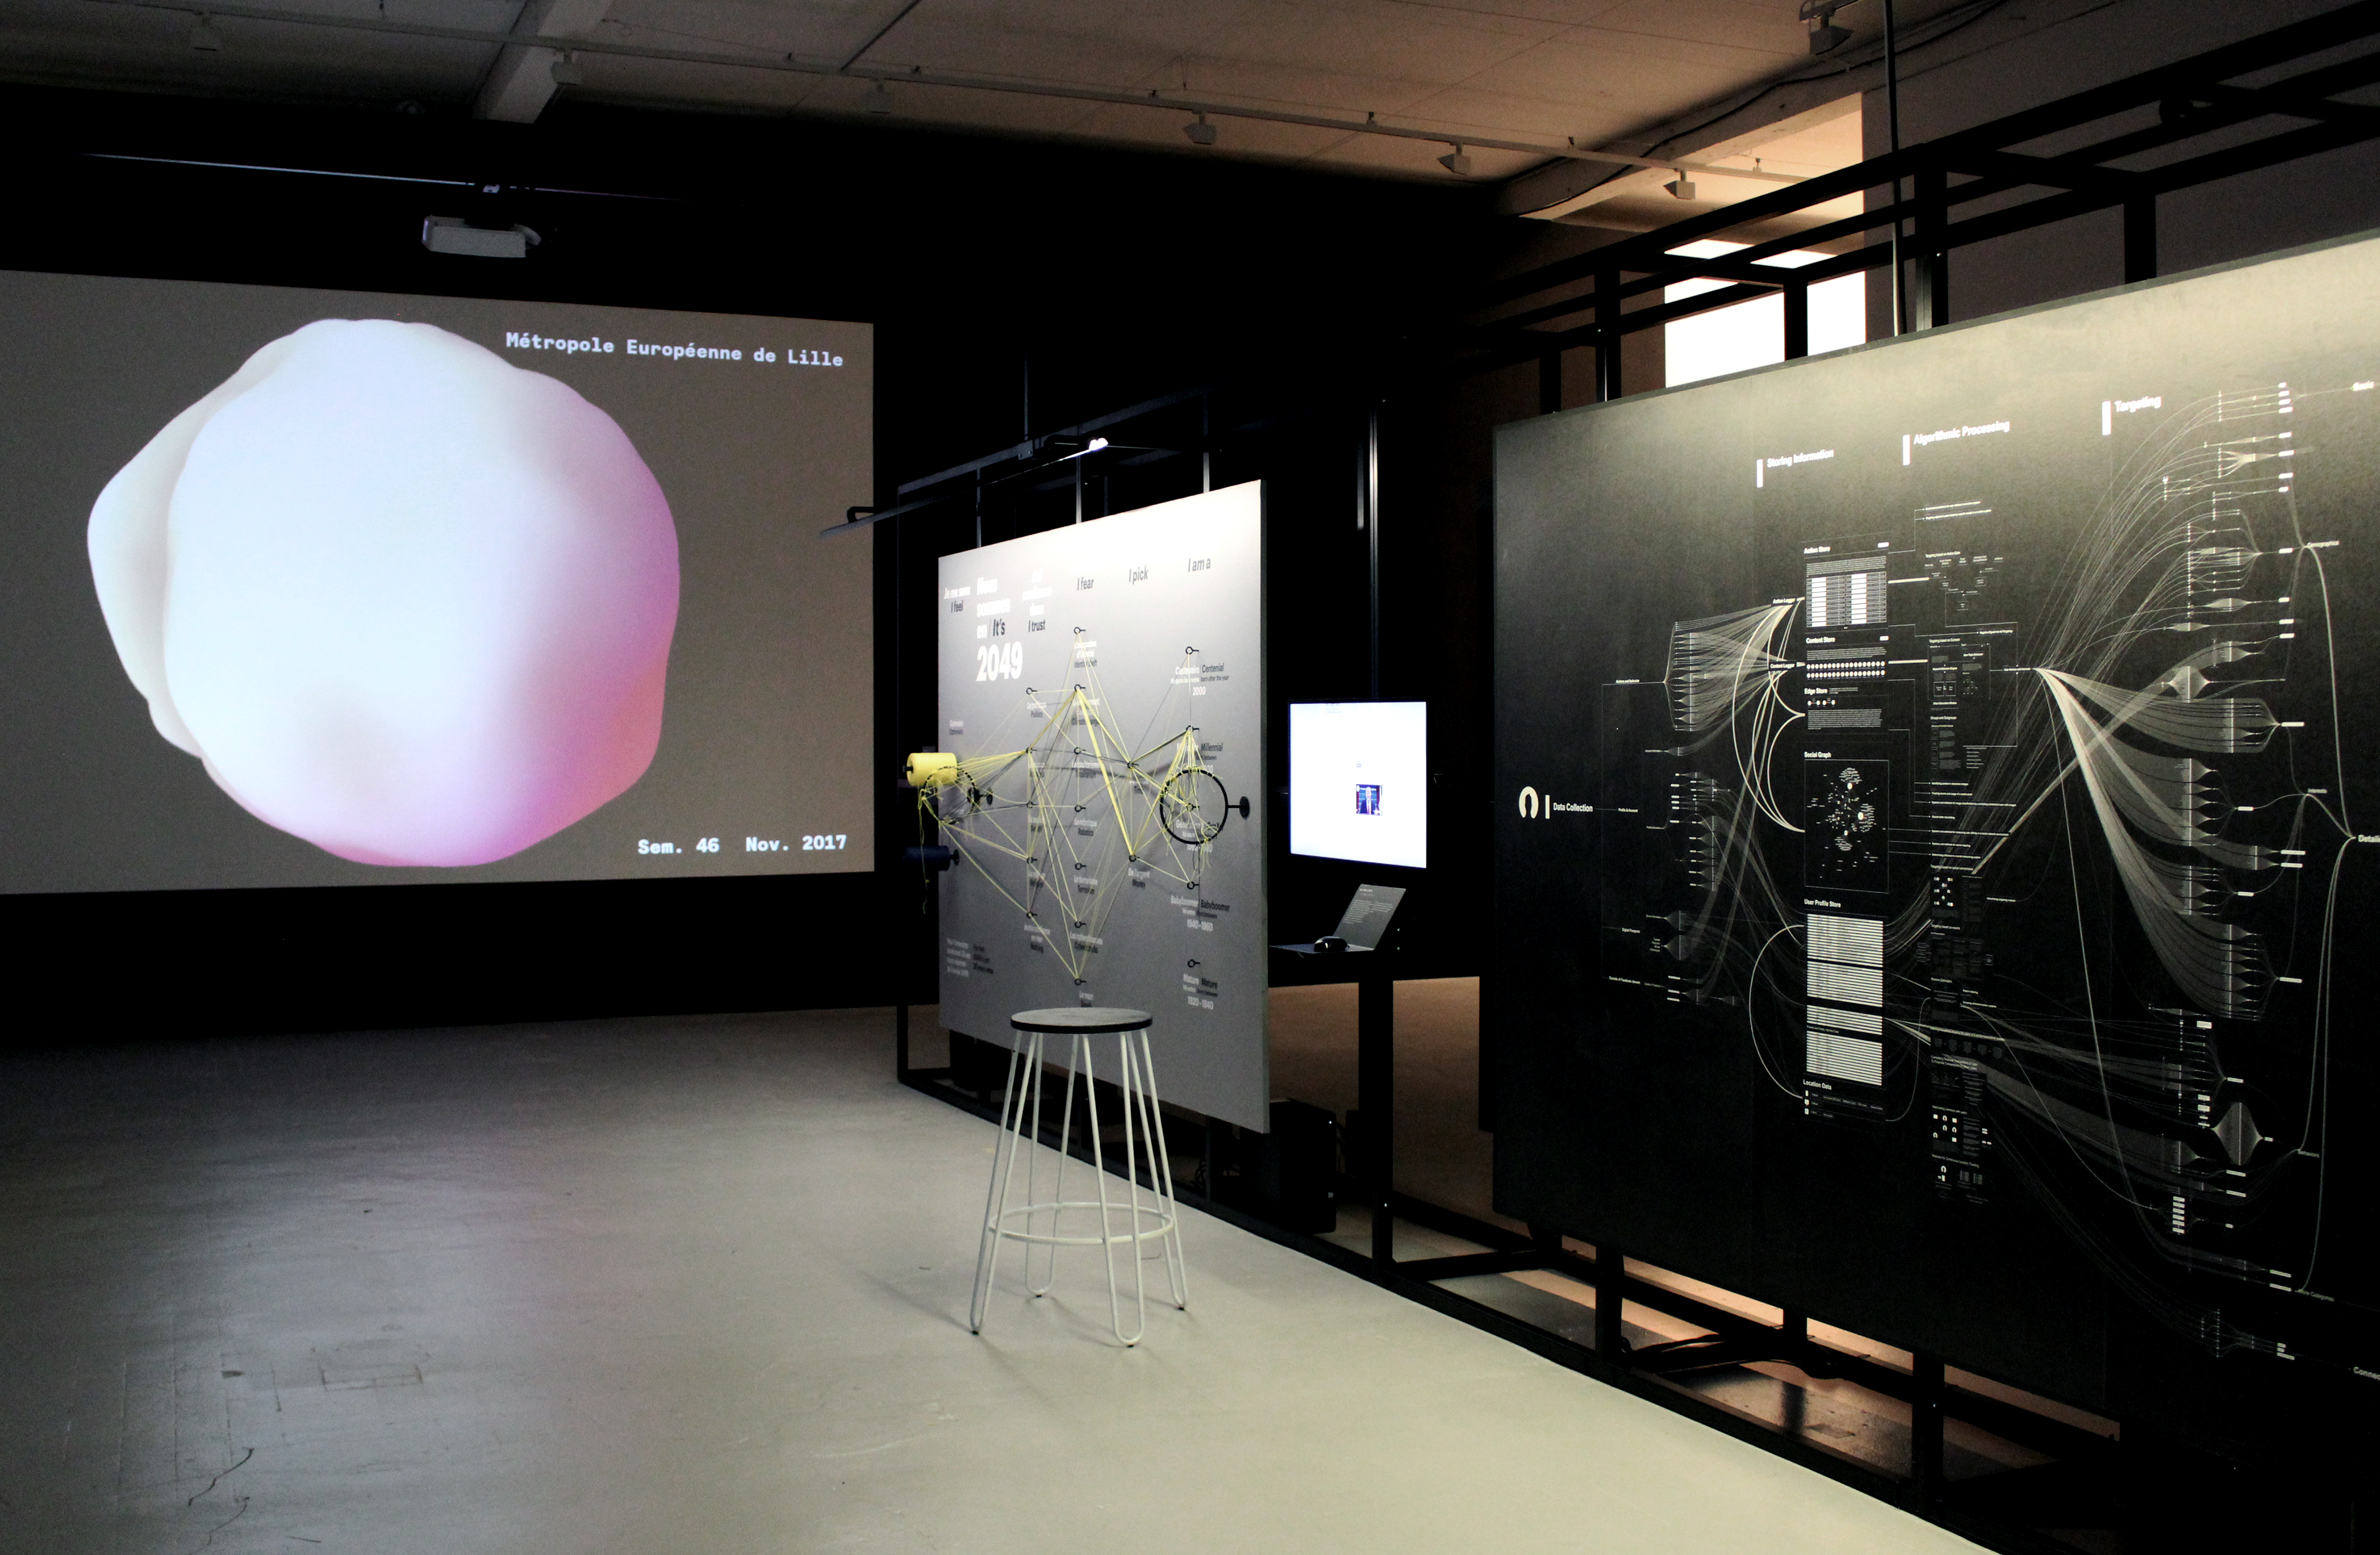
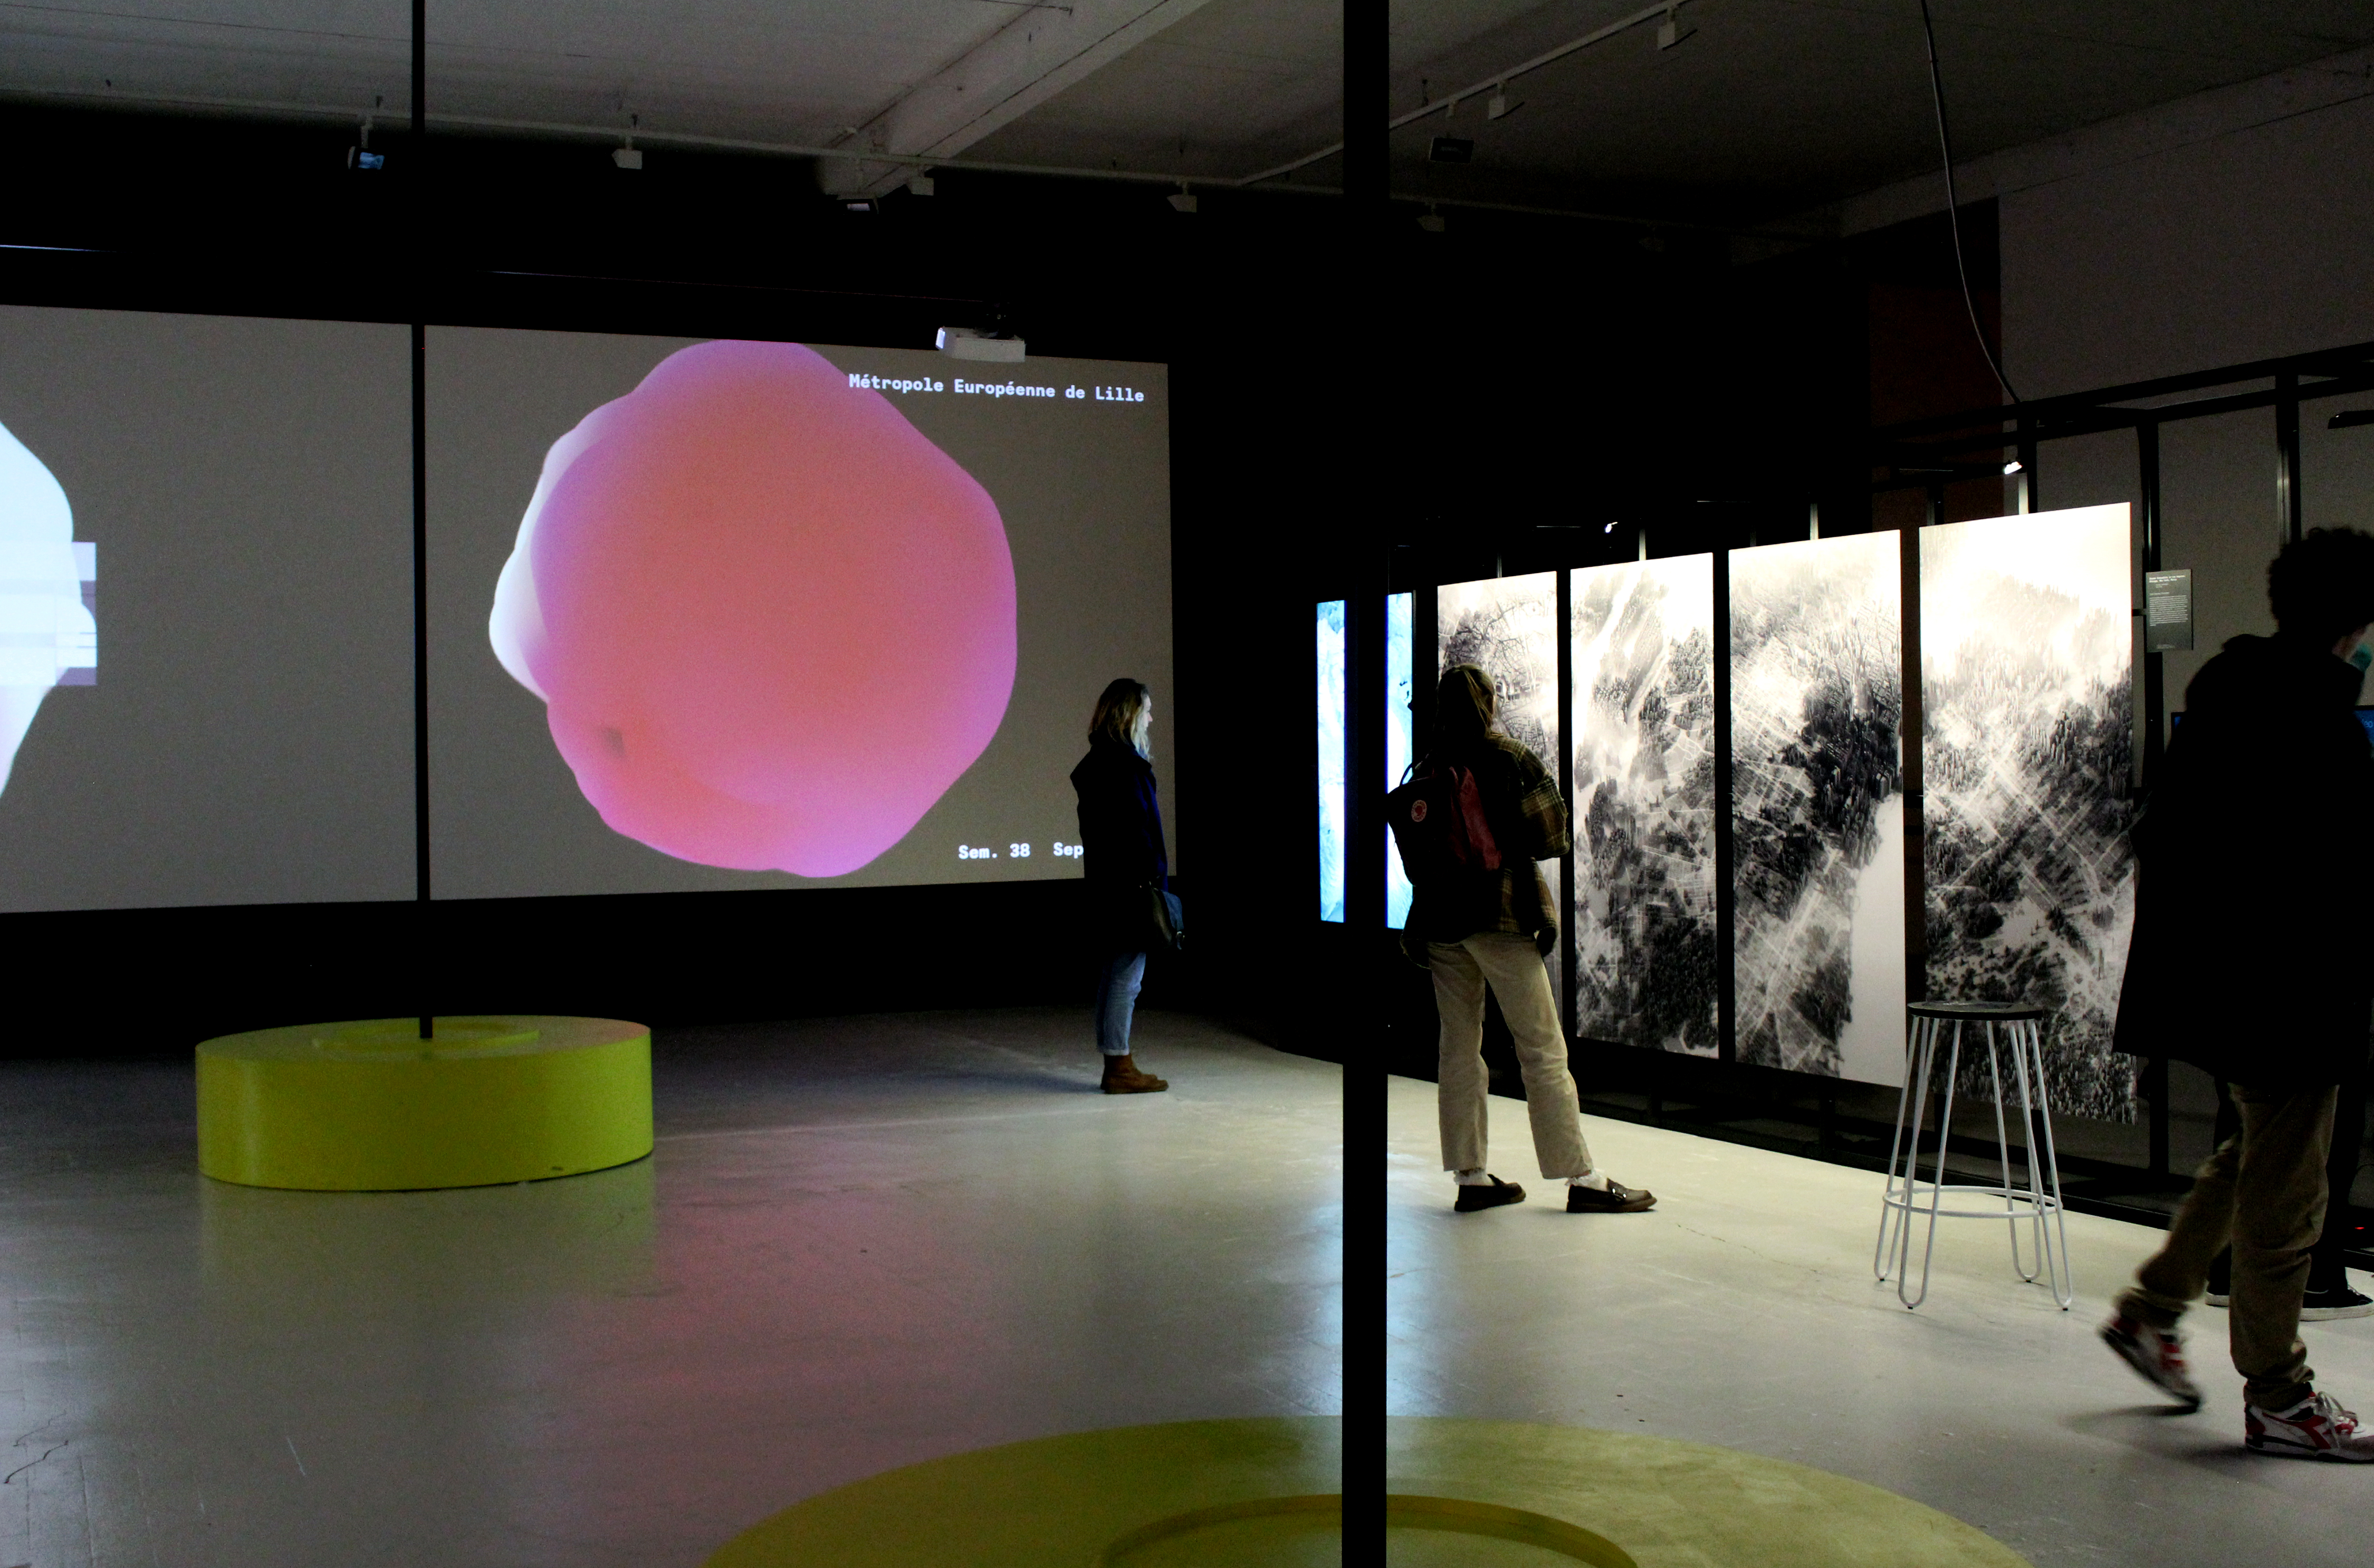
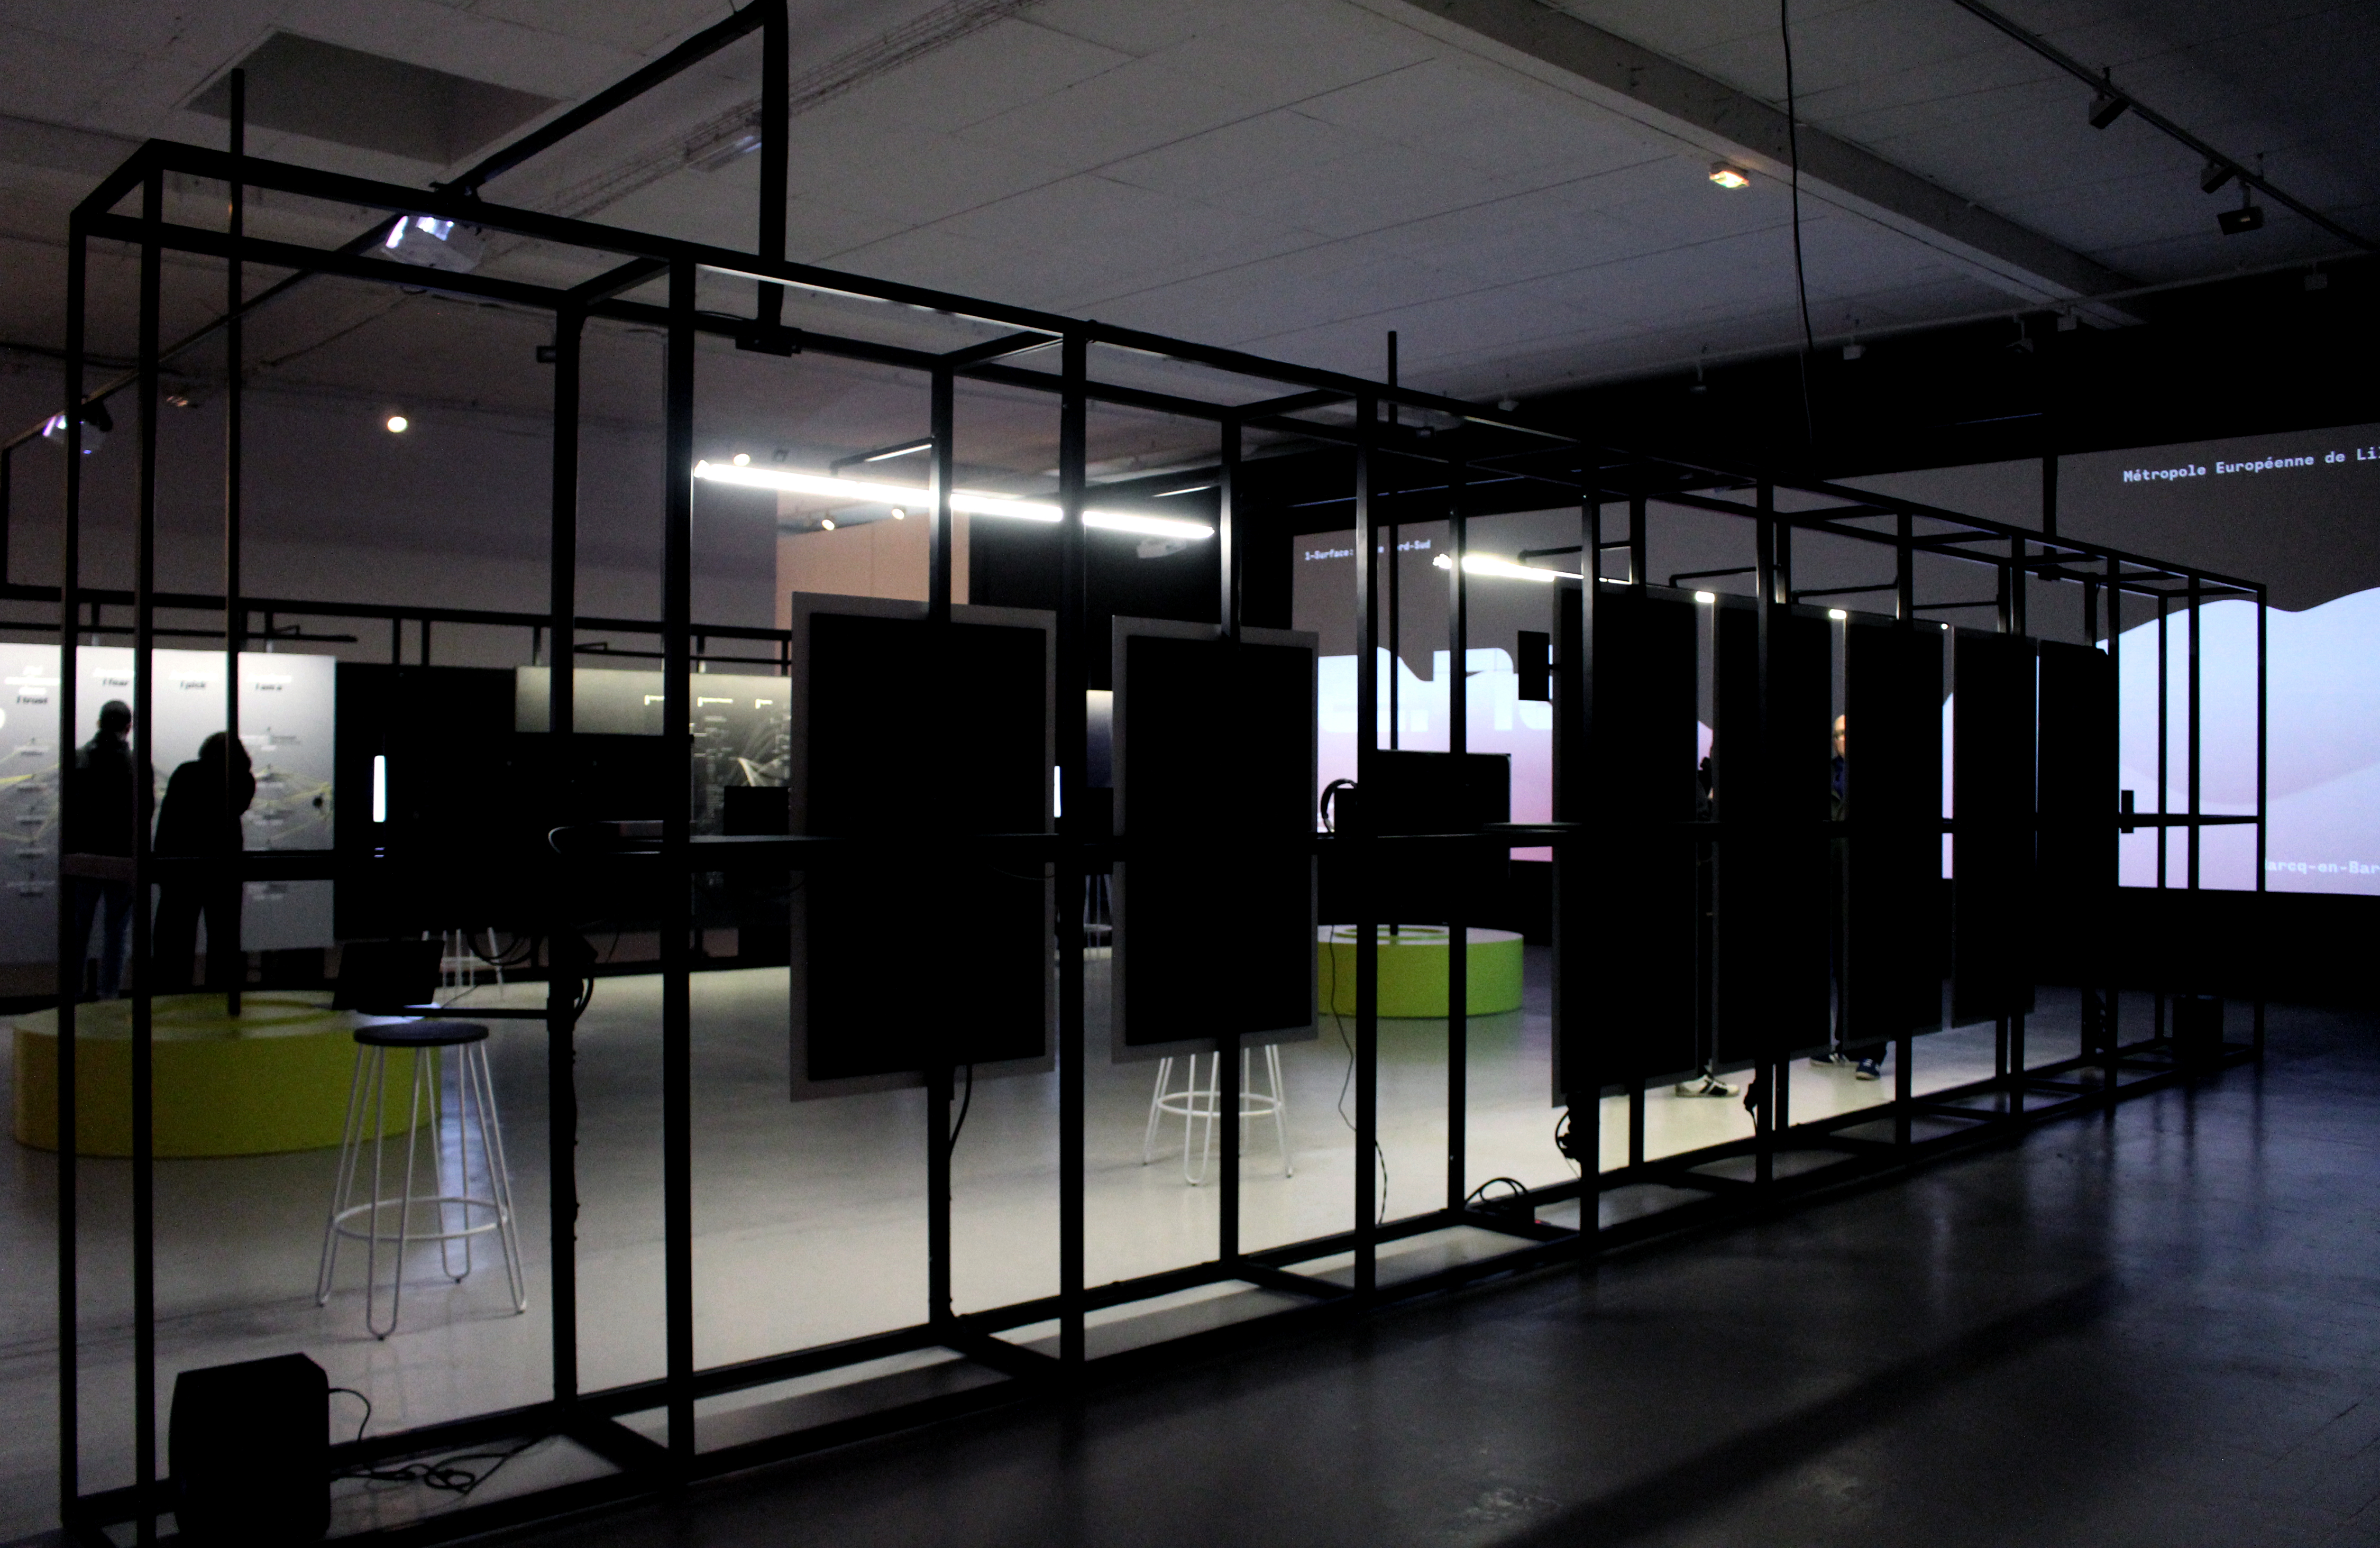
[Exhibition] “databaz” exhibition — third stage of the road show: Lille
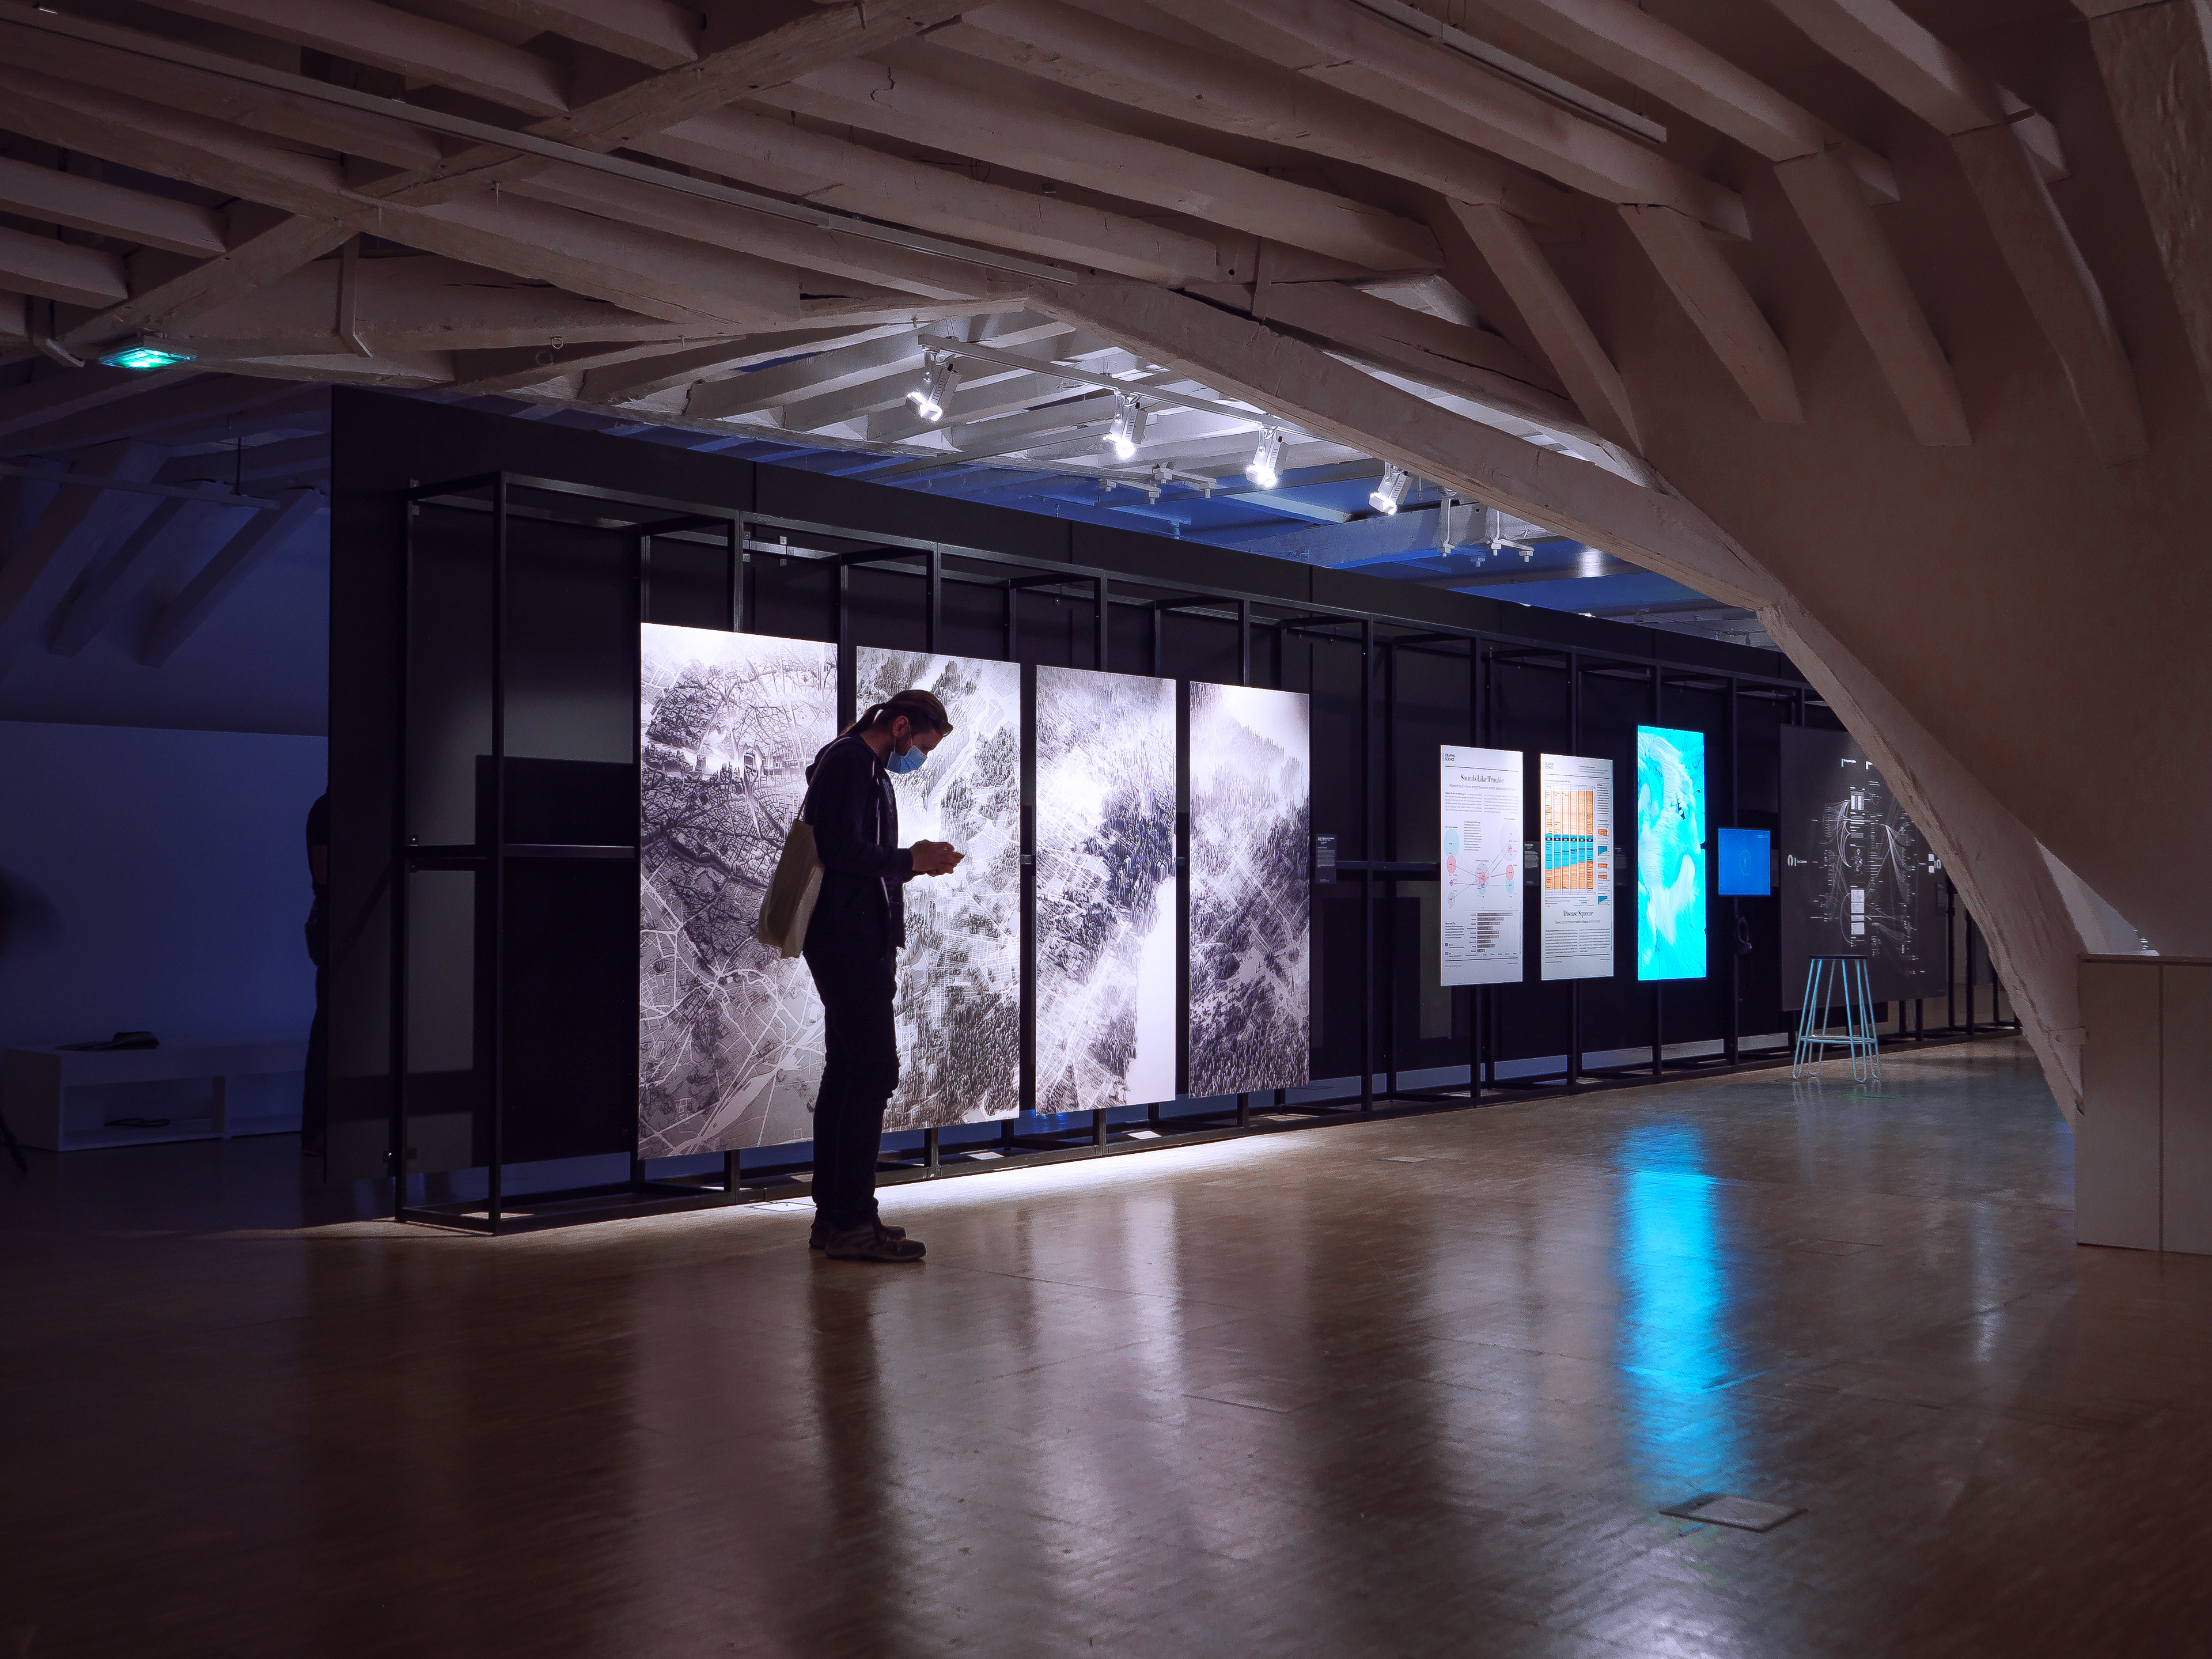
Coproduced by the EDF Foundation group, the EML (European Metropolis Lille) and the EDF Regional Delegation “Hauts-De-France”, this third edition of the “1,2,3 data” touring exhibition has taken place at the Tripostal—Lille (from February 5, to March 8, 2020). This exhibit was part of the official program of Lille Metropole 2020 World Design Capital (labelled by the World Design Consortium — WDC) #DesignIsCaptial. This exhbition includes the “2gather” project designed and developped in collaboration with the Trafik studio.
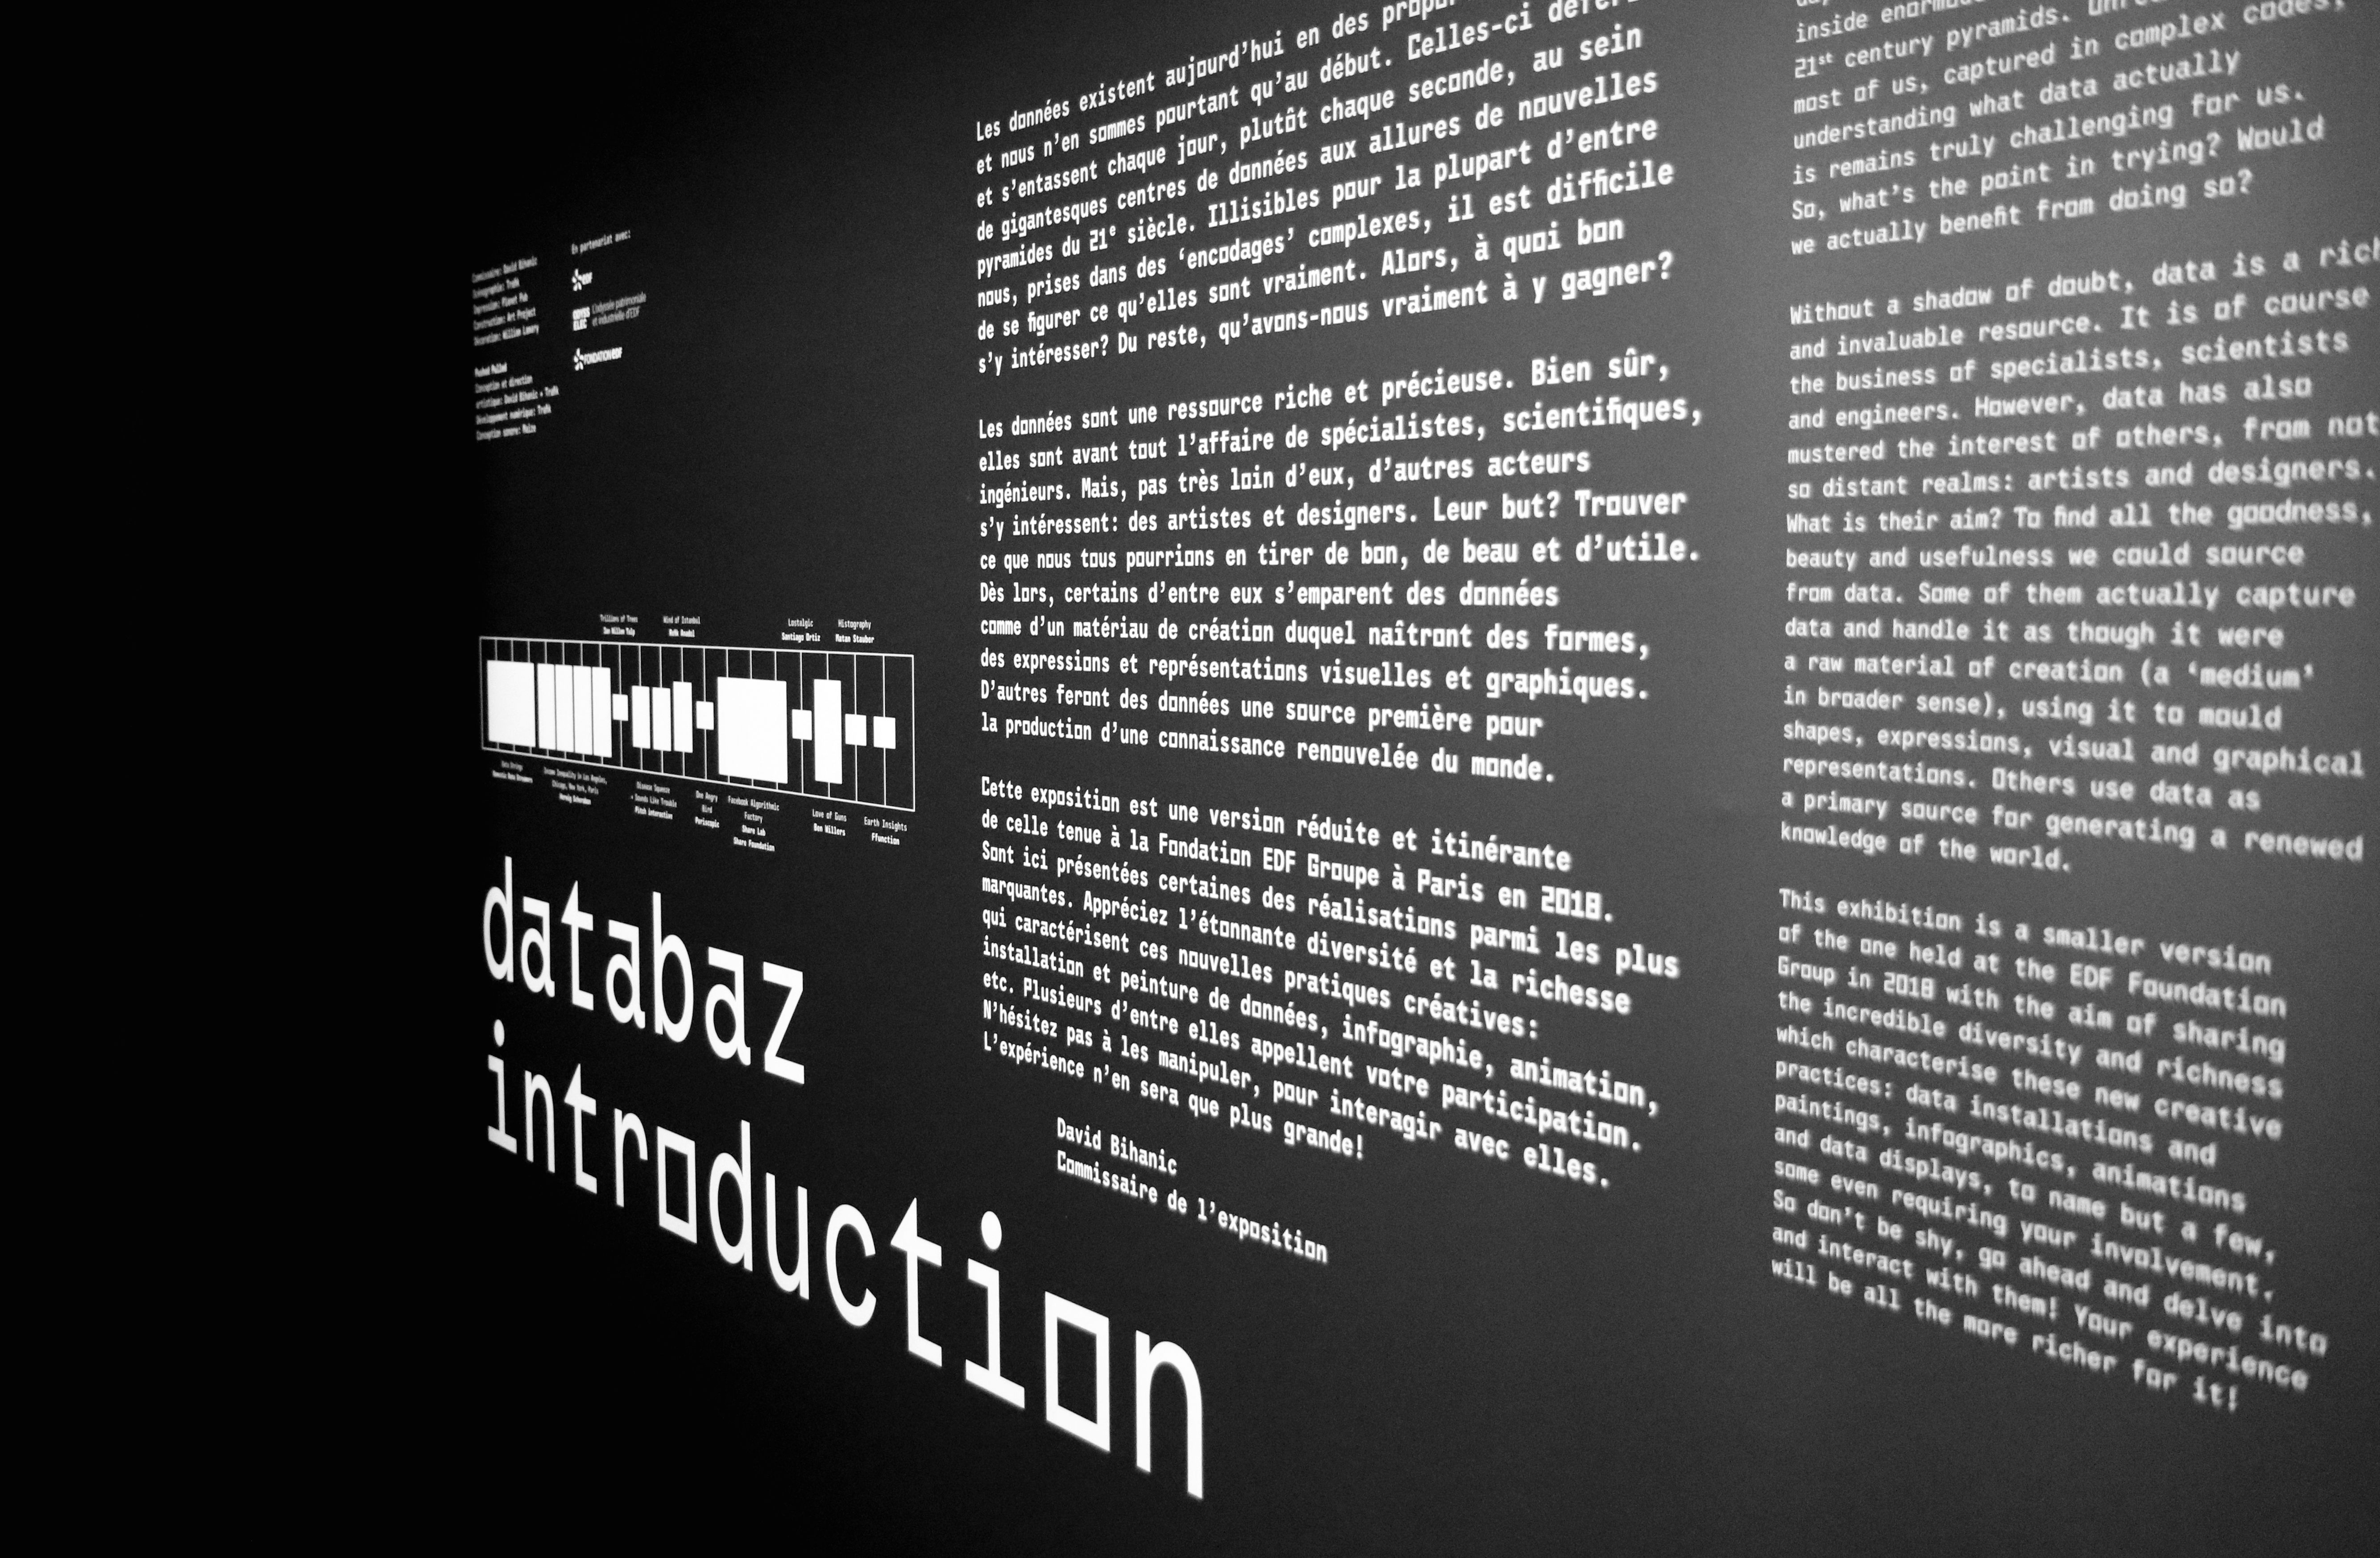
Presentation text
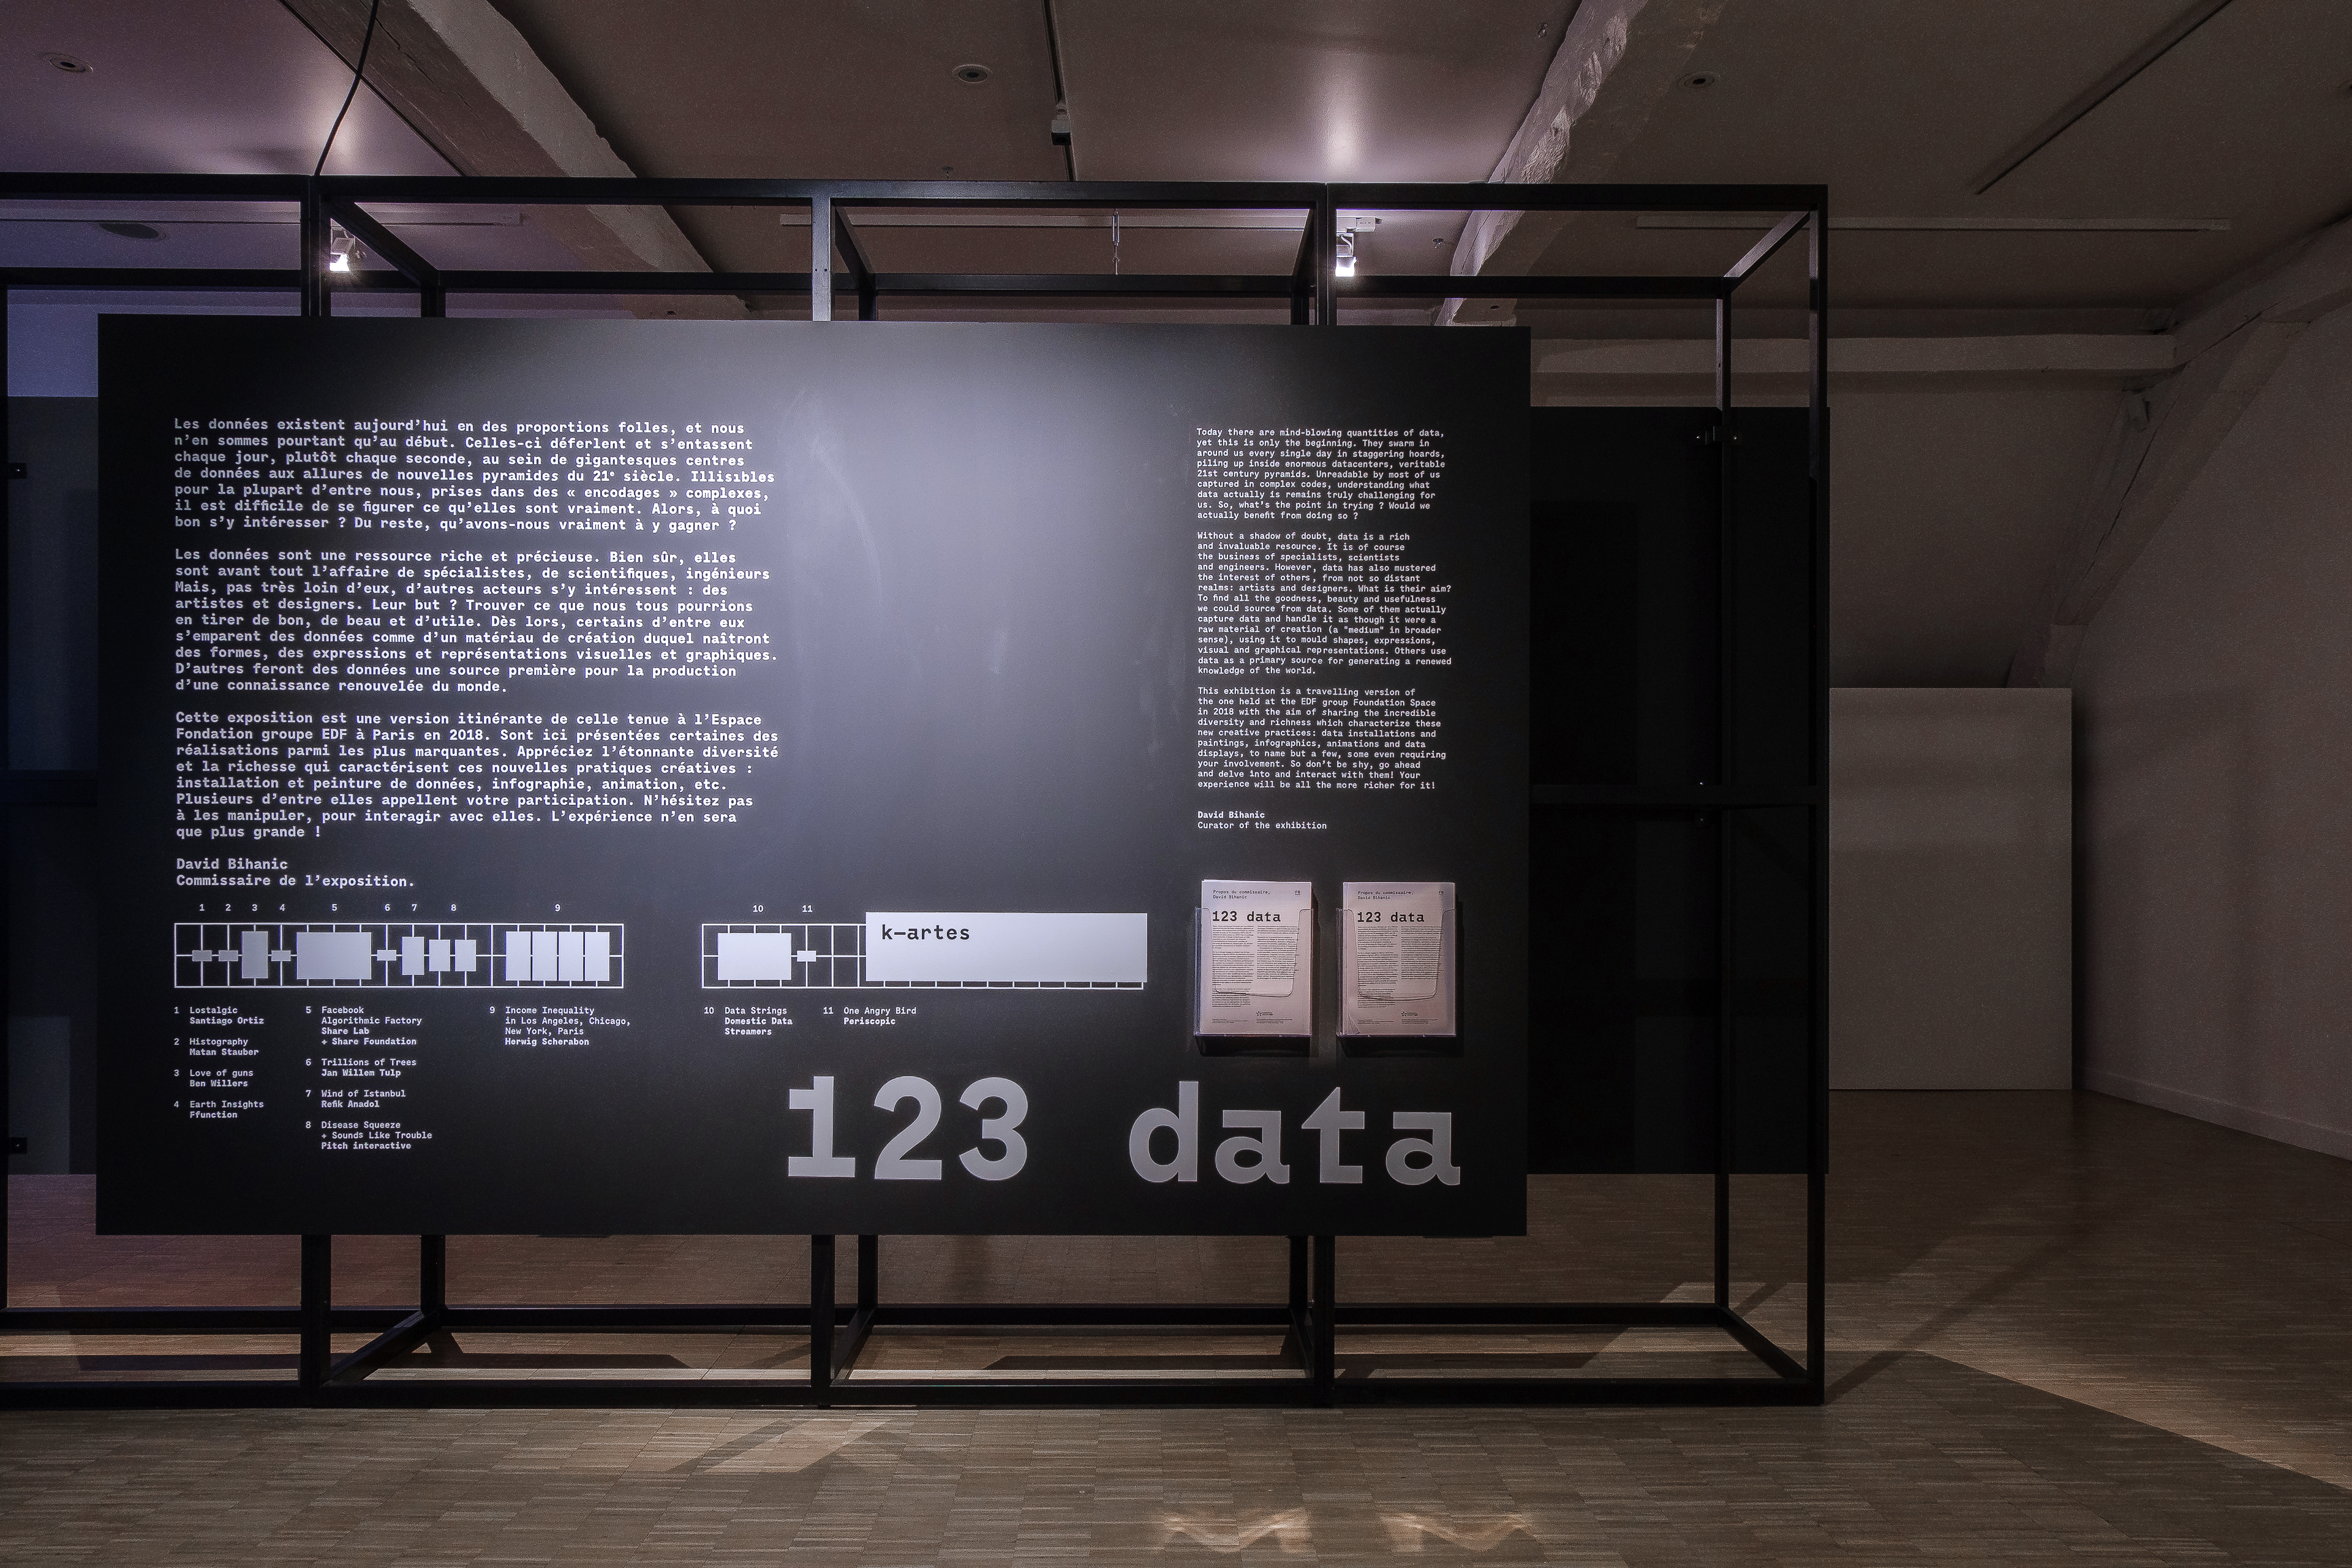
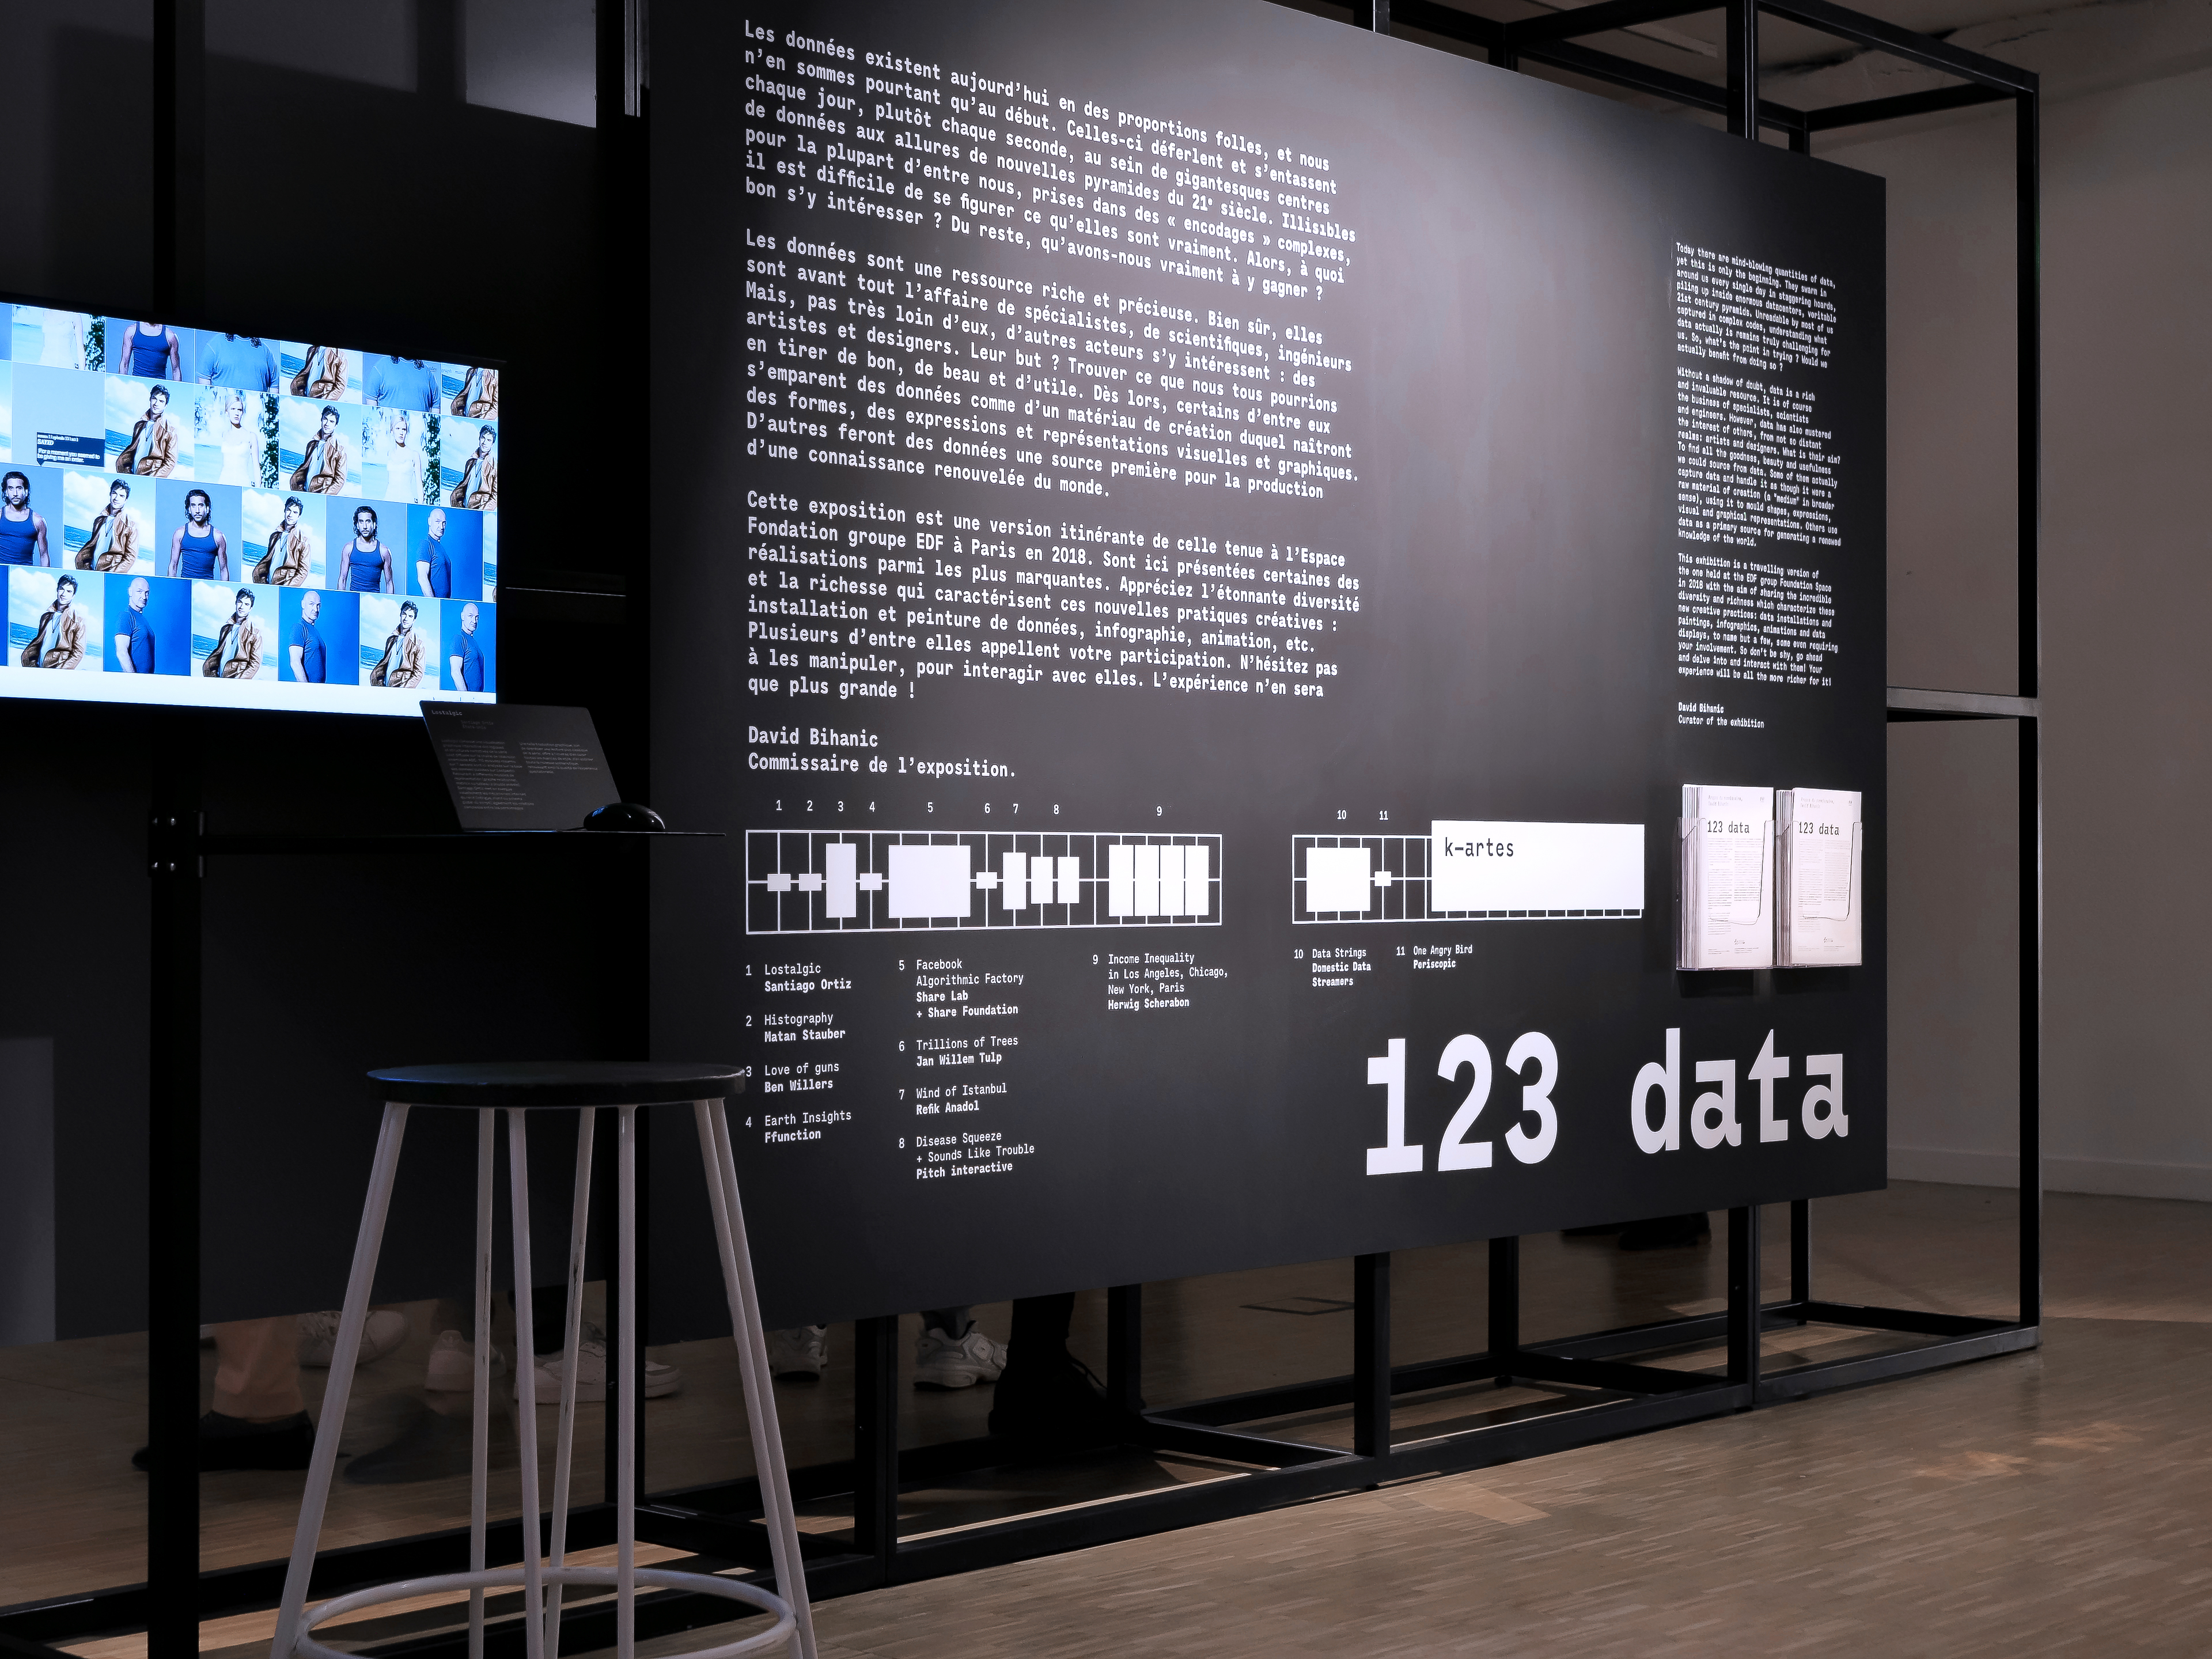
The data, which is produced and communicated “digitally”, pours out and piles up second by second inside giant data centres that look like new 21st century pyramids. Illegible to most of us and taken from complex “encoding”, it is difficult to imagine what they really are. So why bother looking at them? Data is a rich and valuable resource. Although it is the domain of specialists, scientists and engineers first and foremost, other groups of people who have also taken a close interest in it: artists and designers. Their goal: to find the good, beautiful and useful things it can offer us all. Some of them have begun to use data as a creative material, giving rise to visual and graphic forms, expressions and representations. Others see data as a key source in producing an updated understanding of the world.
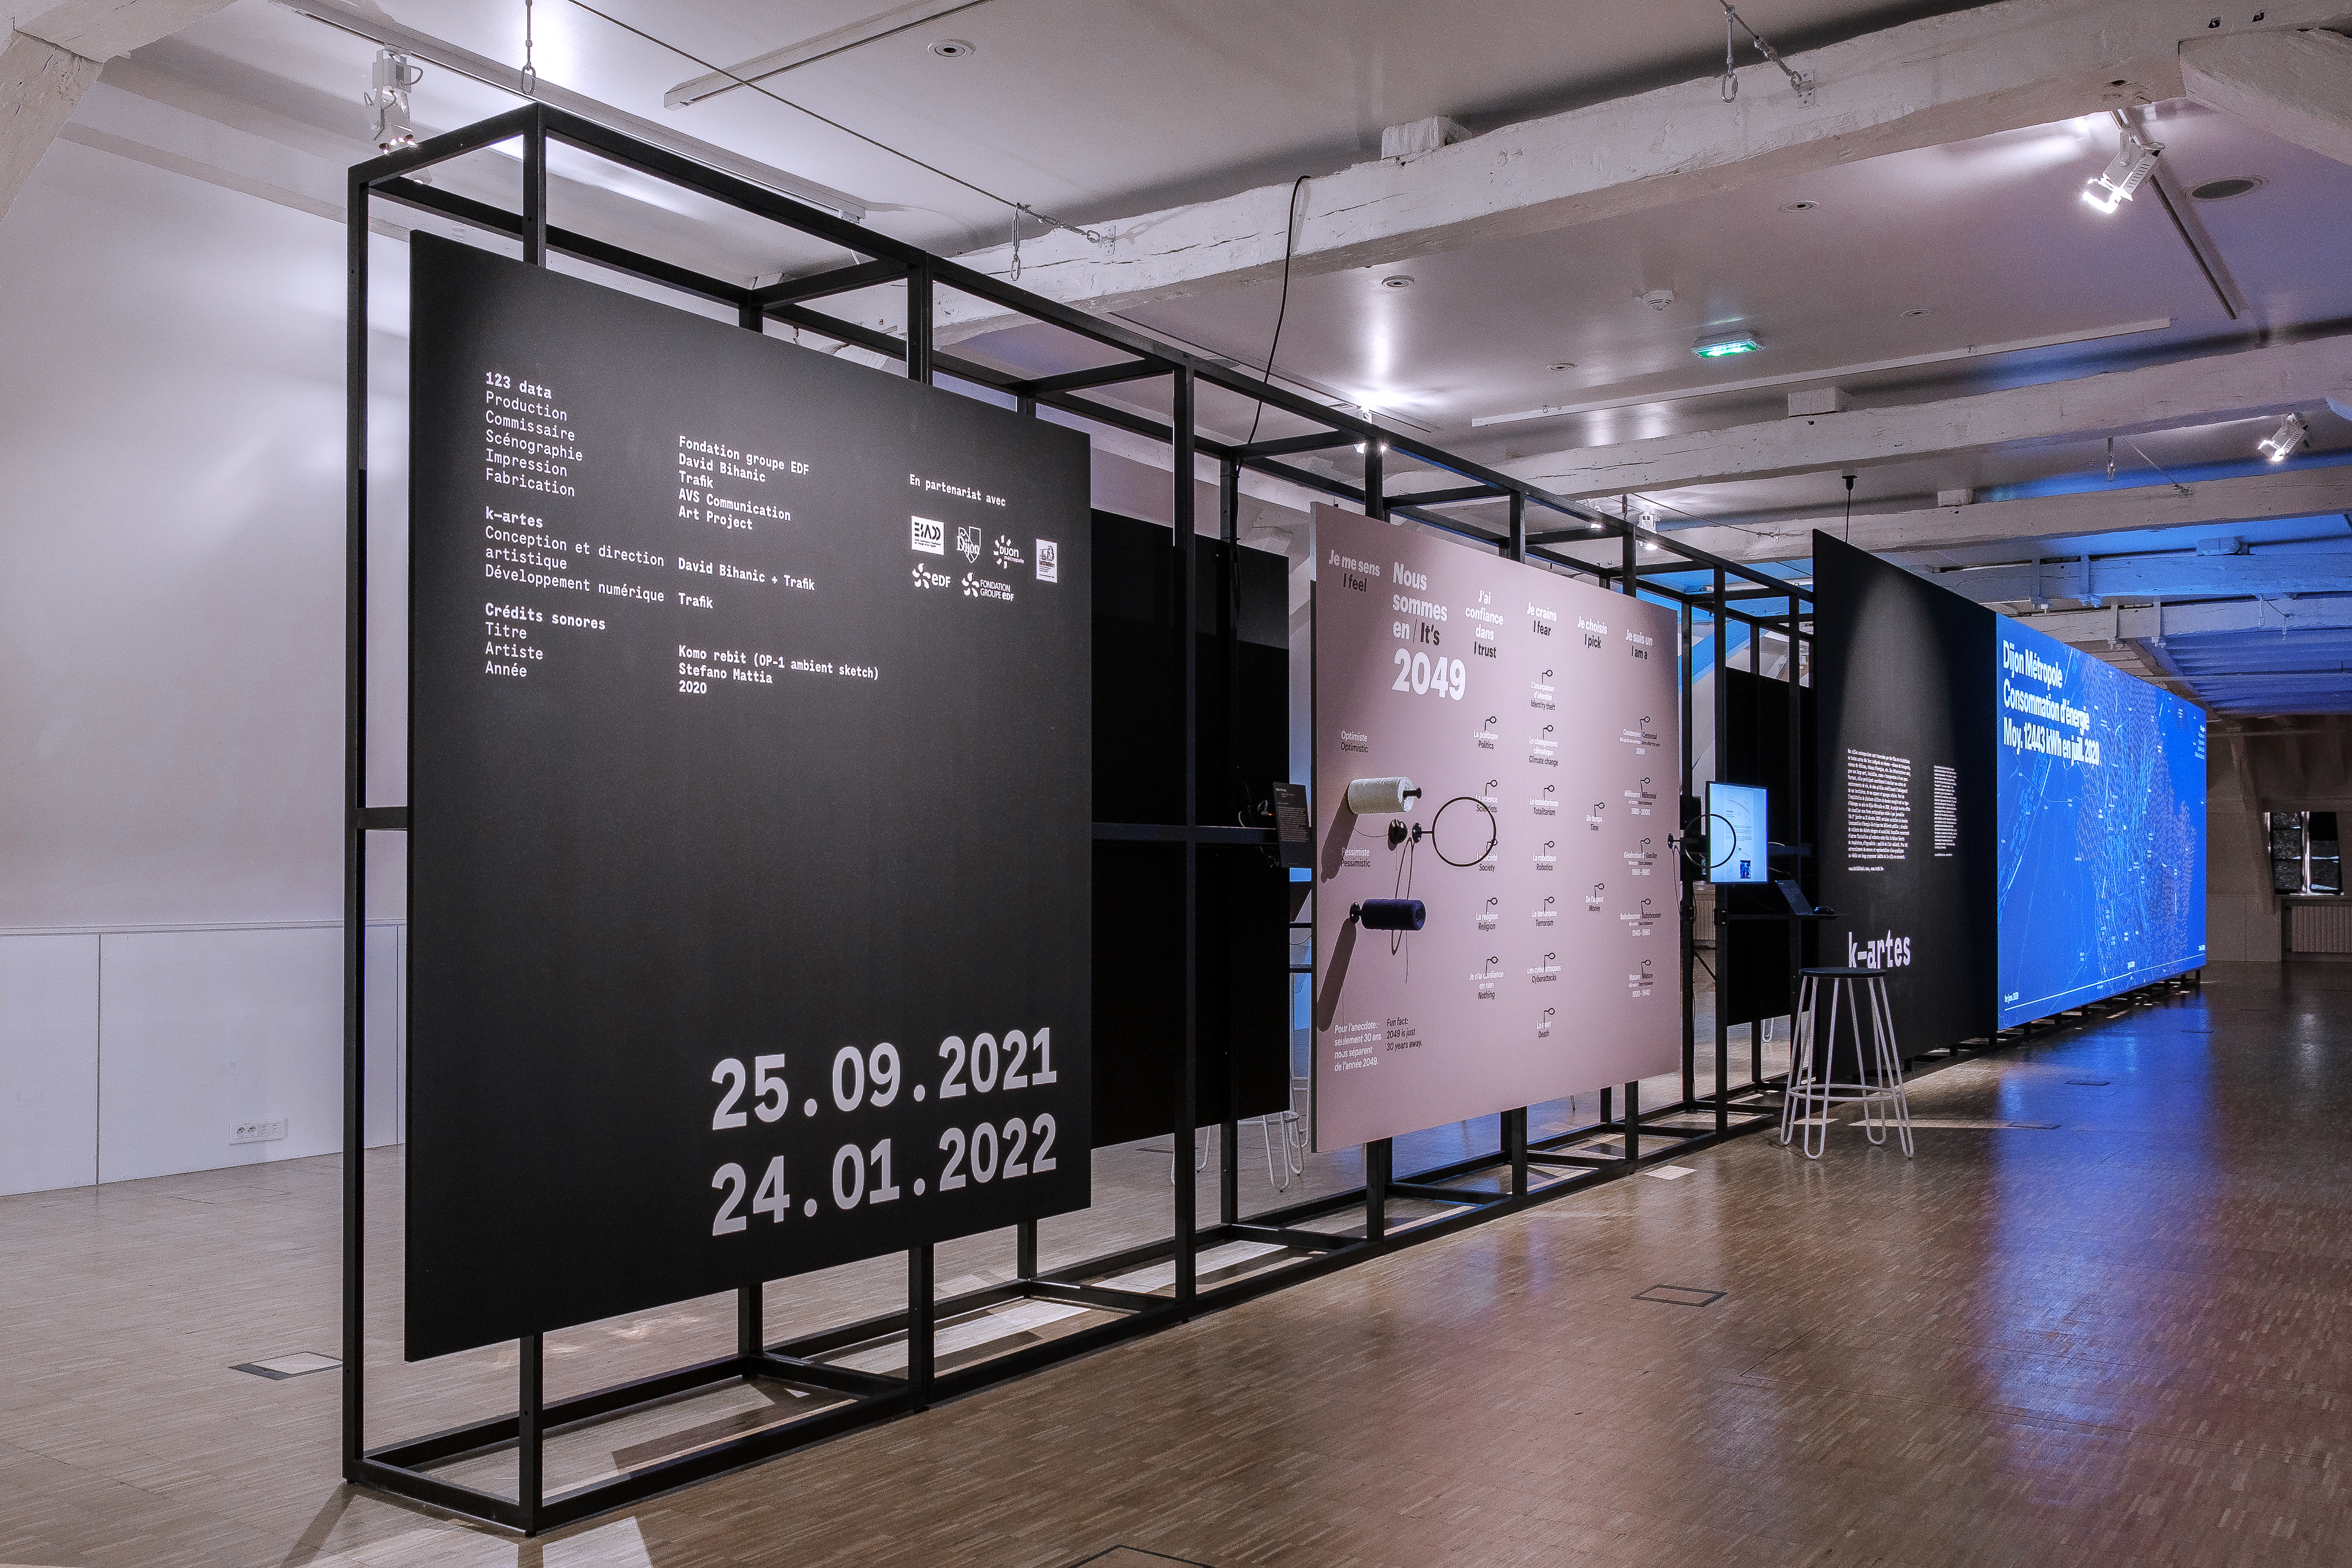
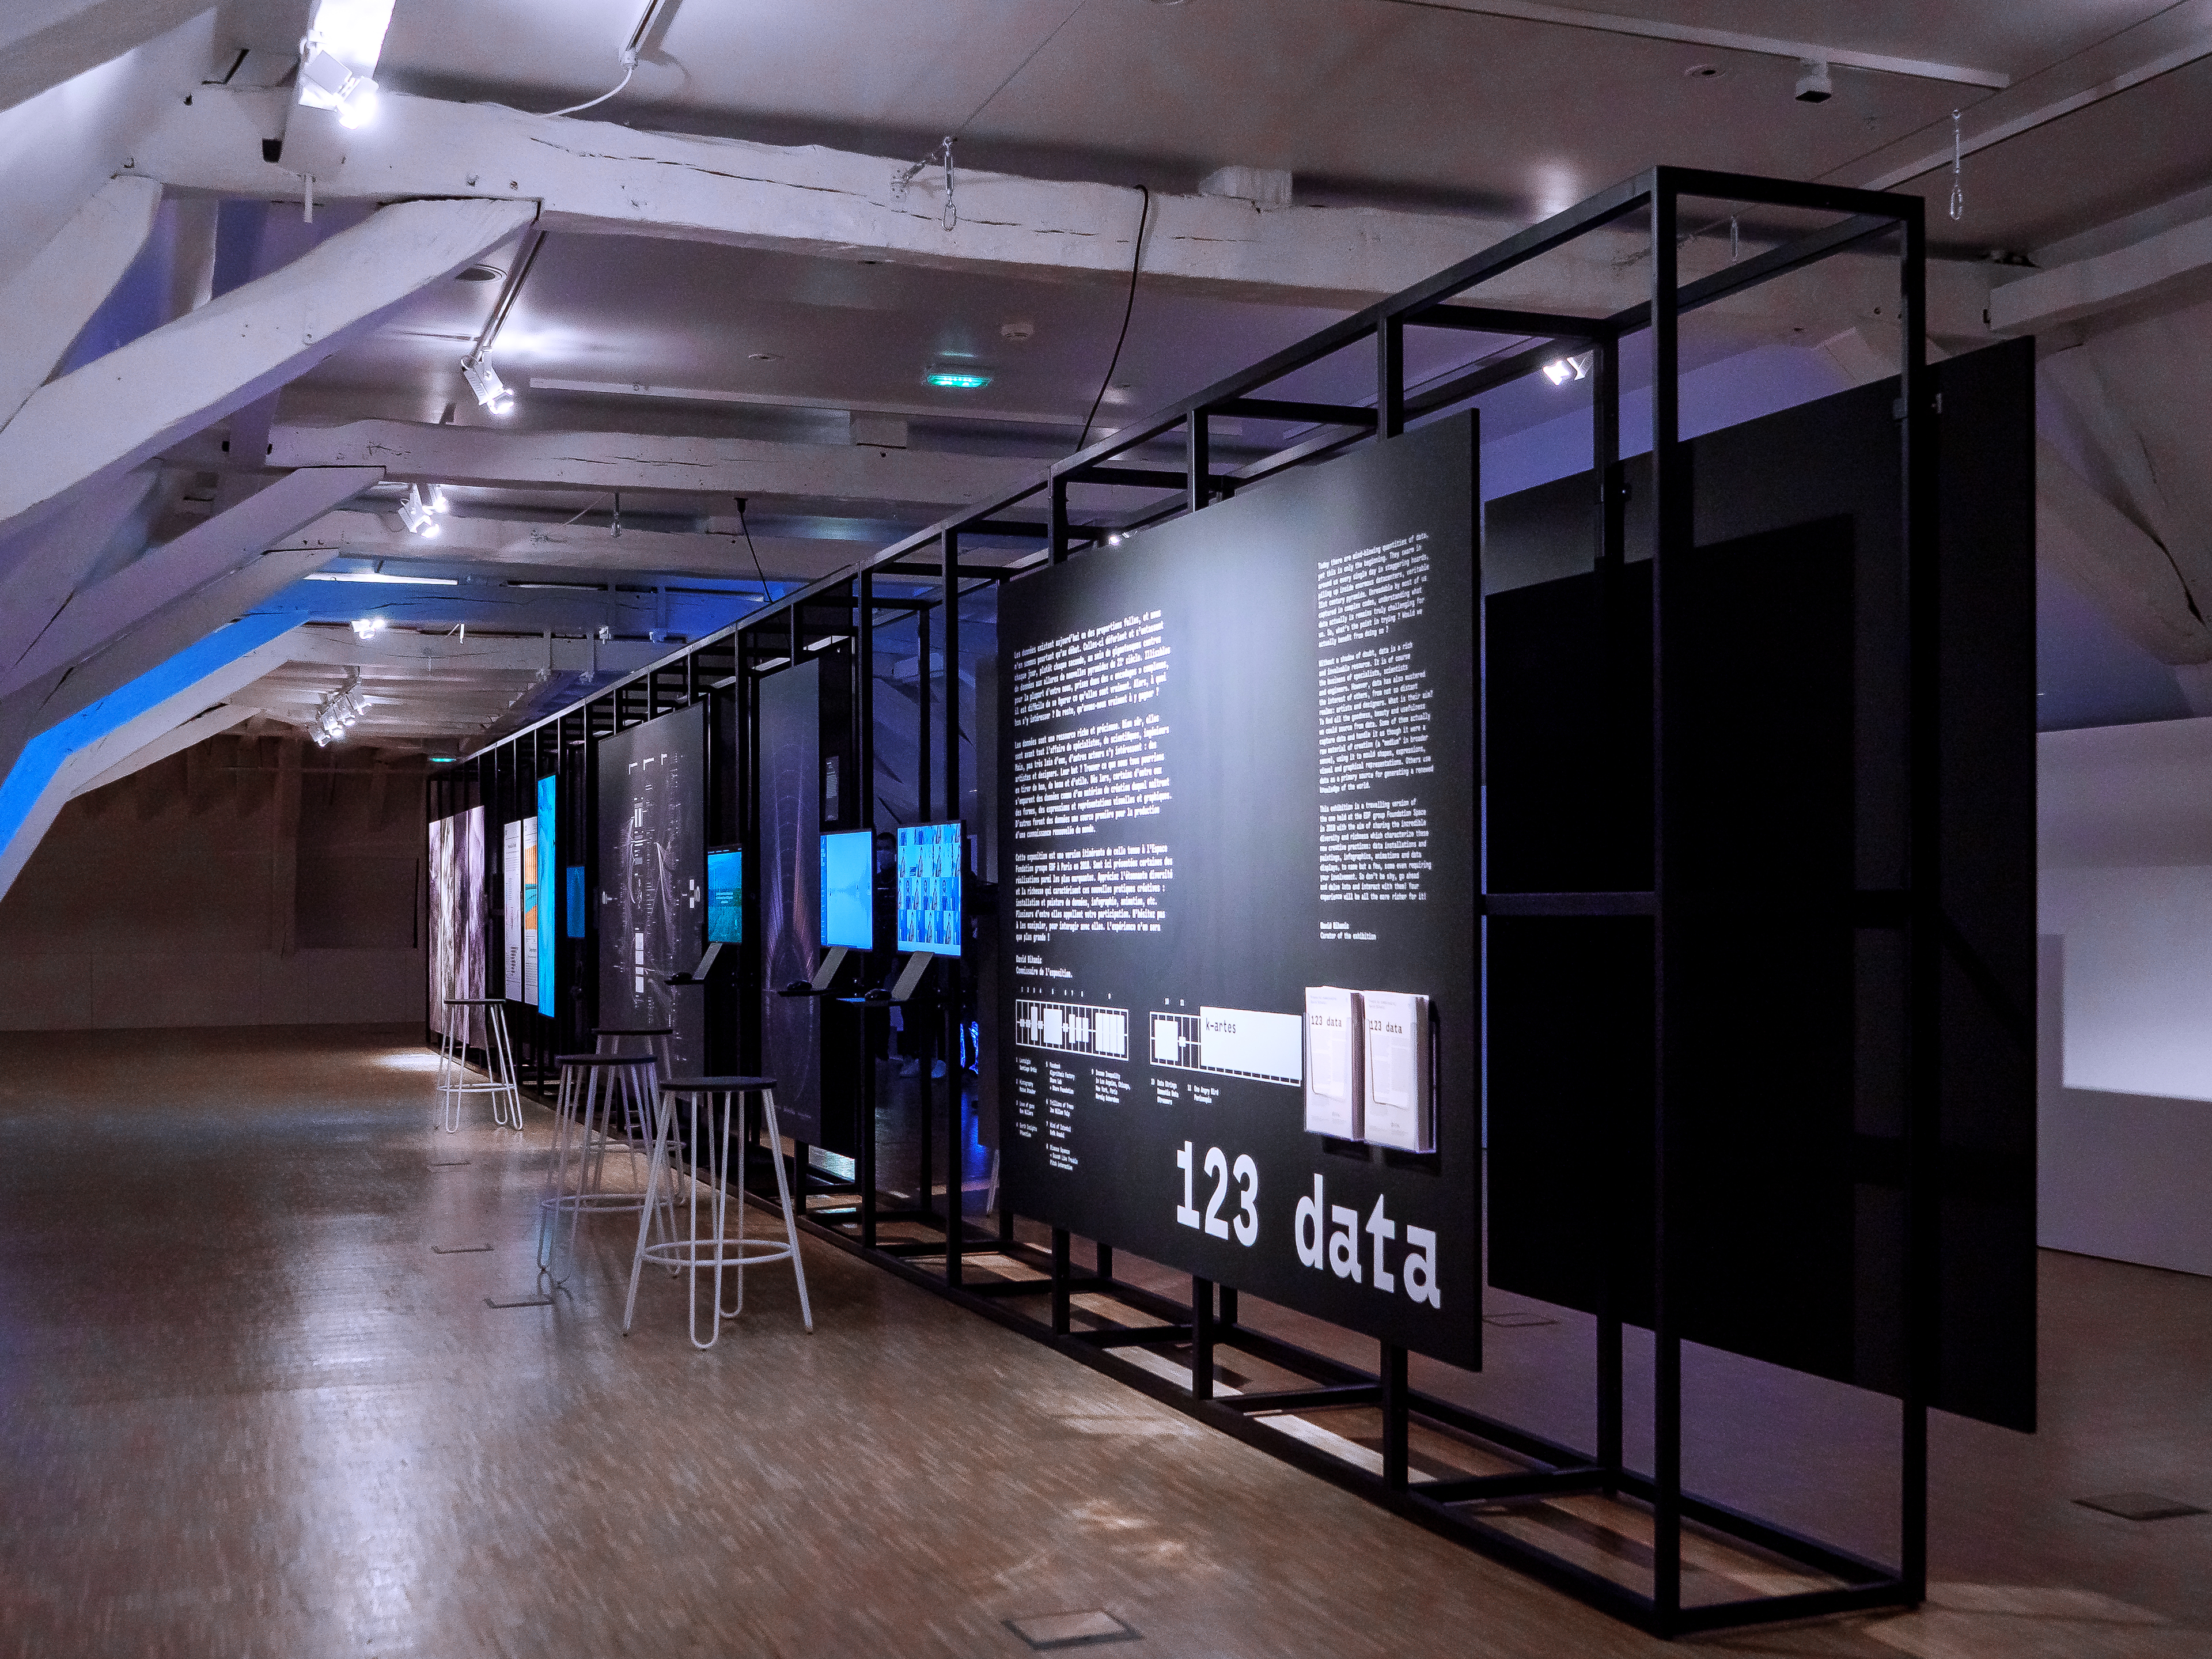
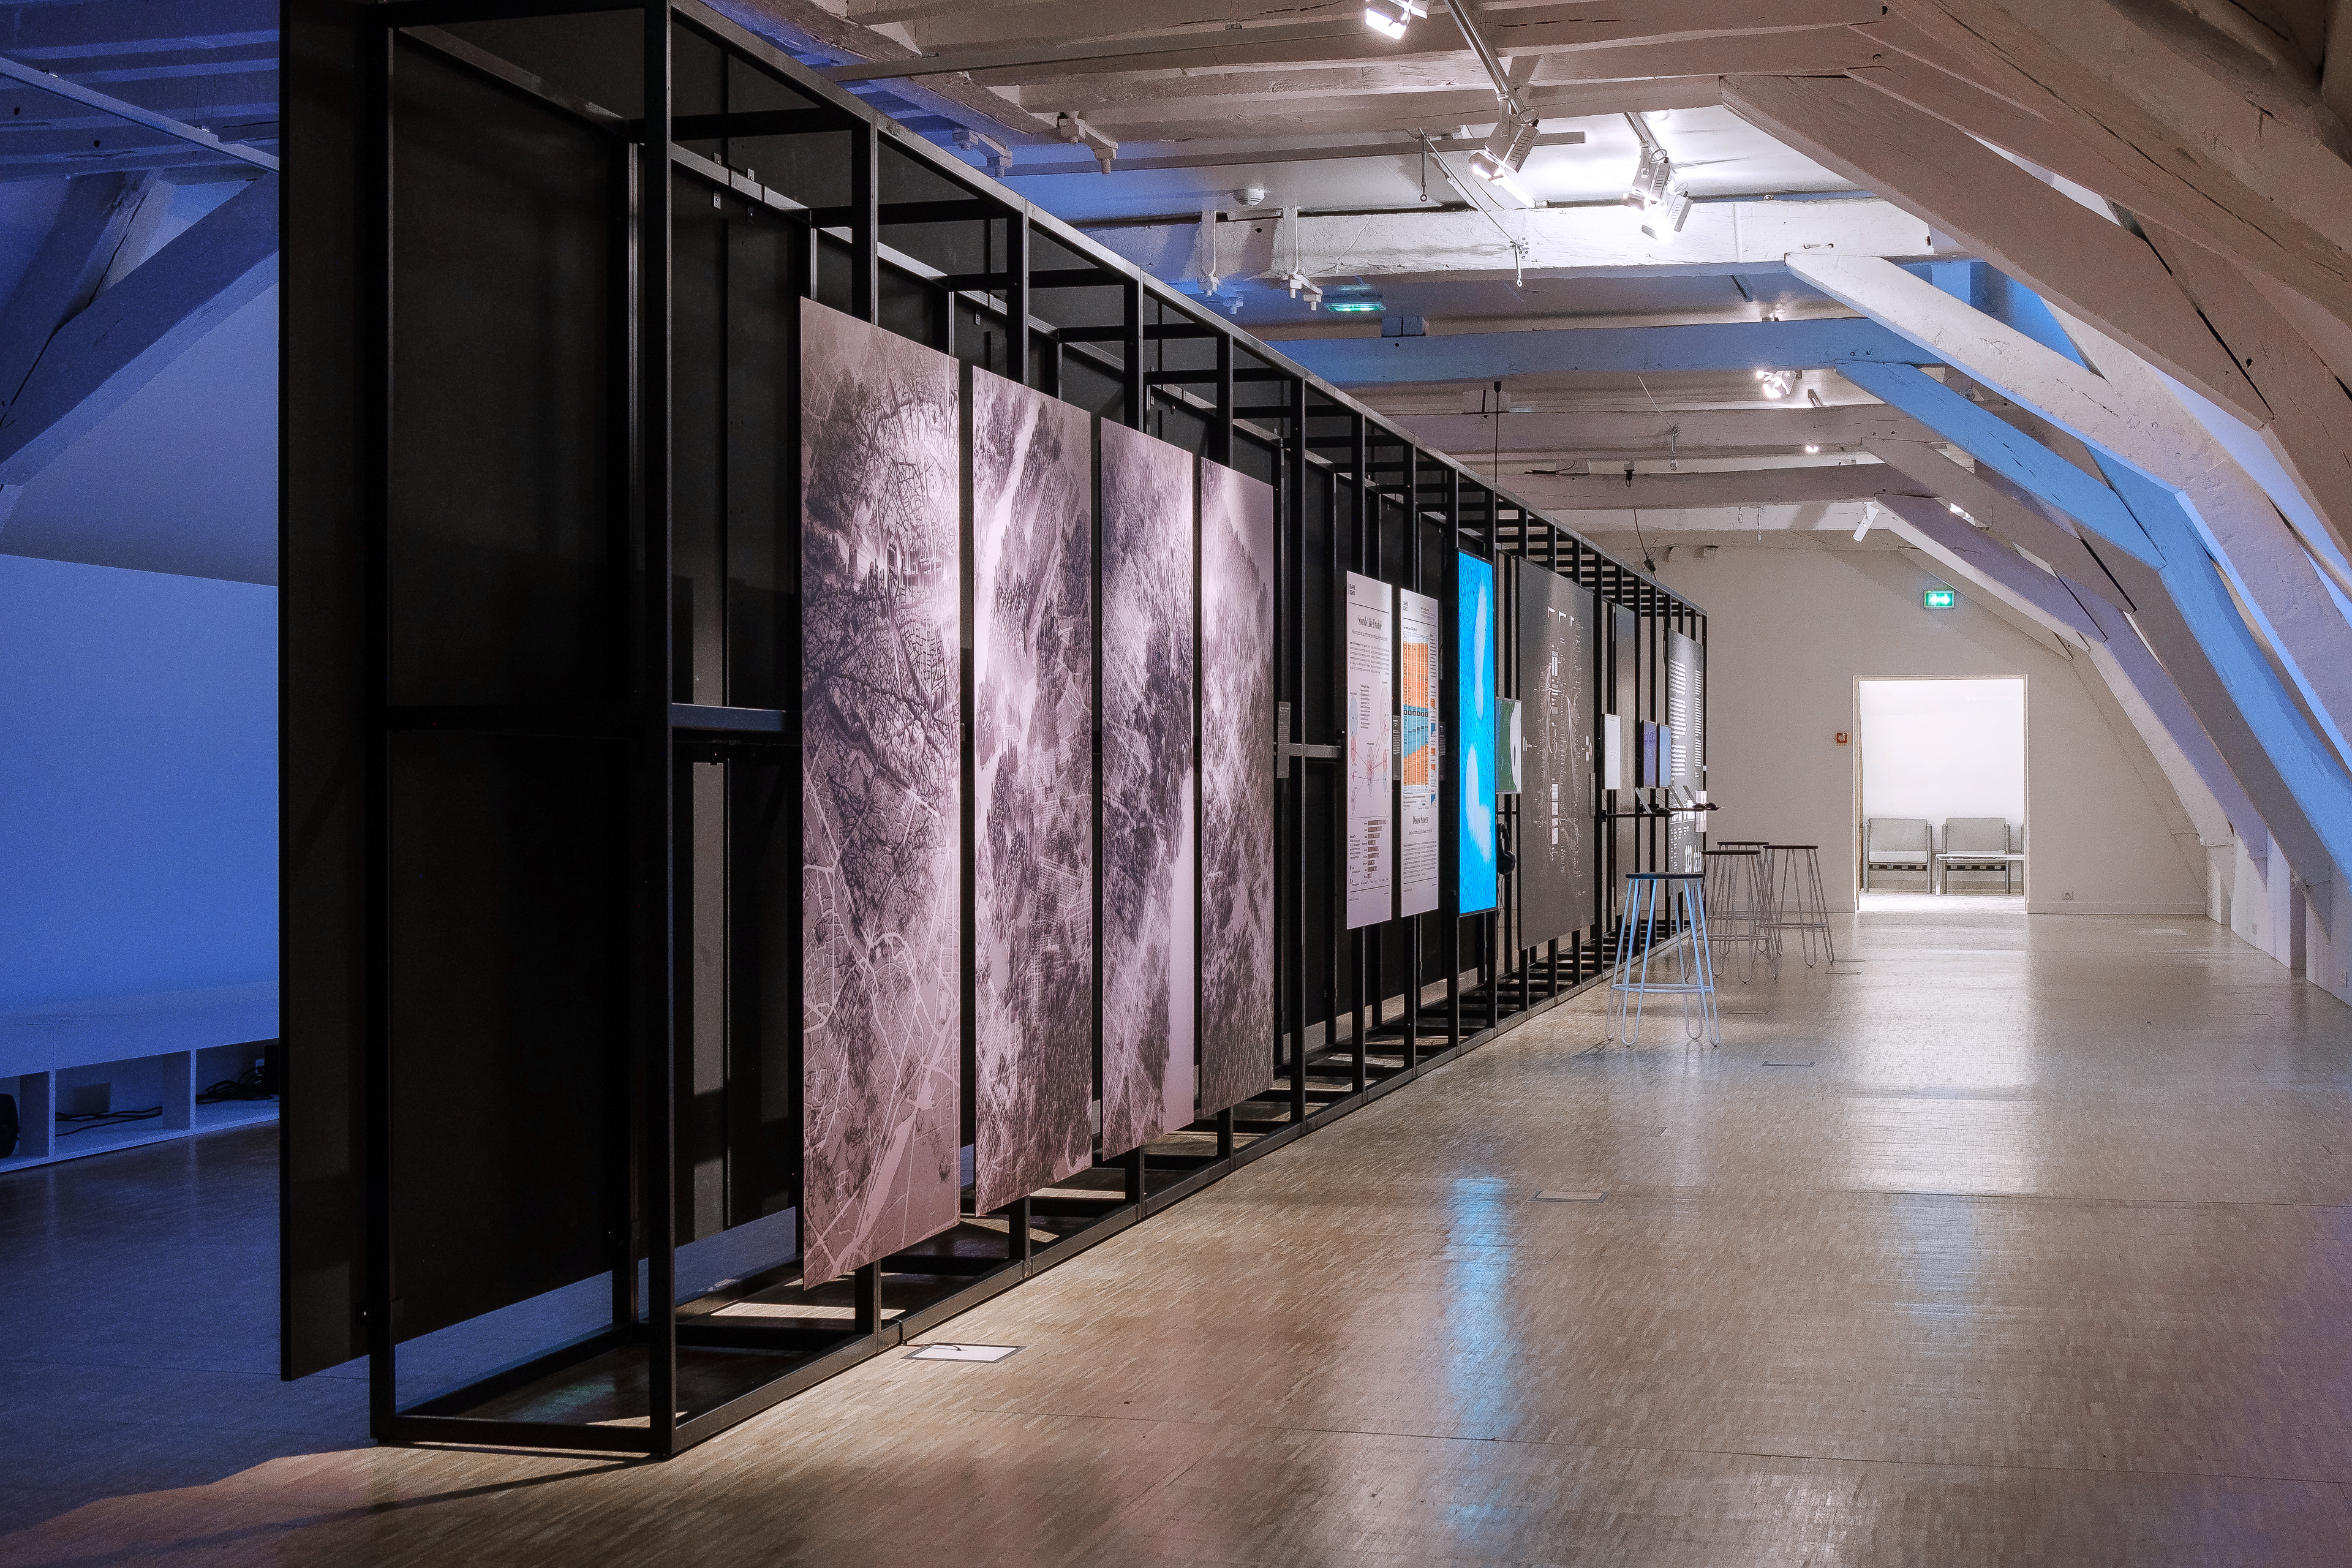
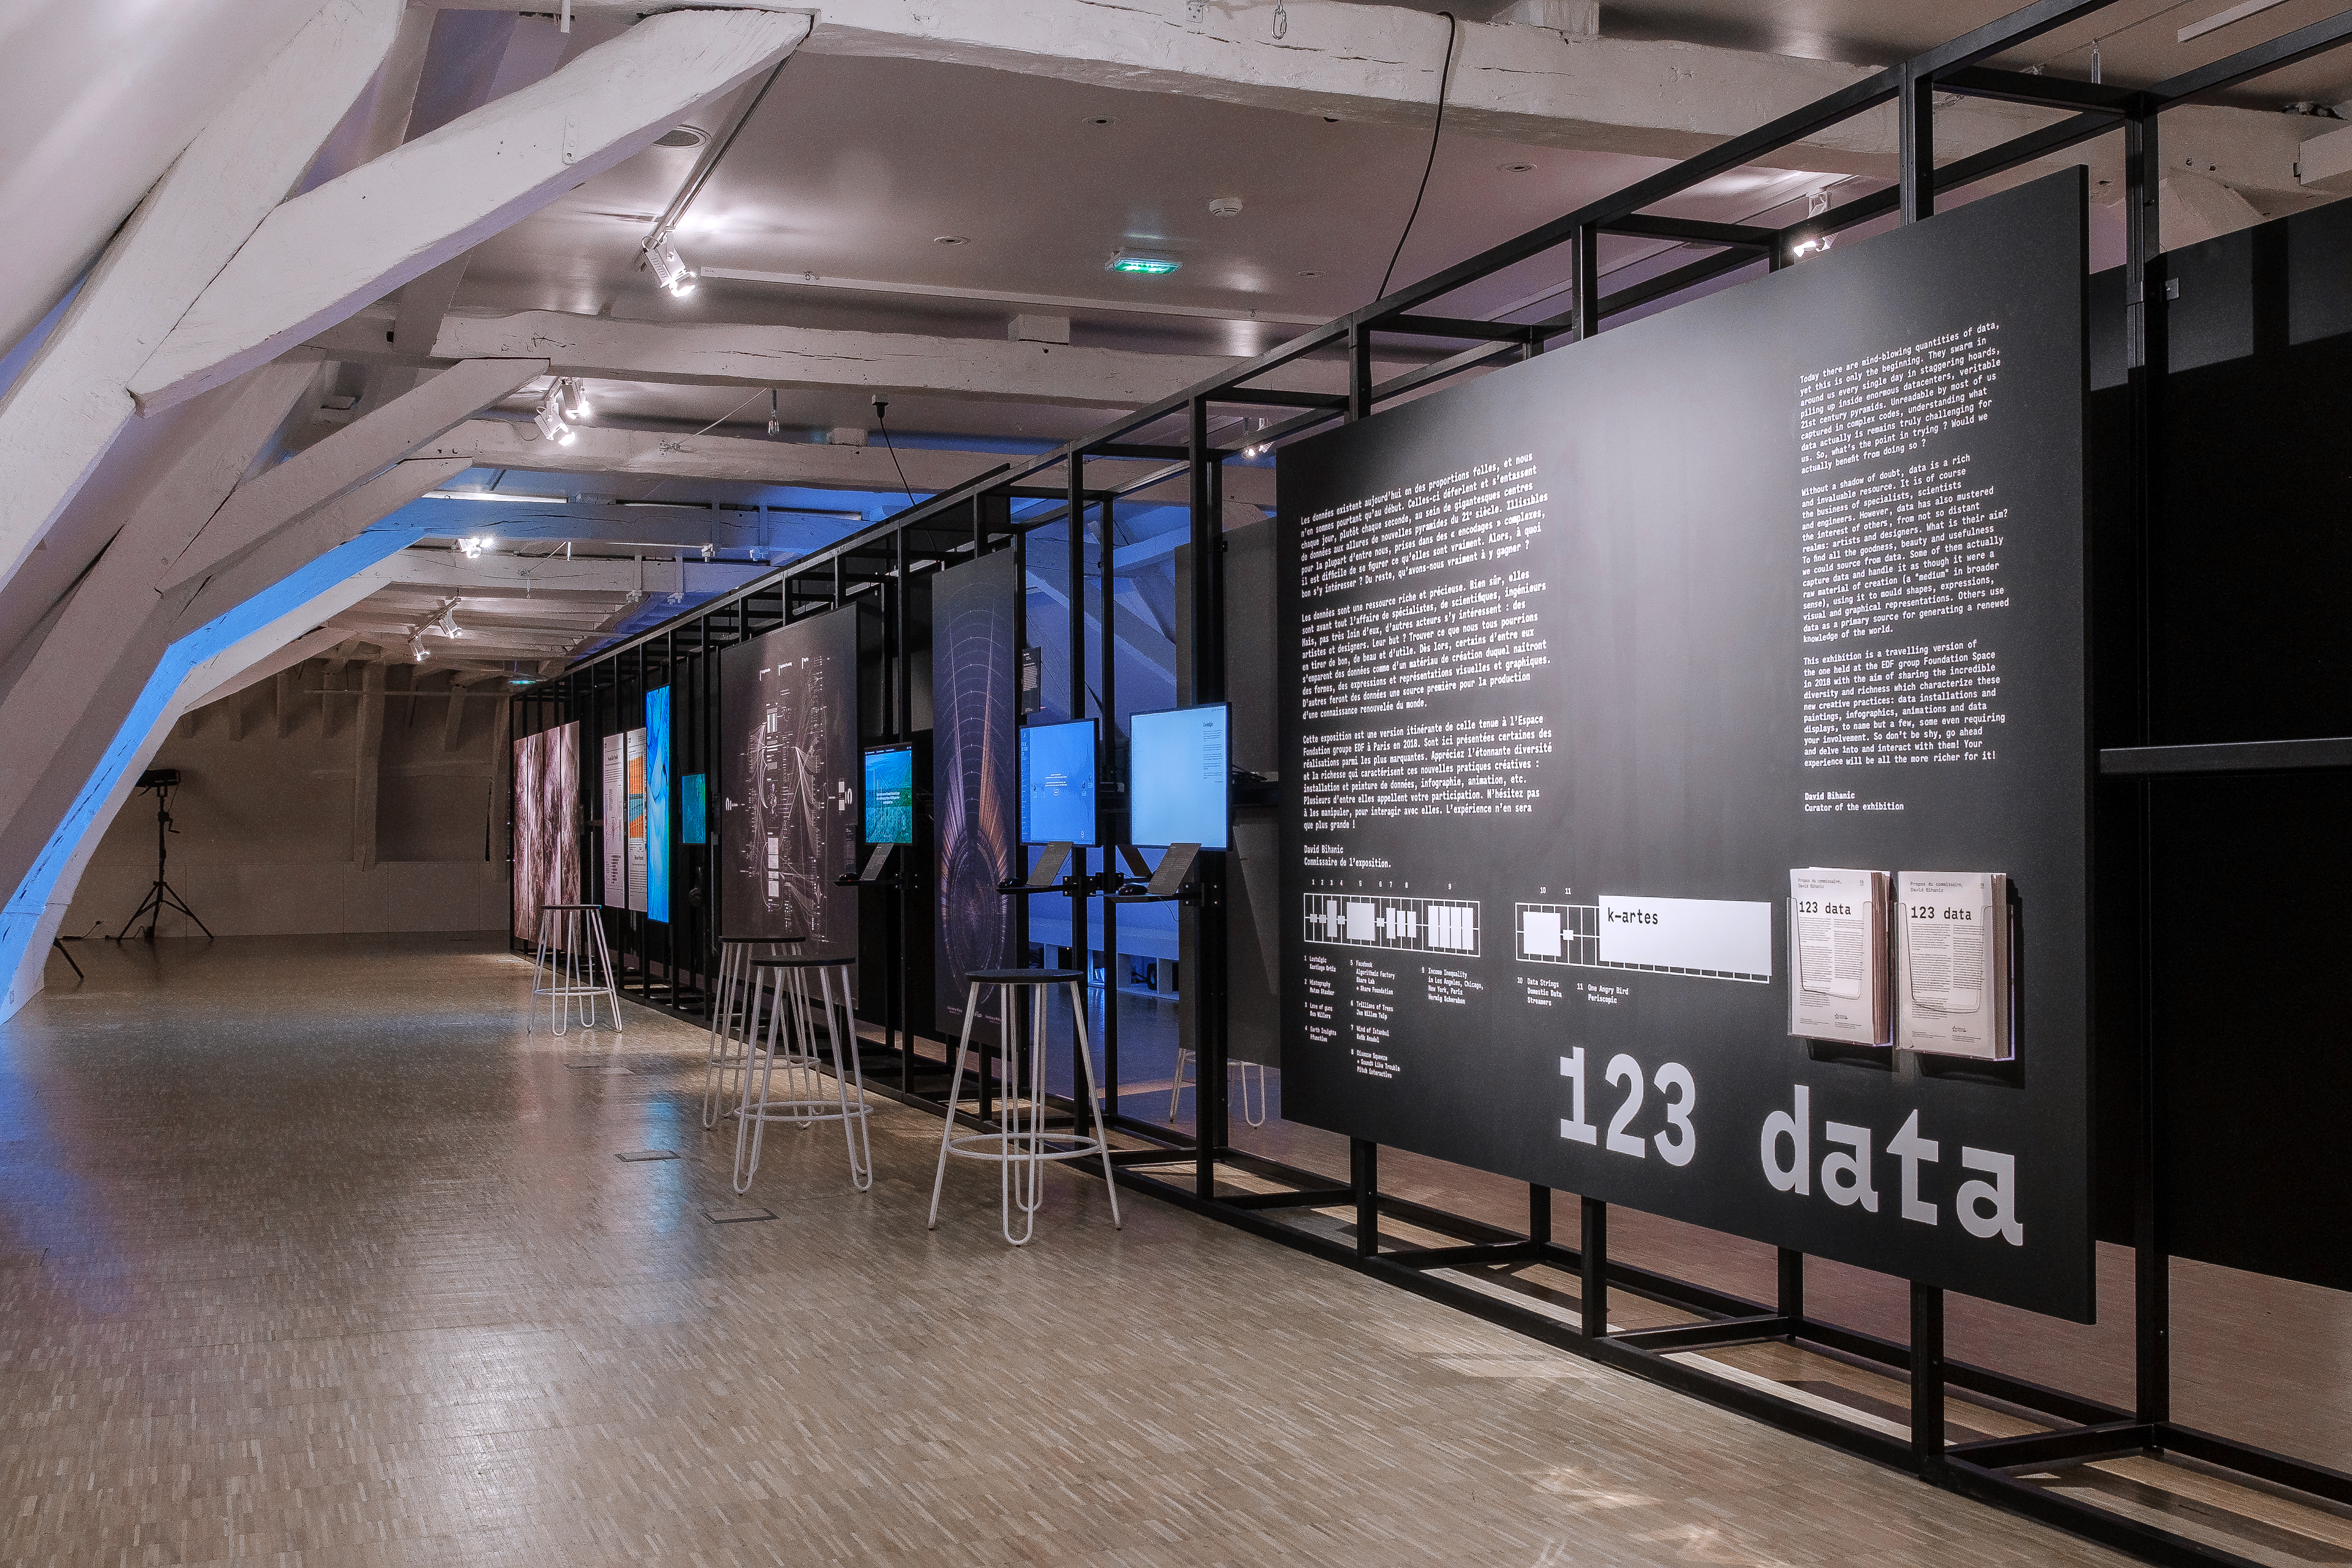
[Exhibition] “1, 2, 3 data” touring exhibition — fourth and last stage: Dijon
Coproduced by the EDF Foundation group, Dijon Métropole and the EDF Regional Delegation “Bourgogne-Franche-Comté”, this fourth and last edition of the “1,2,3 data” touring exhibition has taken place at the the Museum of Burgundian Life in Dijon (from September 25, 2021 to January 29, 2022). This exhibit was part of the official program of Festival of Transitions (which dealing issues at the interface between the digital and ecological transitions). This exhbition includes the “k—artes” project designed and developped in collaboration with the Trafik studio.