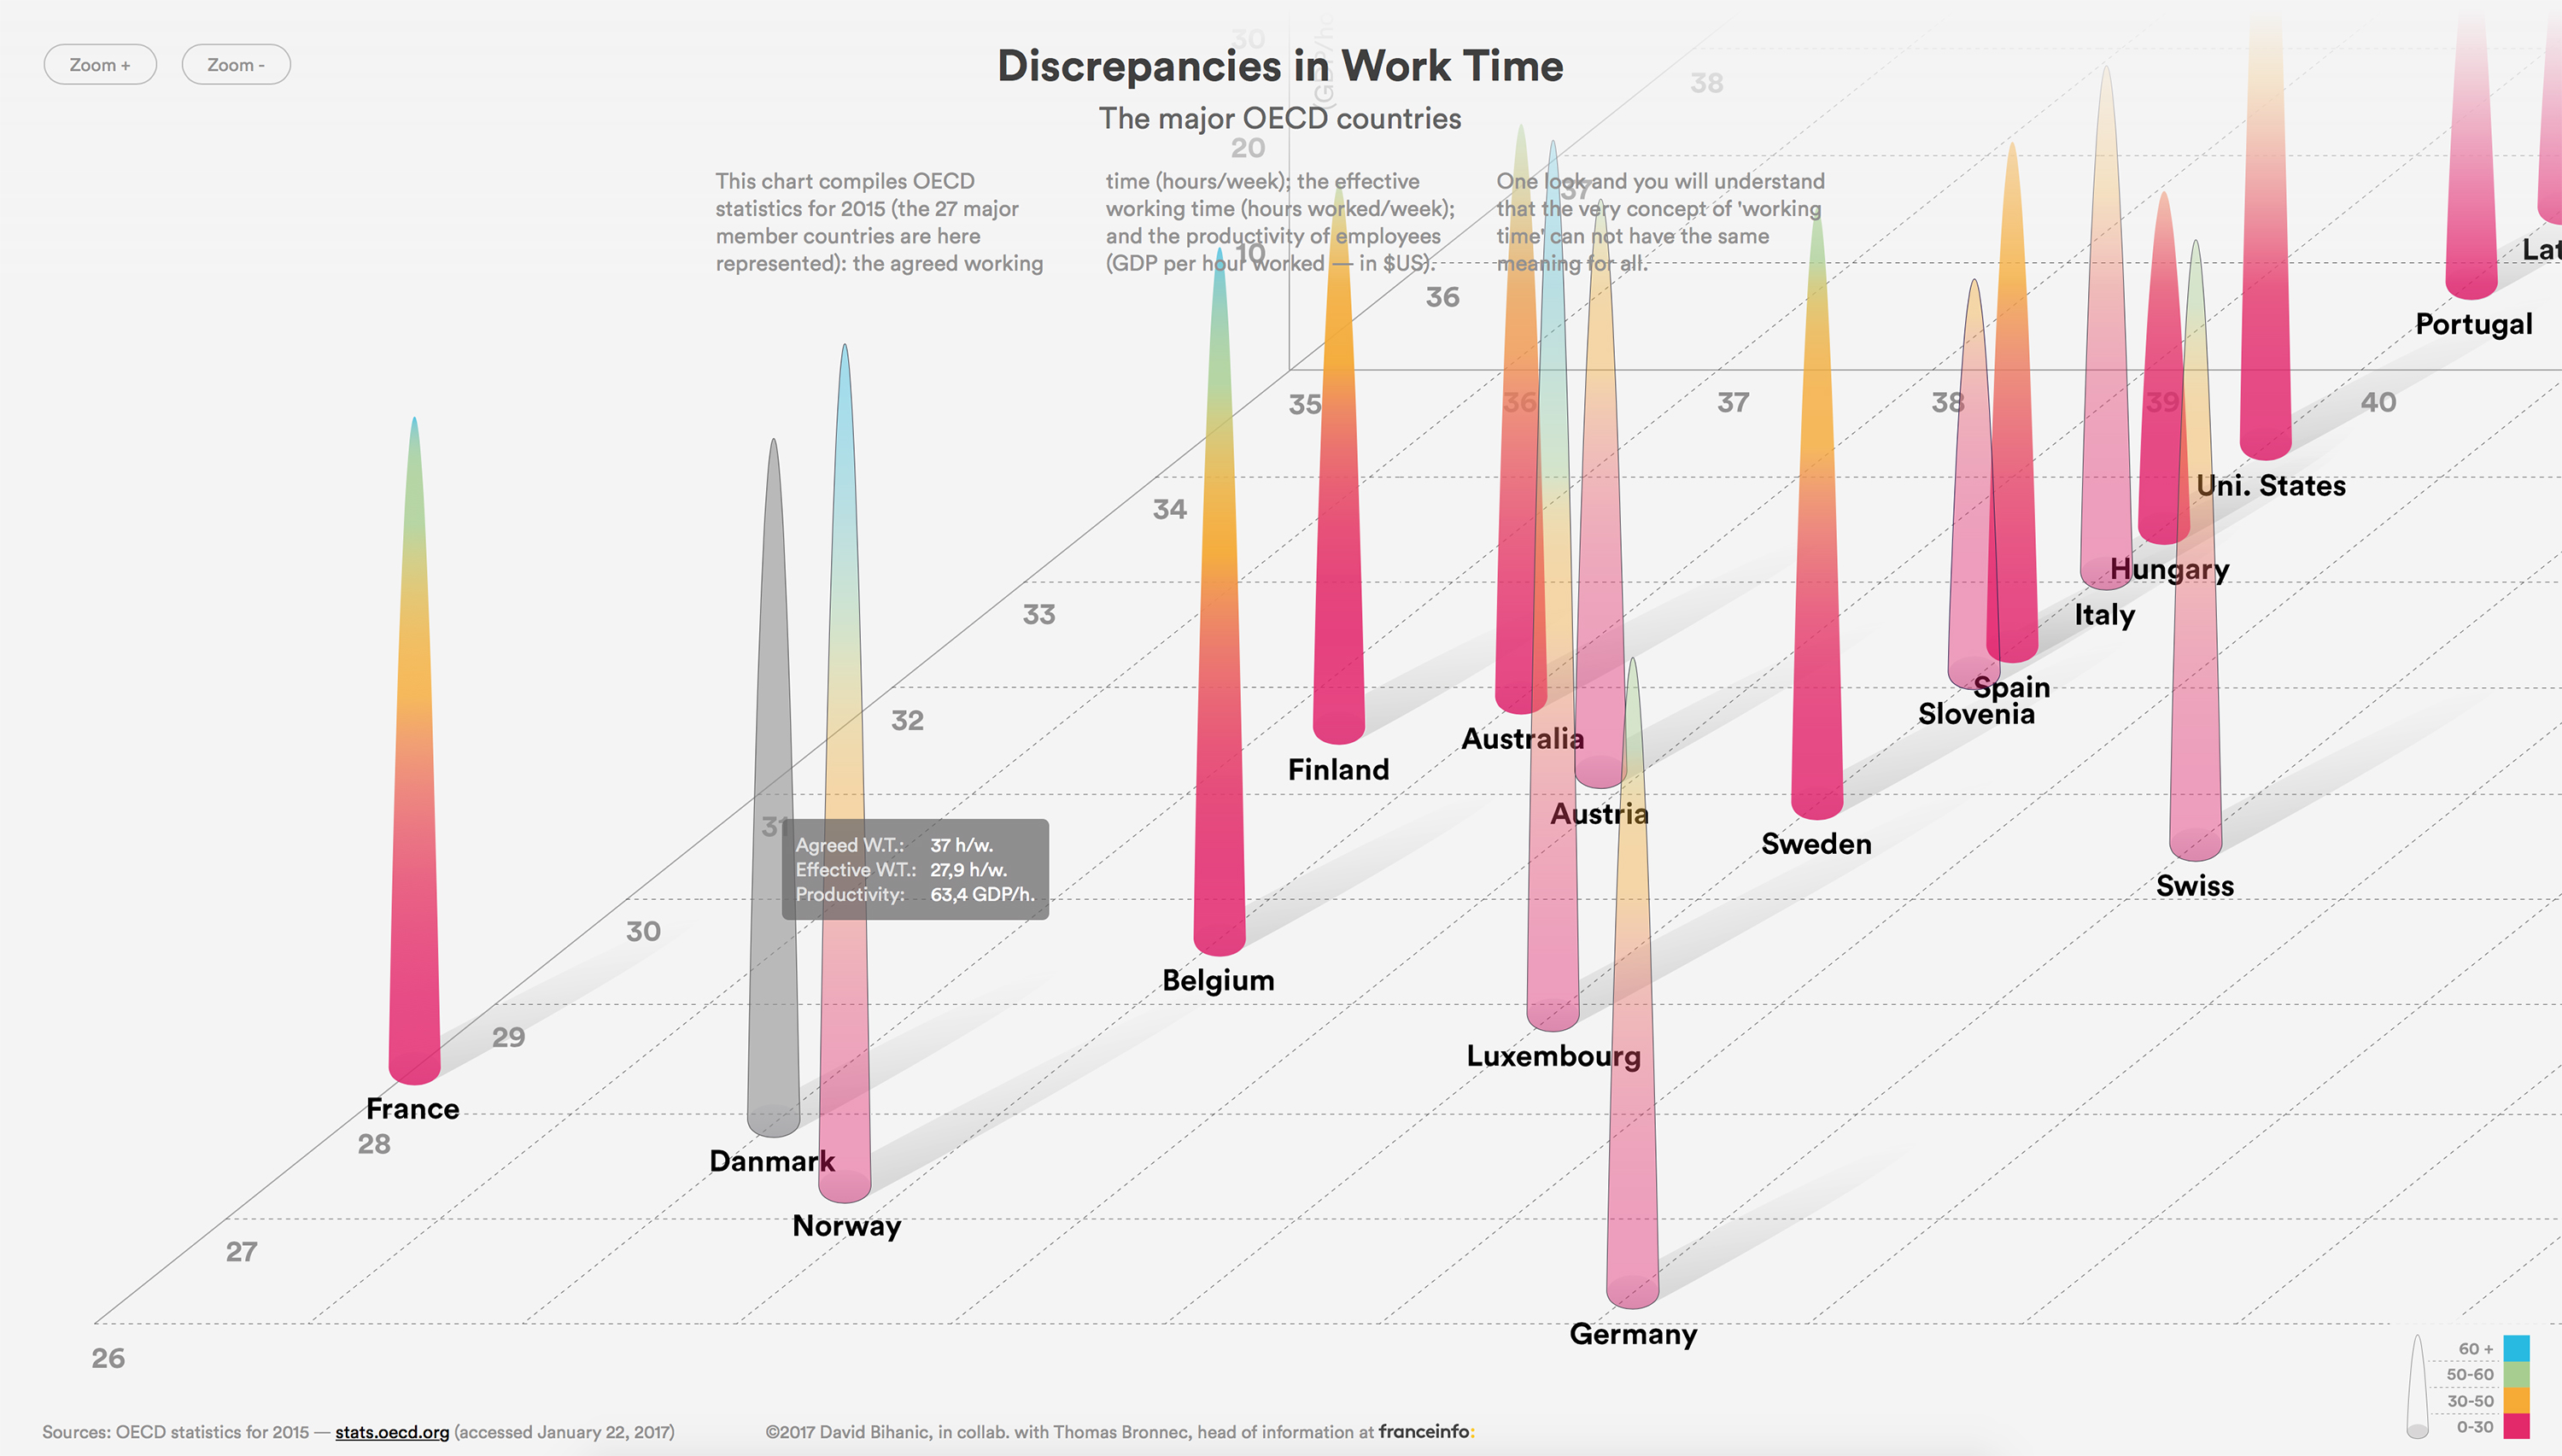
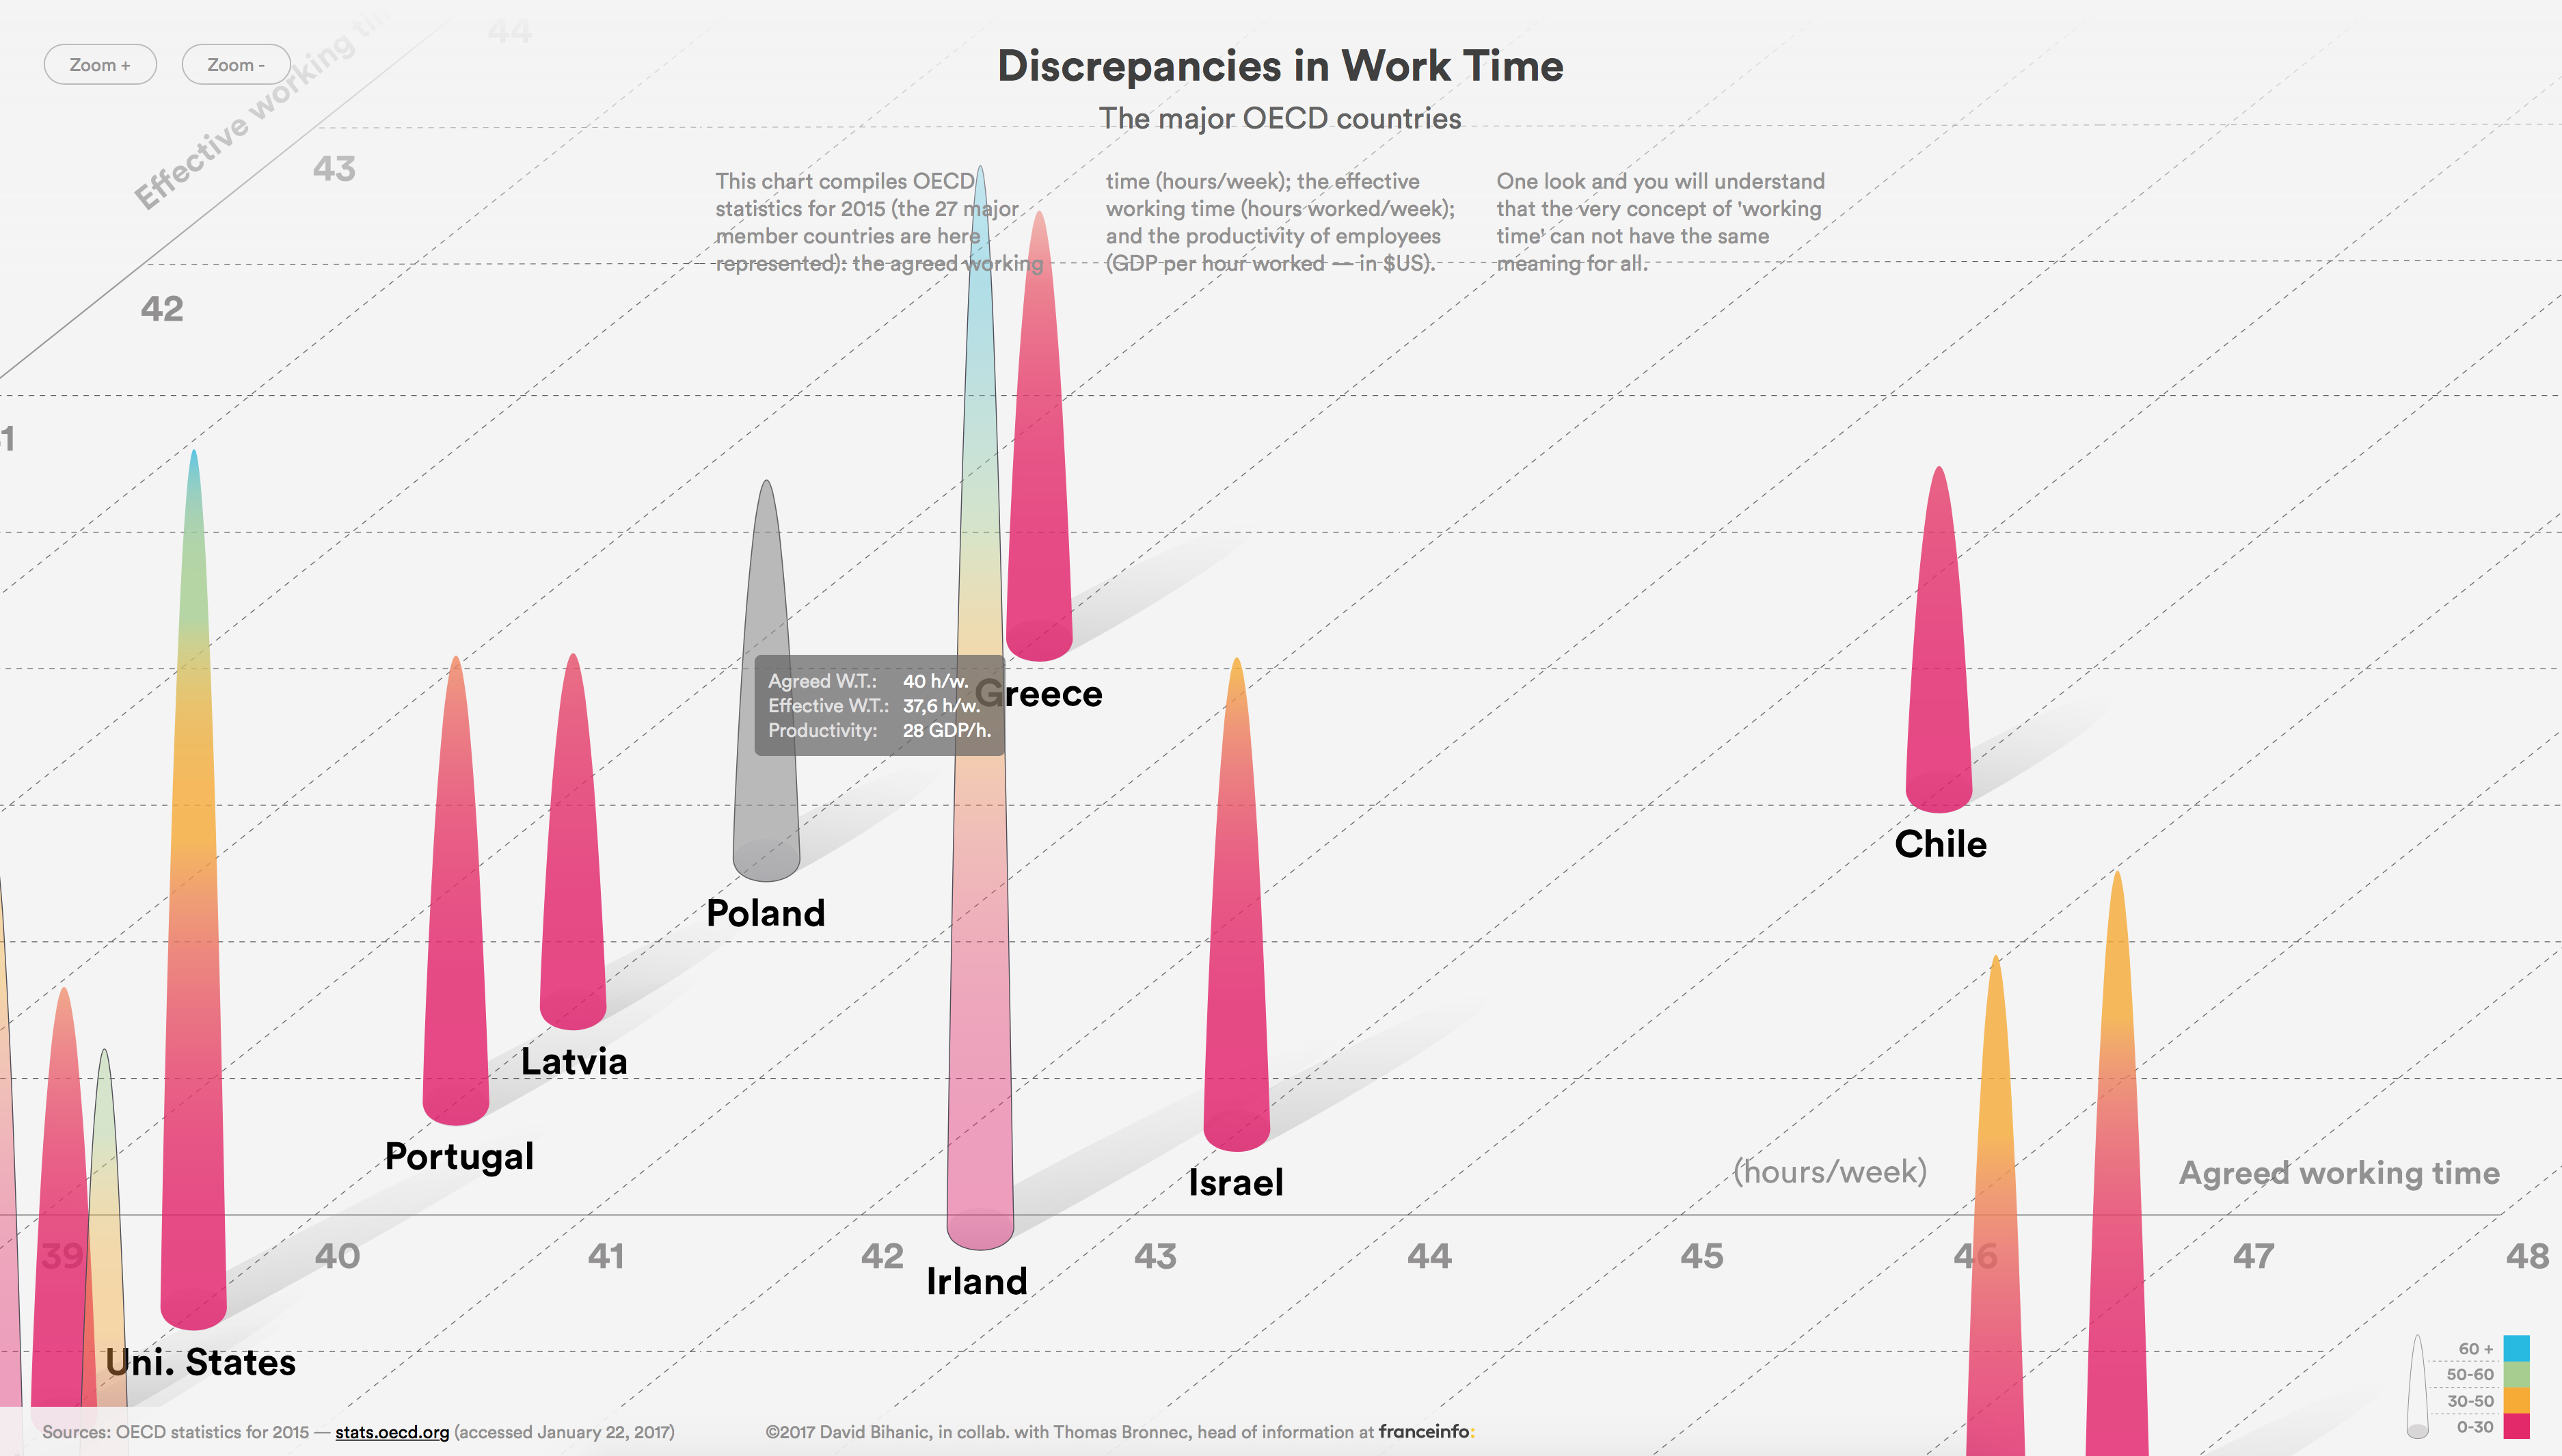
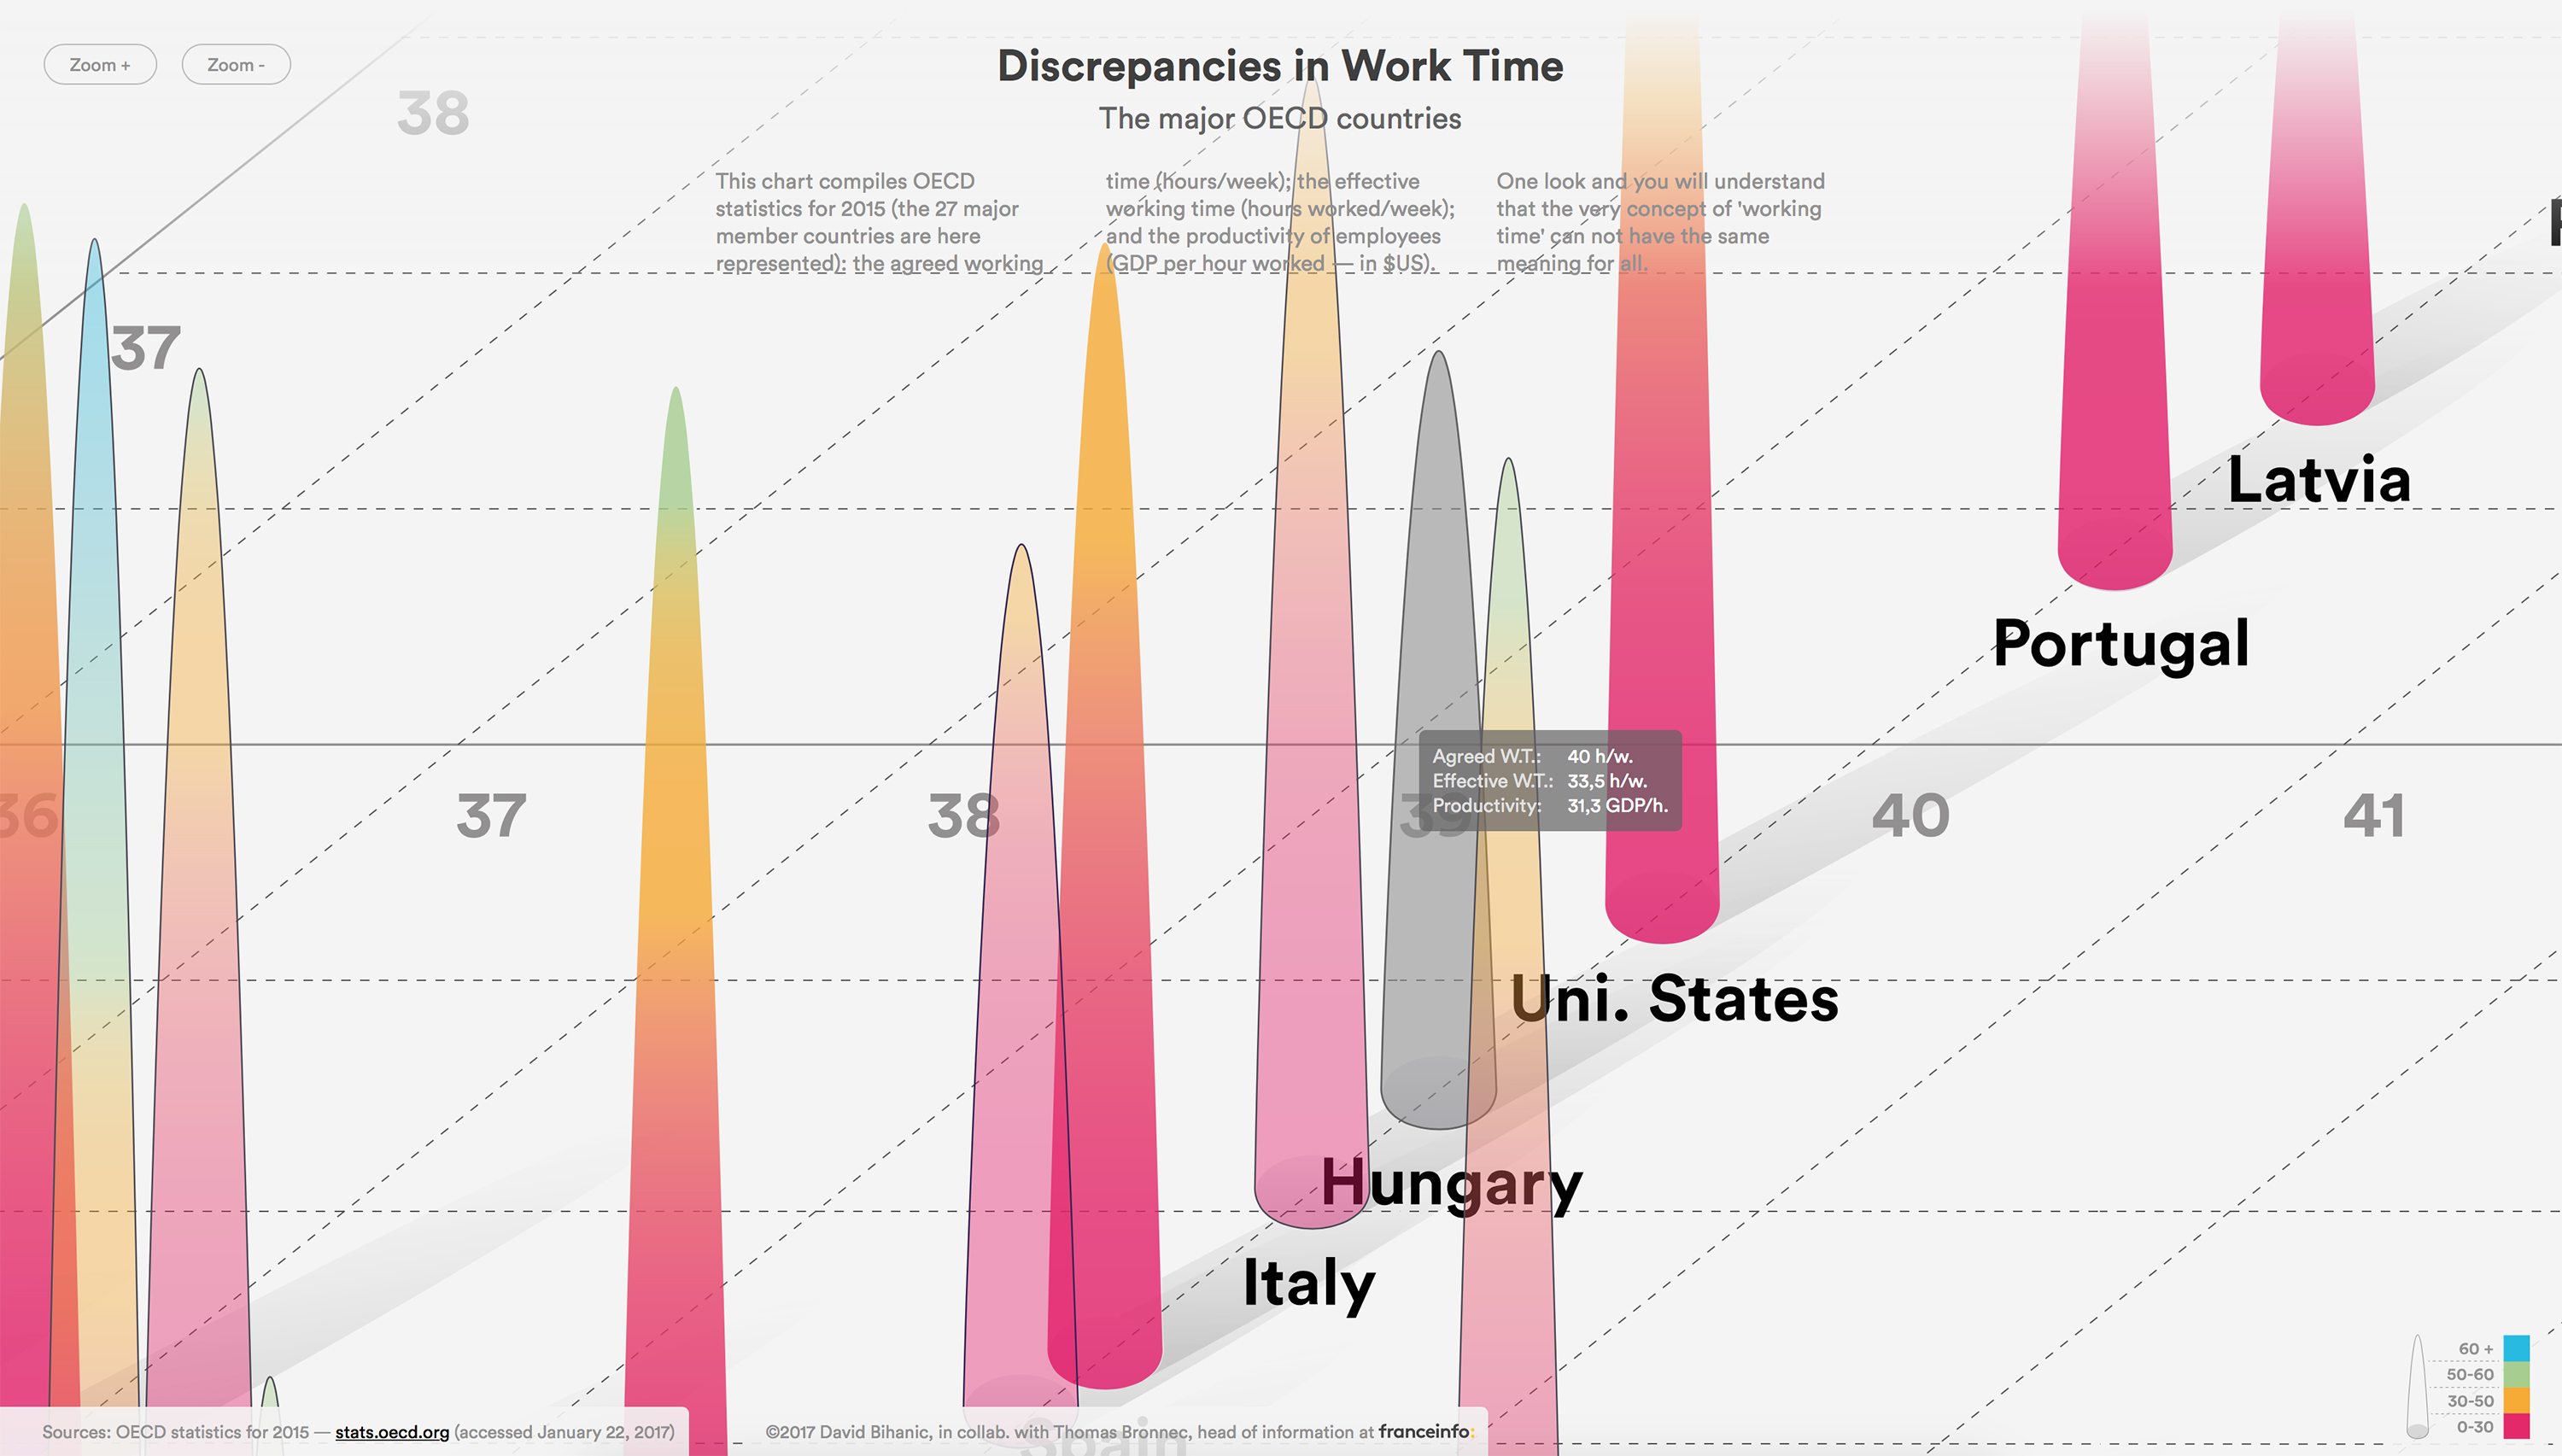
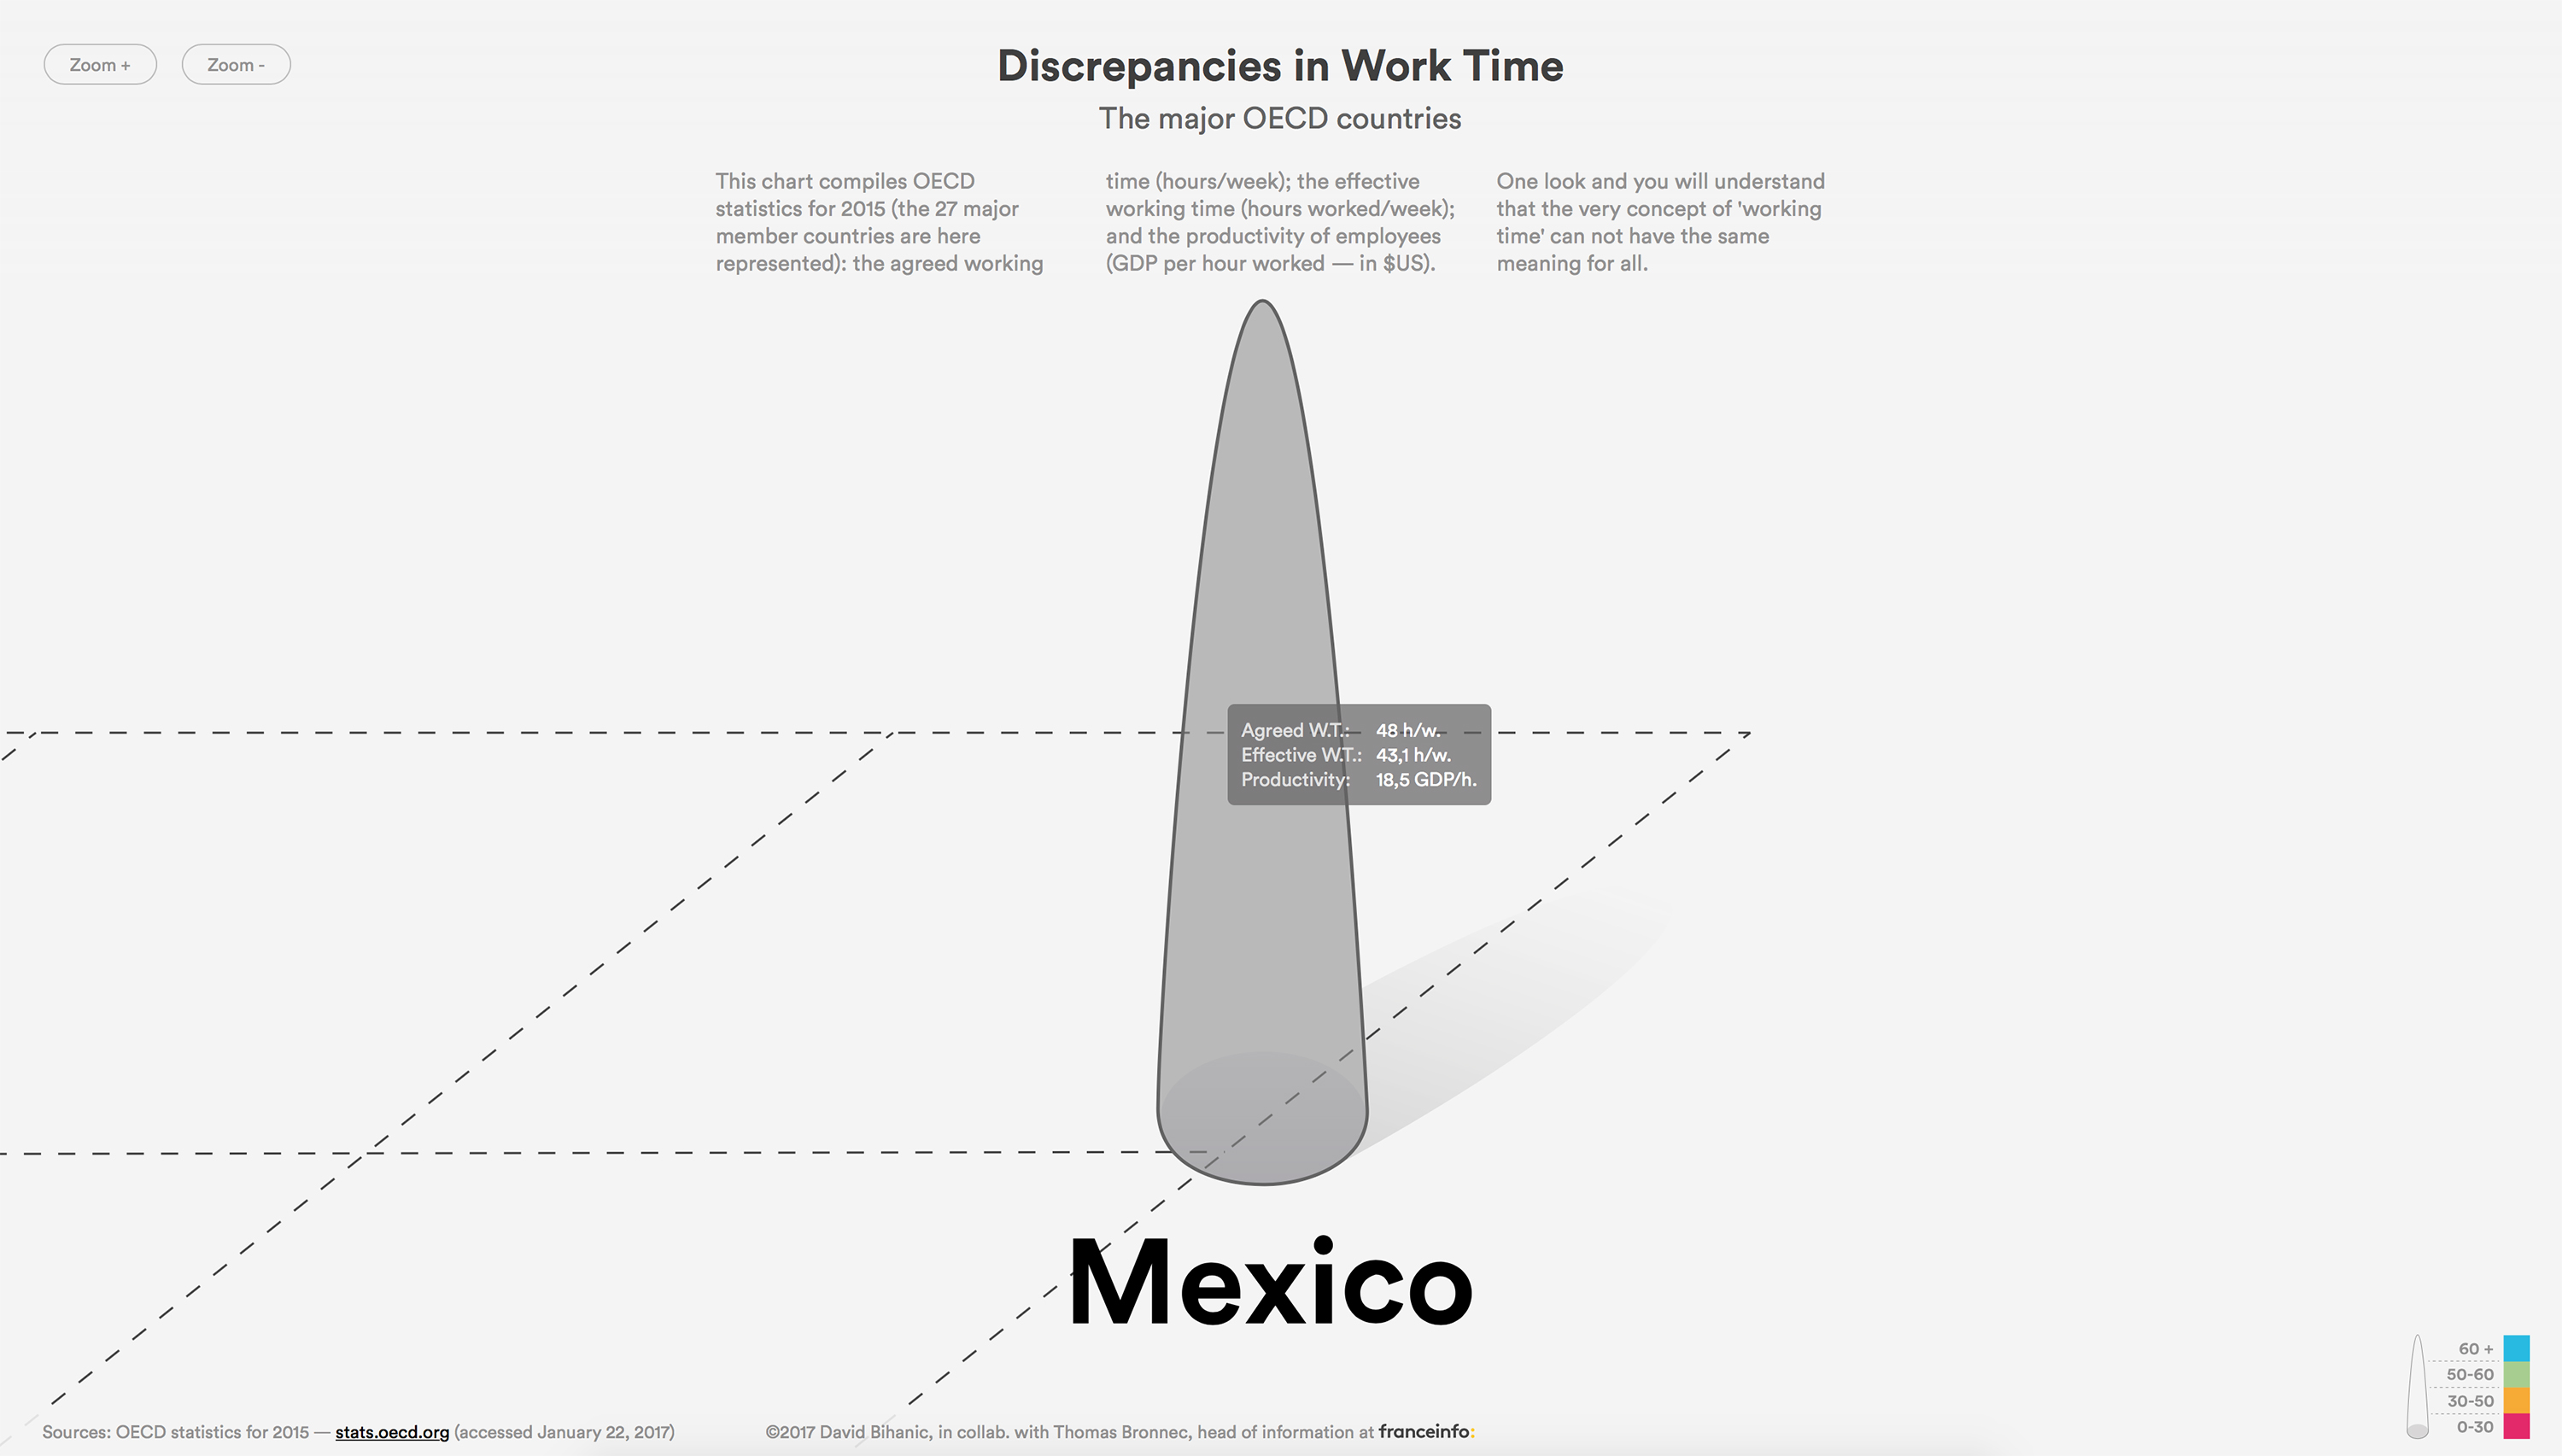
The major OECD countries
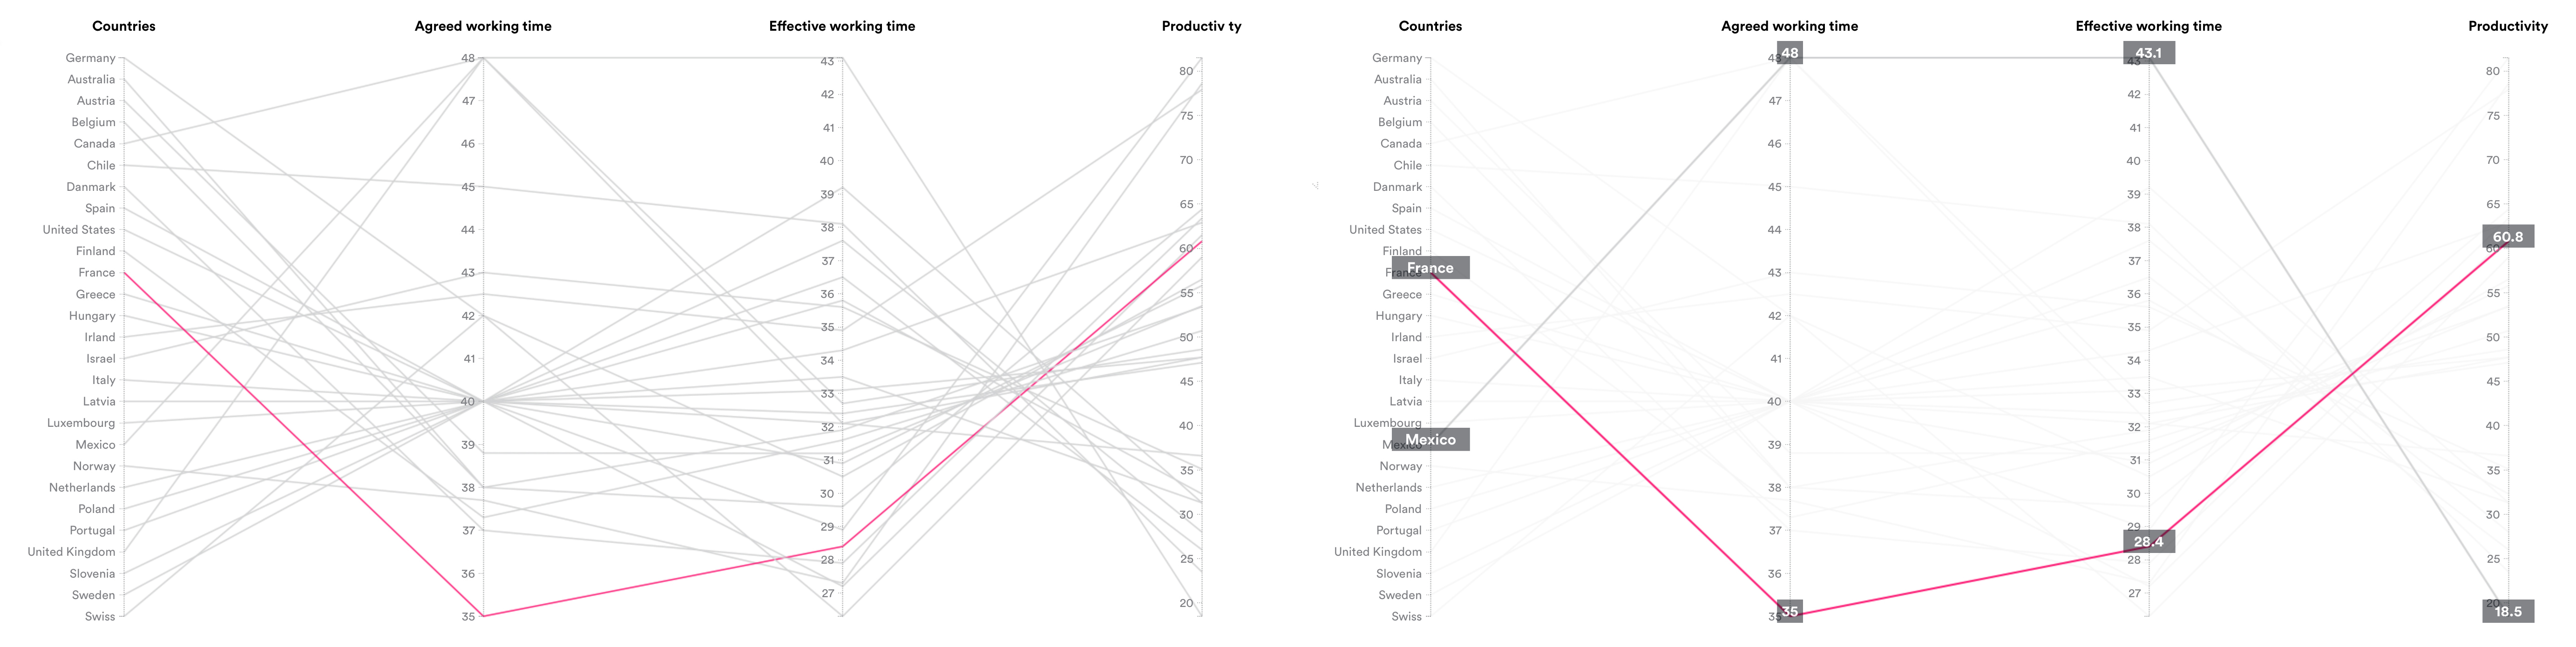
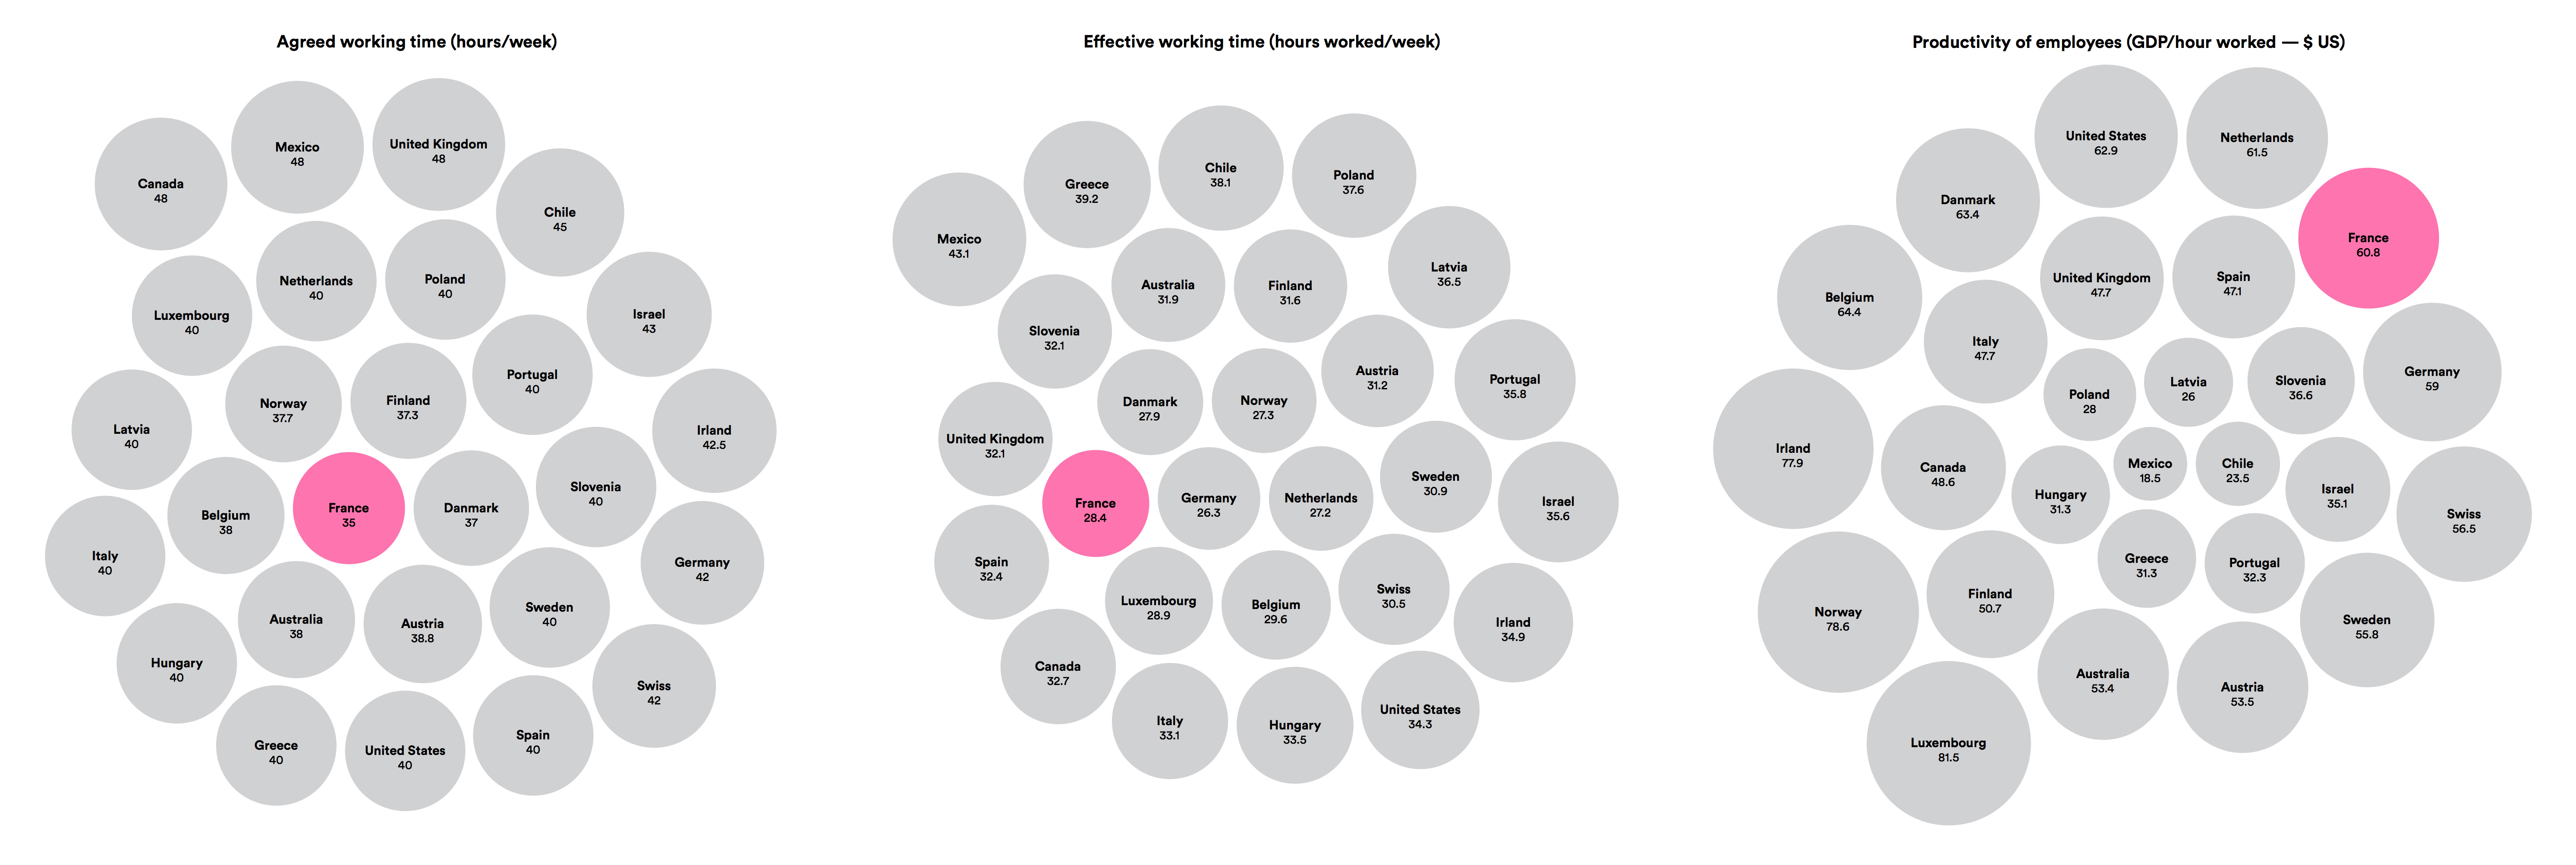
We spend considerable time at work. But we are not all equal in this matter. Indeed, working time vary widely by country. In order to get a better picture of the situation, we (Thomas Bronnec and I) propose to combine three key indicators: the agreed working time (hours/week), the effective working time (hours worked/week), and the productivity of employees (GDP per hour worked—in US dollars). This chart compiles these statistics for 2015 (from the OECD database). One look and you will understand that the very concept of ‘working time’ cannot have the same meaning for all—for the French, the Germans and the Mexicans, for instance. Some people work a lot and earn very little, others work less and earn far more money. Ultimately, if time is always money, the cost of the effort is still marked by great injustice. After the data is collected, I thus began to develop two first charts (for Franceinfo) highlighting on the French situation compared with those of other major countries in the world: a parallel coordinate chart and a bubble chart.
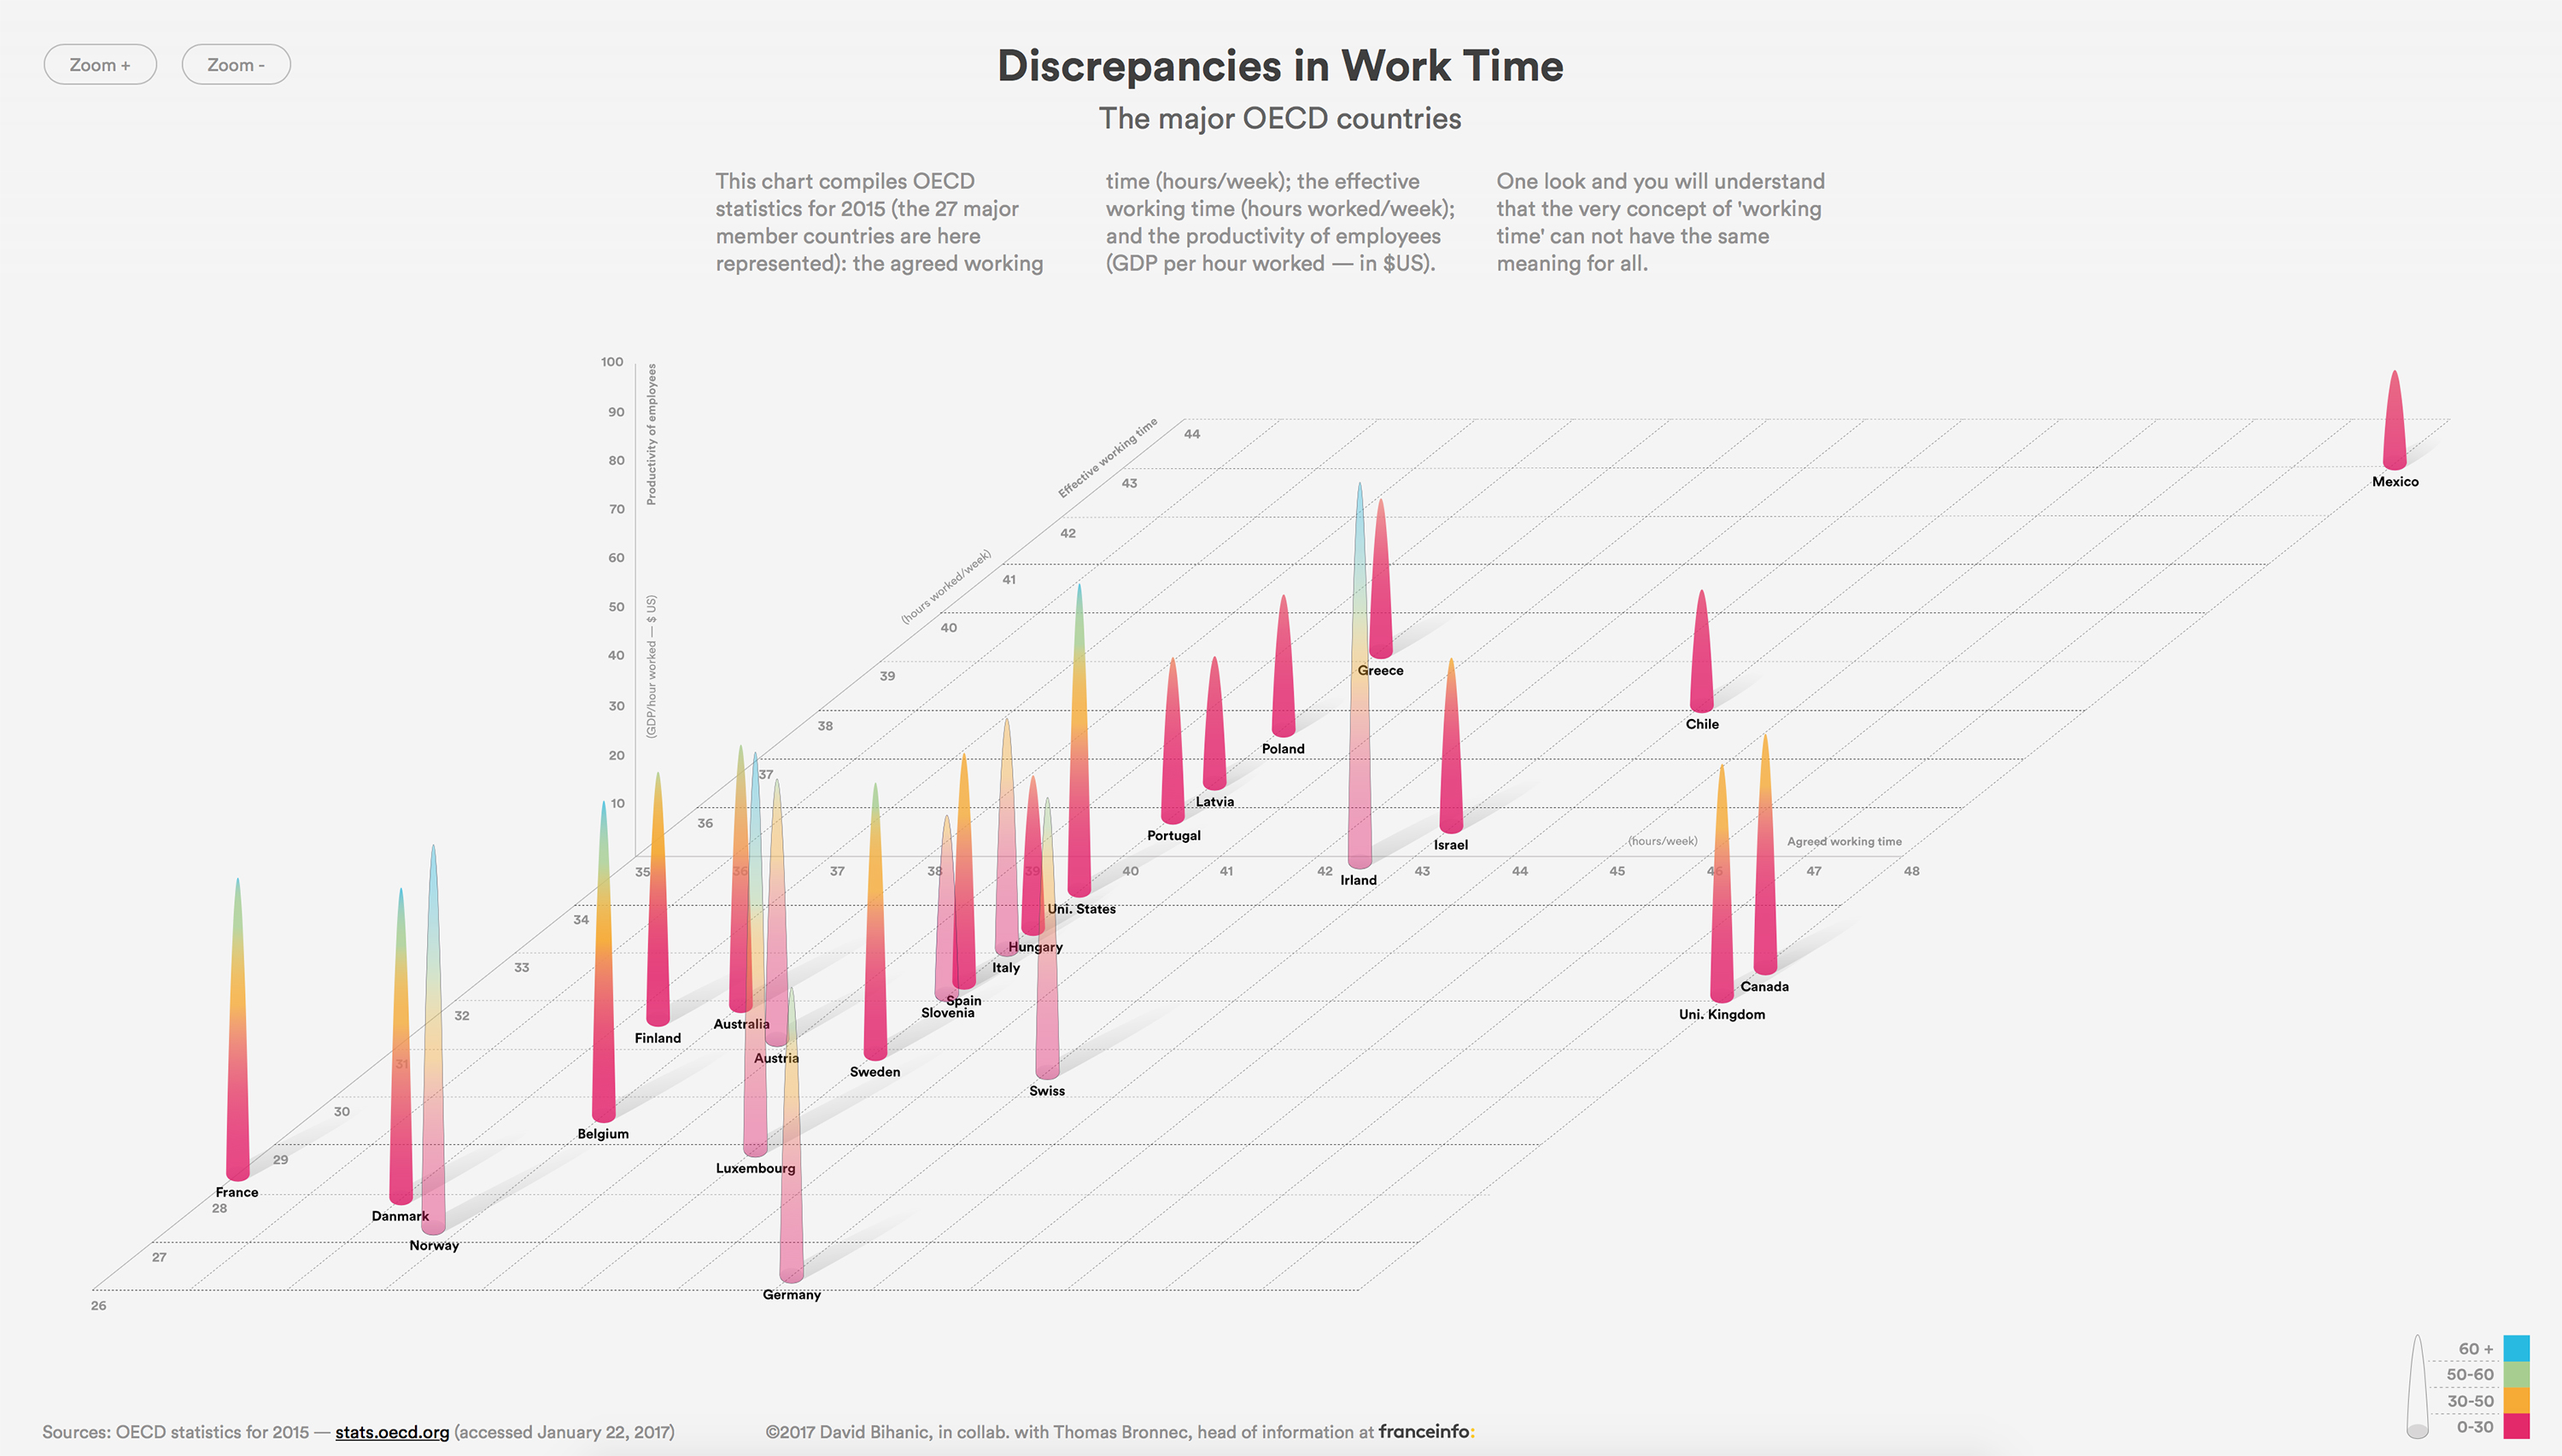
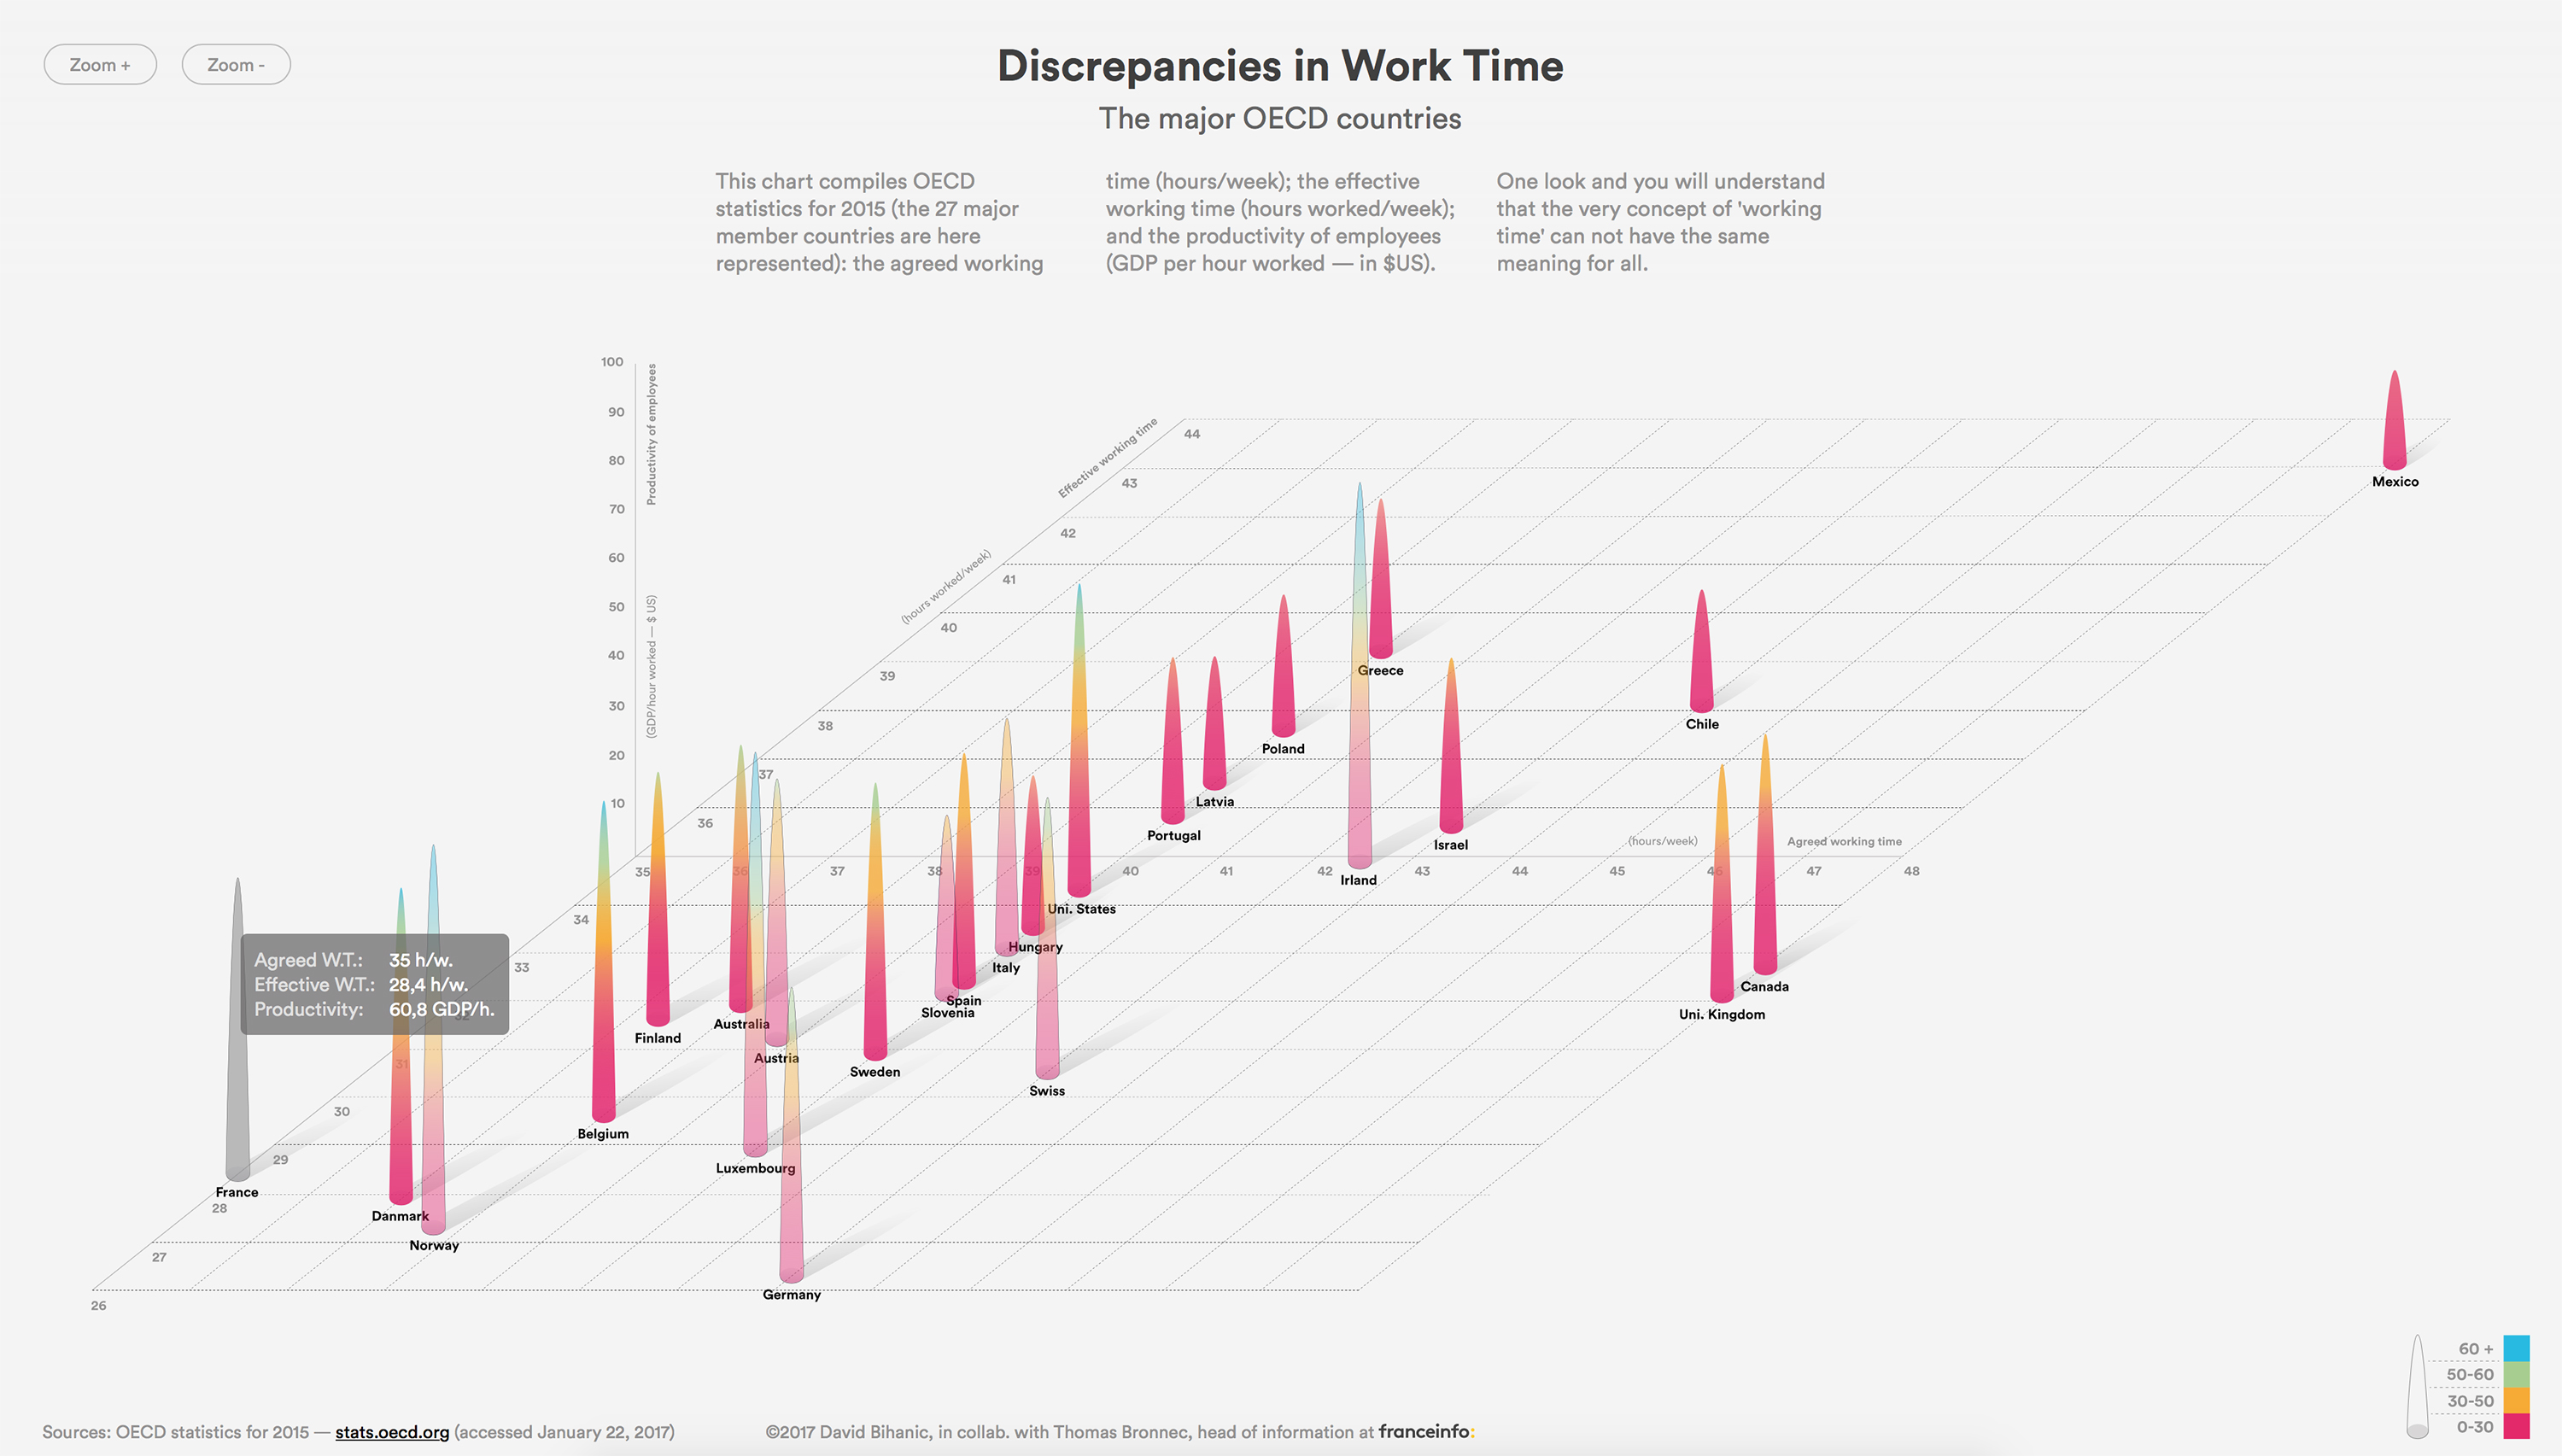
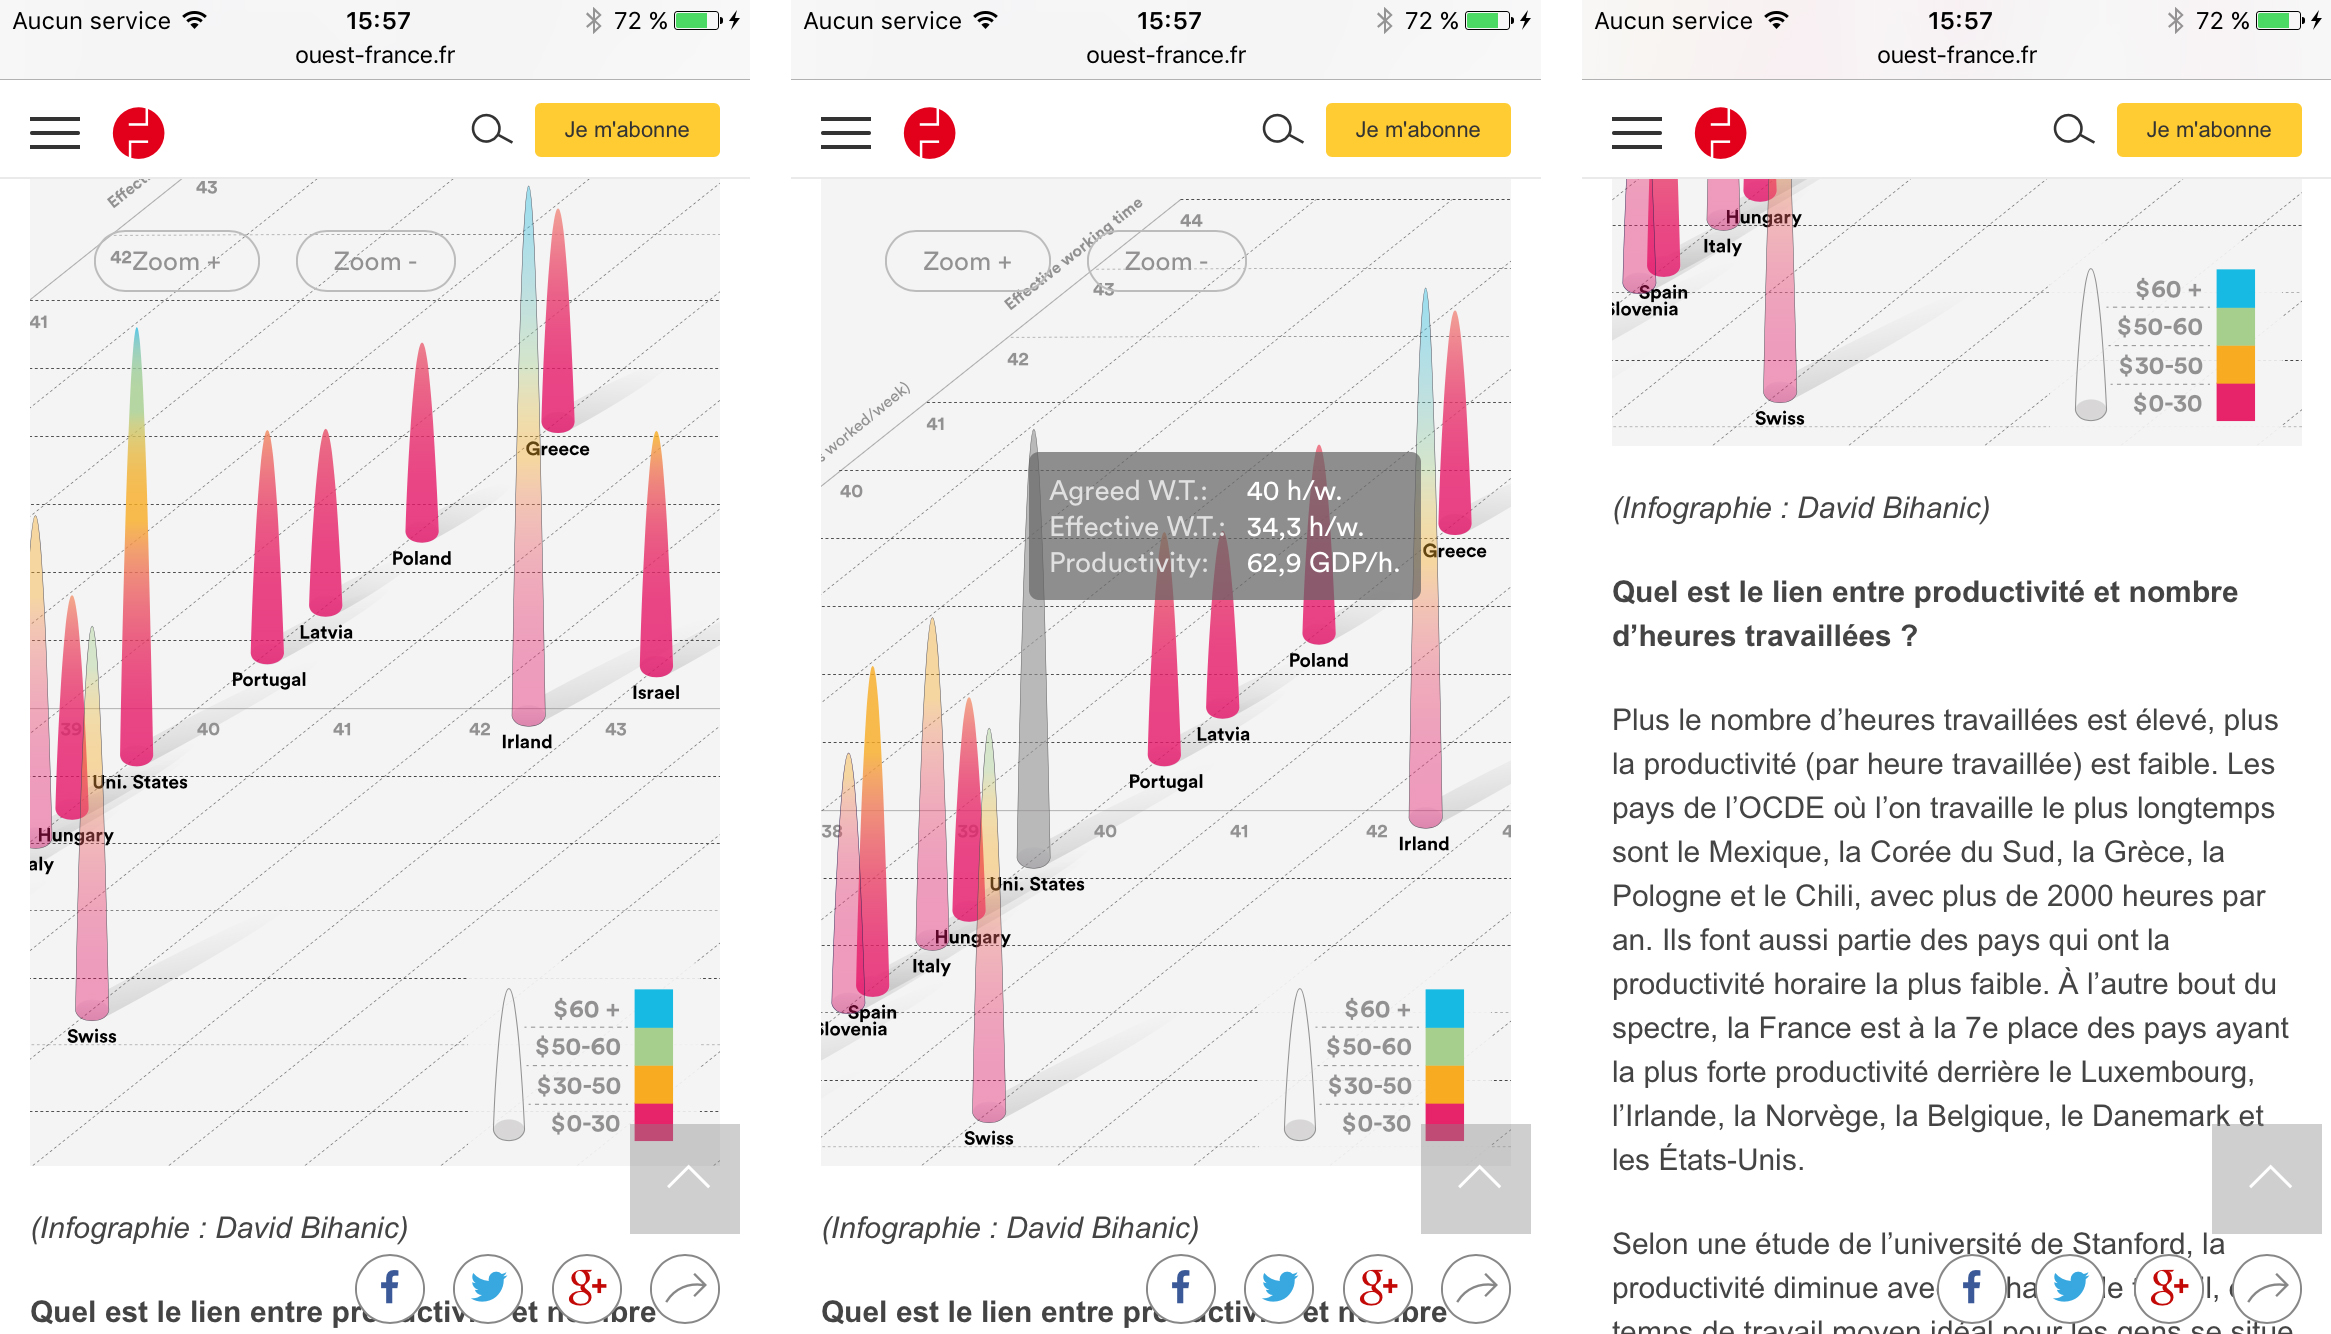
Travailler plus, travailler moins ? L’évolution de la durée légale du temps de travail est un sujet qui engage la controverse, particulièrement en France dans la période électorale actuelle (présidentielle de 2017). En croisant les statistiques publiées par l’OCDE (pour 35 états membres) relatives à la durée conventionnelle moyenne du temps de travail (heures/semaine), à la durée effective moyenne du temps de travail (heures travaillées/semaine) ainsi qu’à la productivité des employés (PIB par heure travaillée—valeurs exprimées en dollars américains), nous constatons que la production de richesse ne découle en rien d’une augmentation du temps de travail. En d’autres mots, le fait de travailler plus n’aurait strictement aucune conséquence sur la hiérarchie économique. Aujourd’hui, les pays les plus laborieux (Grèce, Chili, Mexique) sont de loin les moins productifs. Quant aux pays de la zone OCDE qui consomment le moins de temps au travail, ils en obtiennent majoritairement les revenus les plus élevés (Allemagne, Luxembourg, Belgique, Norvège, Danemark, France). Nous avons réalisé un diagramme offrant de comparer ces données pour les principaux pays de l’OCDE (29 d’entre eux). Celui-ci repose sur un formalisme à 3 dimensions (axes X, Y, Z) reprenant les 3 indicateurs clés : (X) durée conventionnelle moyenne du temps de travail ; (Z) durée effective moyenne du temps de travail ; (Y) productivité des employés ; l’échelle de couleurs proposée permet de rendre immédiatement visible, repérable les pays franchissant notamment le seuil haut de ‘60 dollars et plus’.
Parallel coordinate chart
Click here: …/working_time/pc_chart/
Bubble chart
Click here: …/working_time/bubble_chart/
Then, I embarked on the design of a 3D idiomatic matrix allowing to quickly compare the statistics for all countries. This is the cone chart below—I used D3.js to built these three charts.
Cone chart
Click here: …/working_time/cone_chart/
Screenshots
This work—designed and coded by David Bihanic (2017)—was done in collaboration with Thomas Bronnec, head of information at Franceinfo.
Screencast
Data sources:
Effective working time (hours/week):
OECD (2017), Hours worked (indicator). doi: 10.1787/47be1c78-en (Accessed on 22 January 2017).
OECD (2017), “Hours Worked: Average annual hours actually worked”, OECD Employment and Labour Market Statistics (database).
DOI: http://dx.doi.org/10.1787/data-00303-en (Accessed on 22 January 2017).
Productivity of employees (GDP per hour worked—in US dollars)
OECD (2017), GDP per hour worked (indicator). doi: 10.1787/1439e590-en (Accessed on 22 January 2017).
OECD (2017), “GDP per capita and productivity levels”, OECD Productivity Statistics (database).
DOI: http://dx.doi.org/10.1787/data-00686-en (Accessed on 22 January 2017).
Agreed working time (hours/week):
“France Diplomatie” (French foreign policy—services to to citizens).
Publication:
This visualisation was published by Ouest-France newspaper (rolling news website: http://www.ouest-france.fr):
“INFOGRAPHIE. Présidentielle: les Français travaillent-ils assez ?” by Julie Cateau. (Published April 12 2017 / 10:19):
http://www.ouest-france.fr/elections/presidentielle/infographie-presidentielle-les-francais-travaillent-ils-assez-4910789
This visualisation was published in the May 2017 fifth issue of the ‘Sciences du Design‘ scientific review edited by the ‘Presses Universitaires de France‘.
David Bihanic (2017), « Durée du temps de travail : les principaux pays de l’OCDE » Sciences du Design 2017/1 (n° 5). PUF, Paris, pp. 22-27. URL (Cairn): https://www.cairn.info/…
This chart have been also published and described by journalist of the french scientific news magazine entitled ‘Pour La Science’‘ : « Données à voir : Travailler plus pour ne pas gagner plus », Pour La Sciences (Hors-Série), Août-Septembre 2017, N° 96, pp. 114-115. Available online, URL, http://www.pourlascience.fr/…
To mention: David Bihanic, “Discrepancies in Work Time (the major OECD countries)”, January 2017. Retrieved from davidbihanic.com/worktime