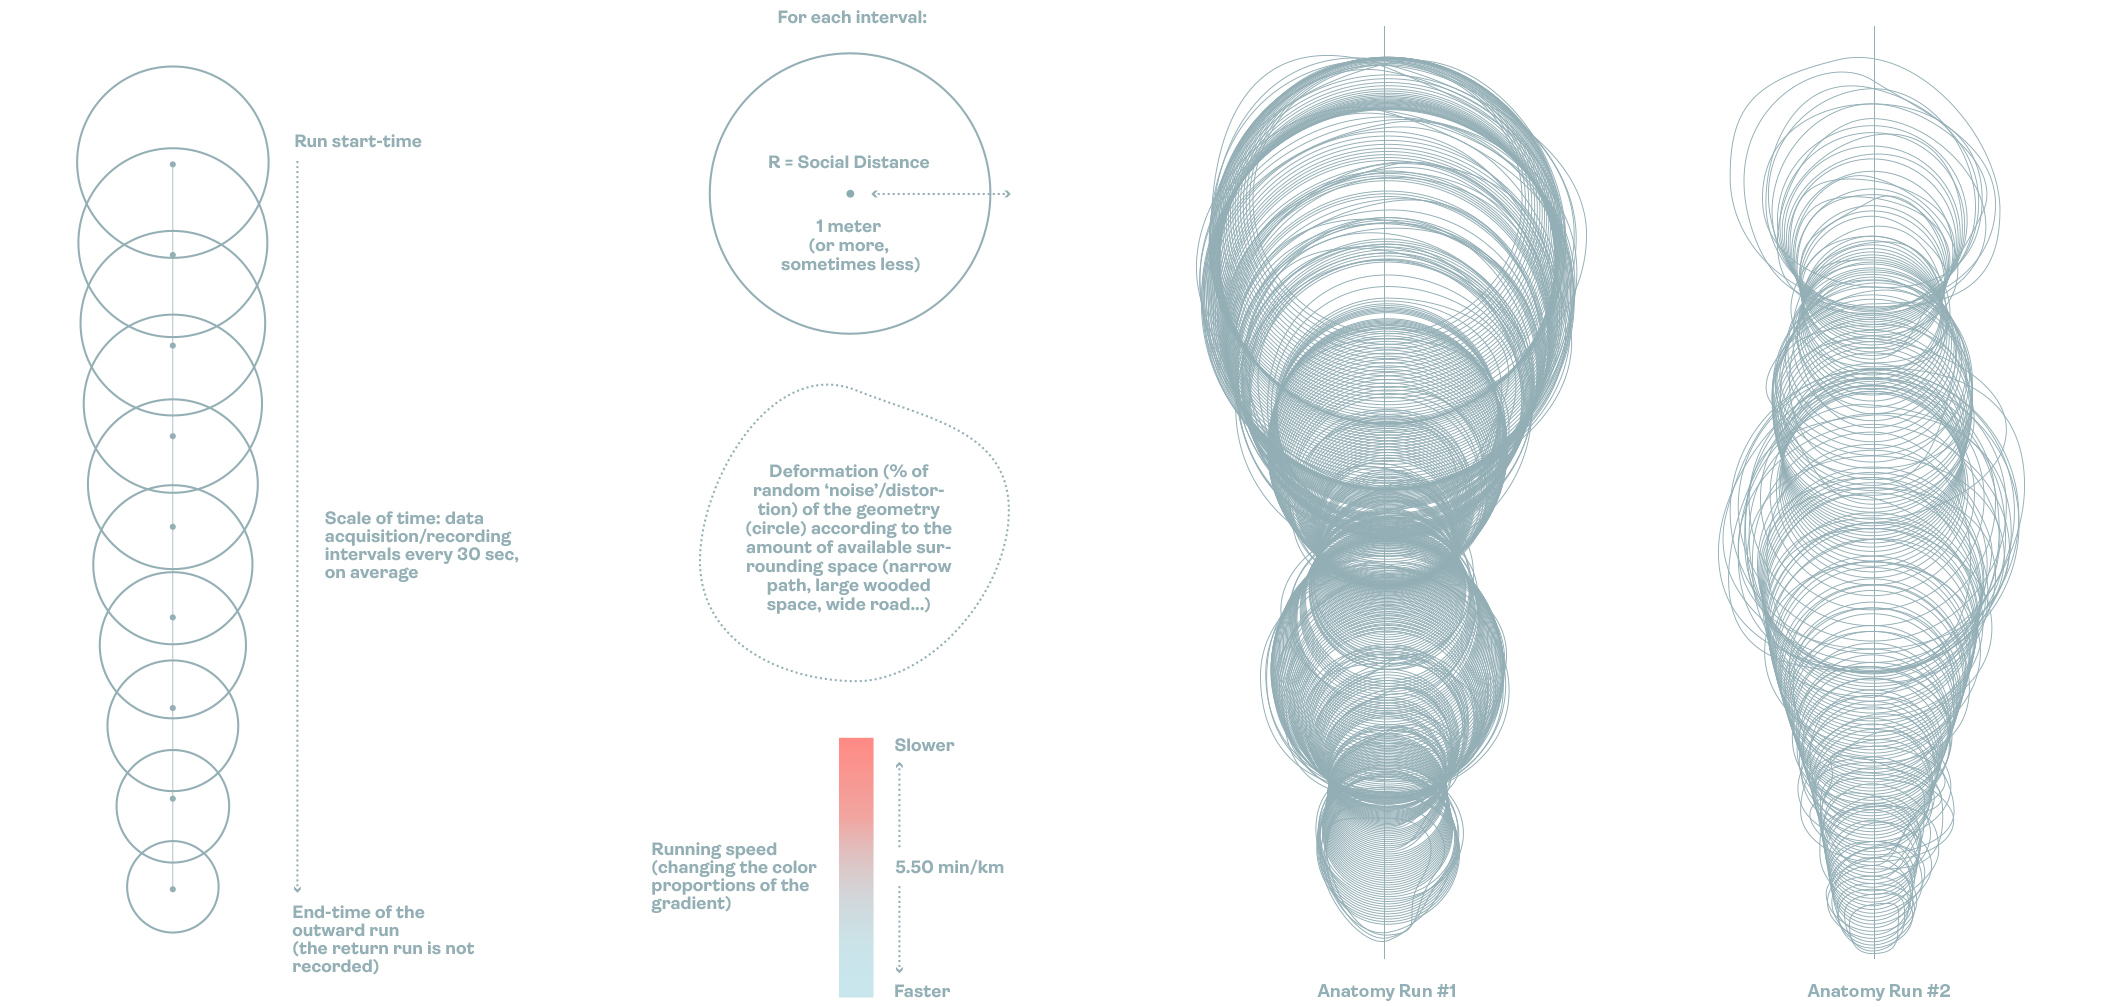
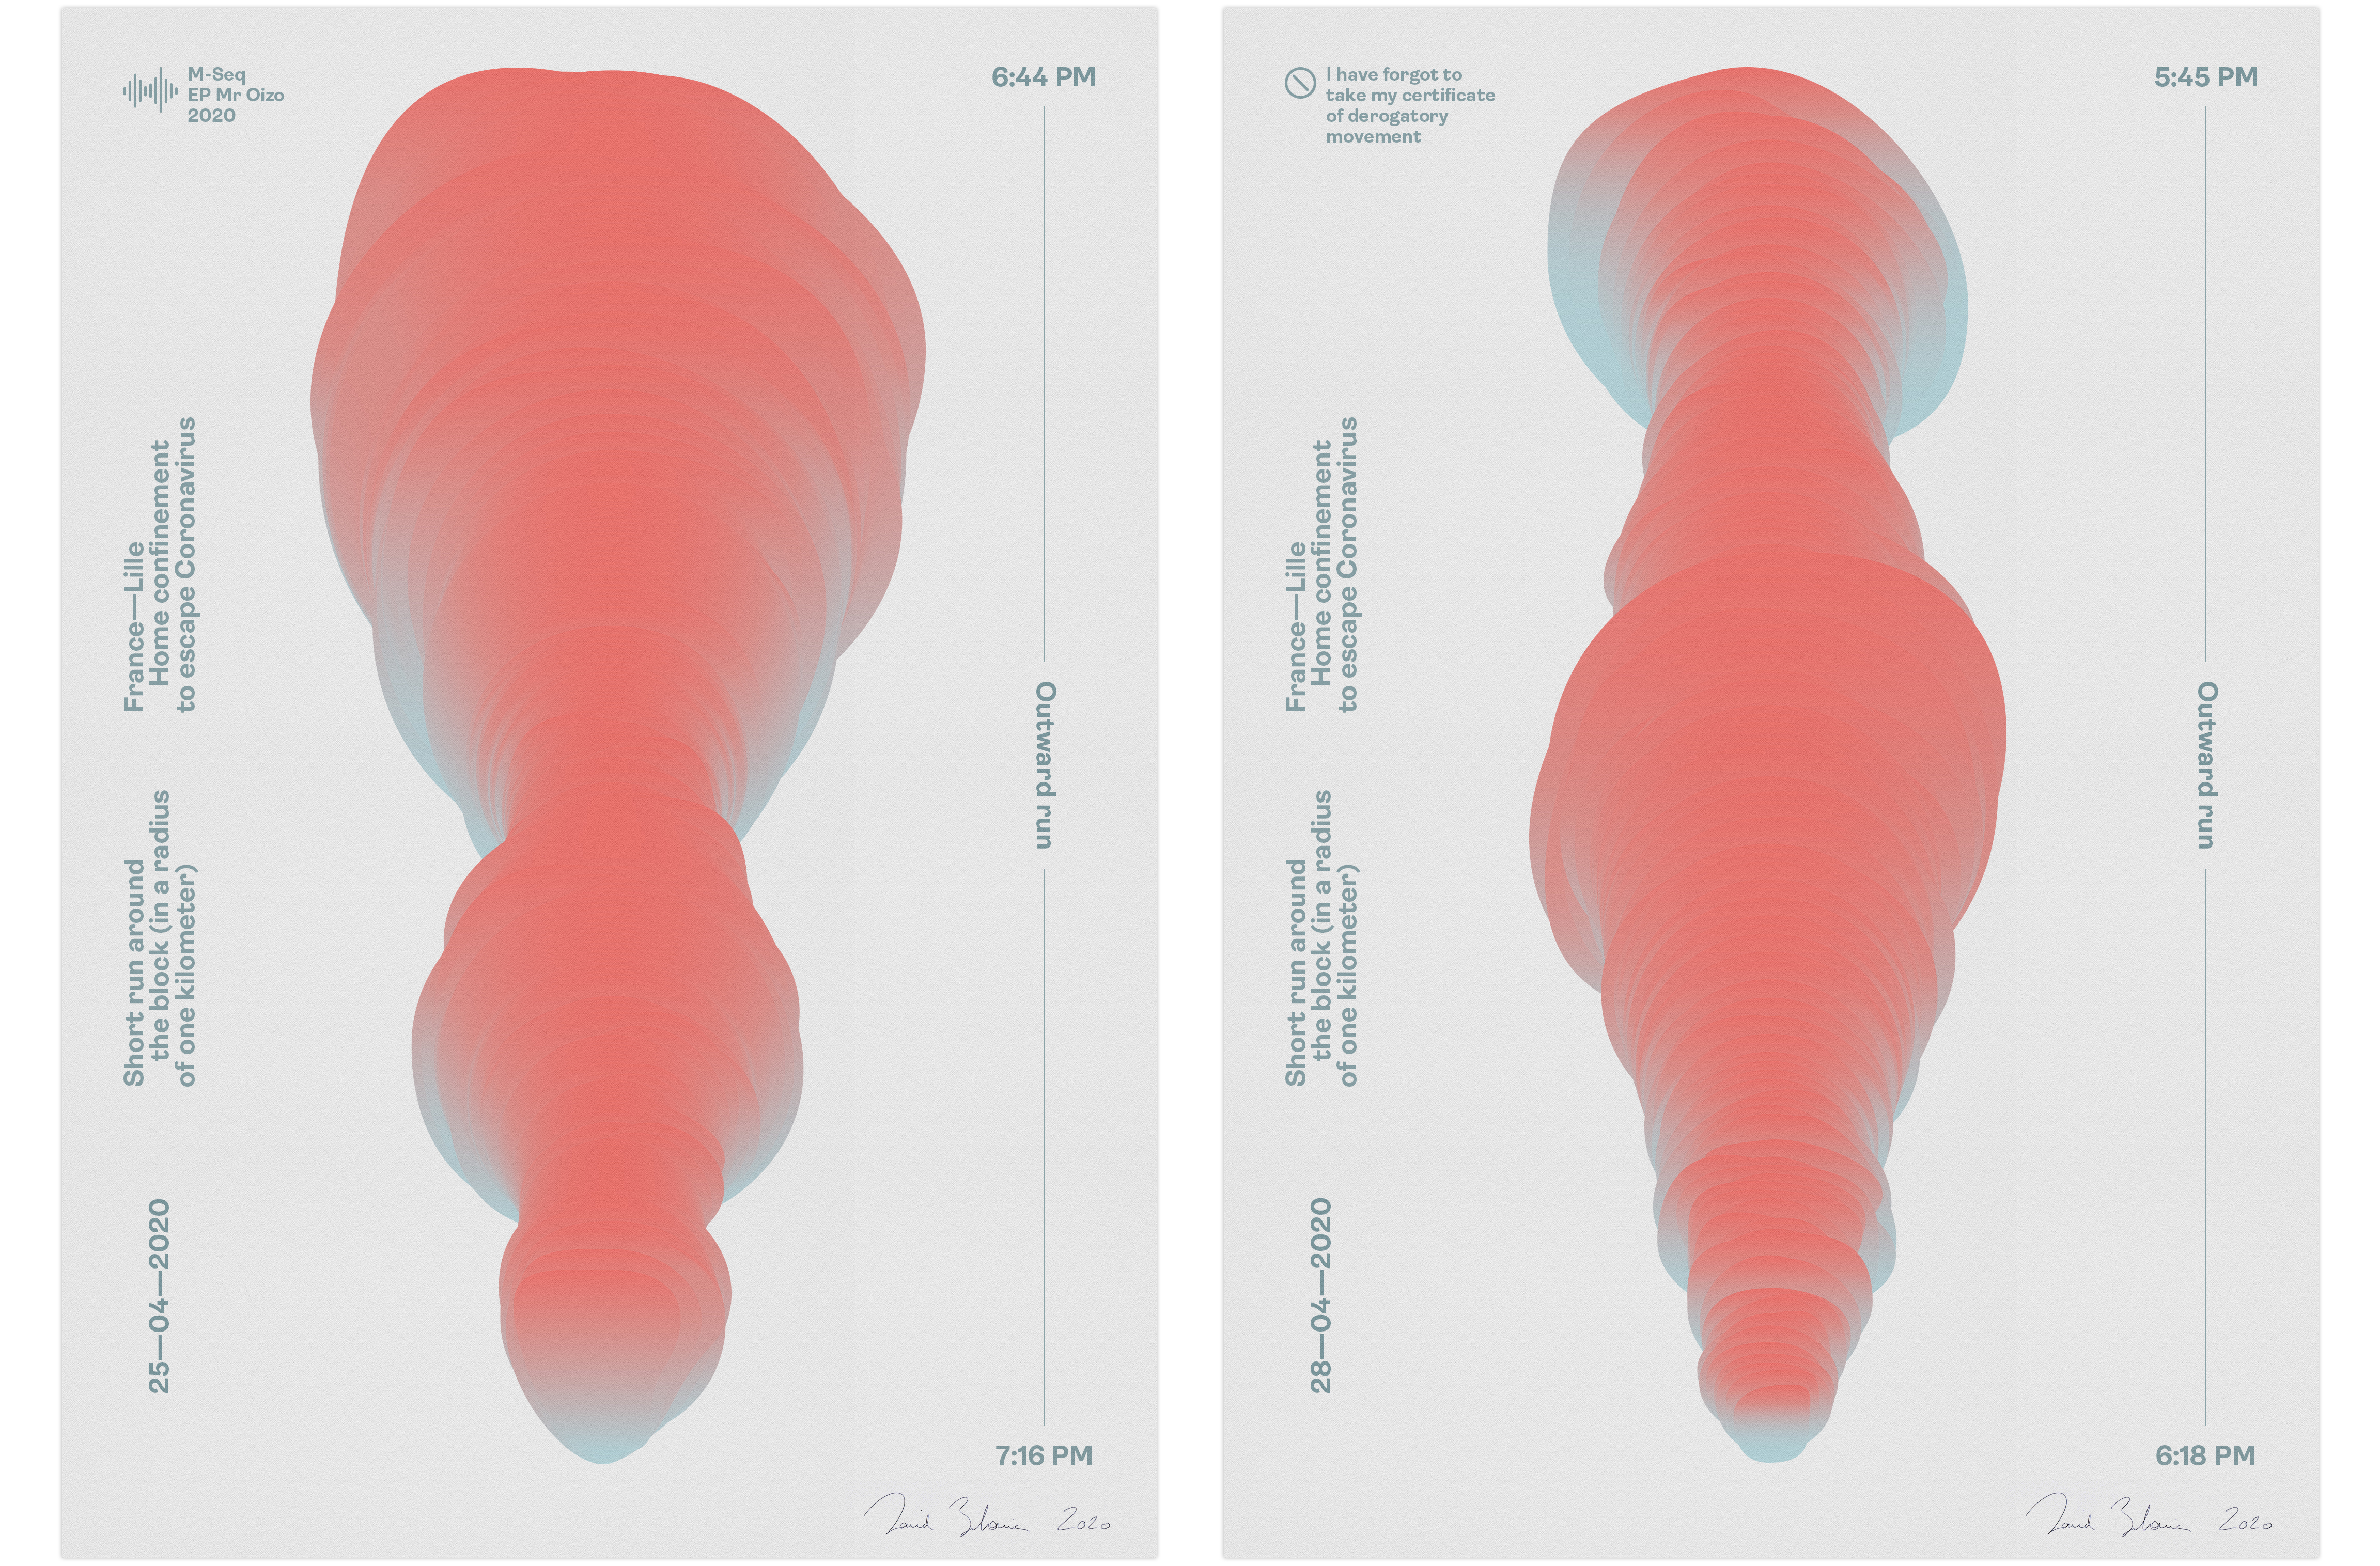
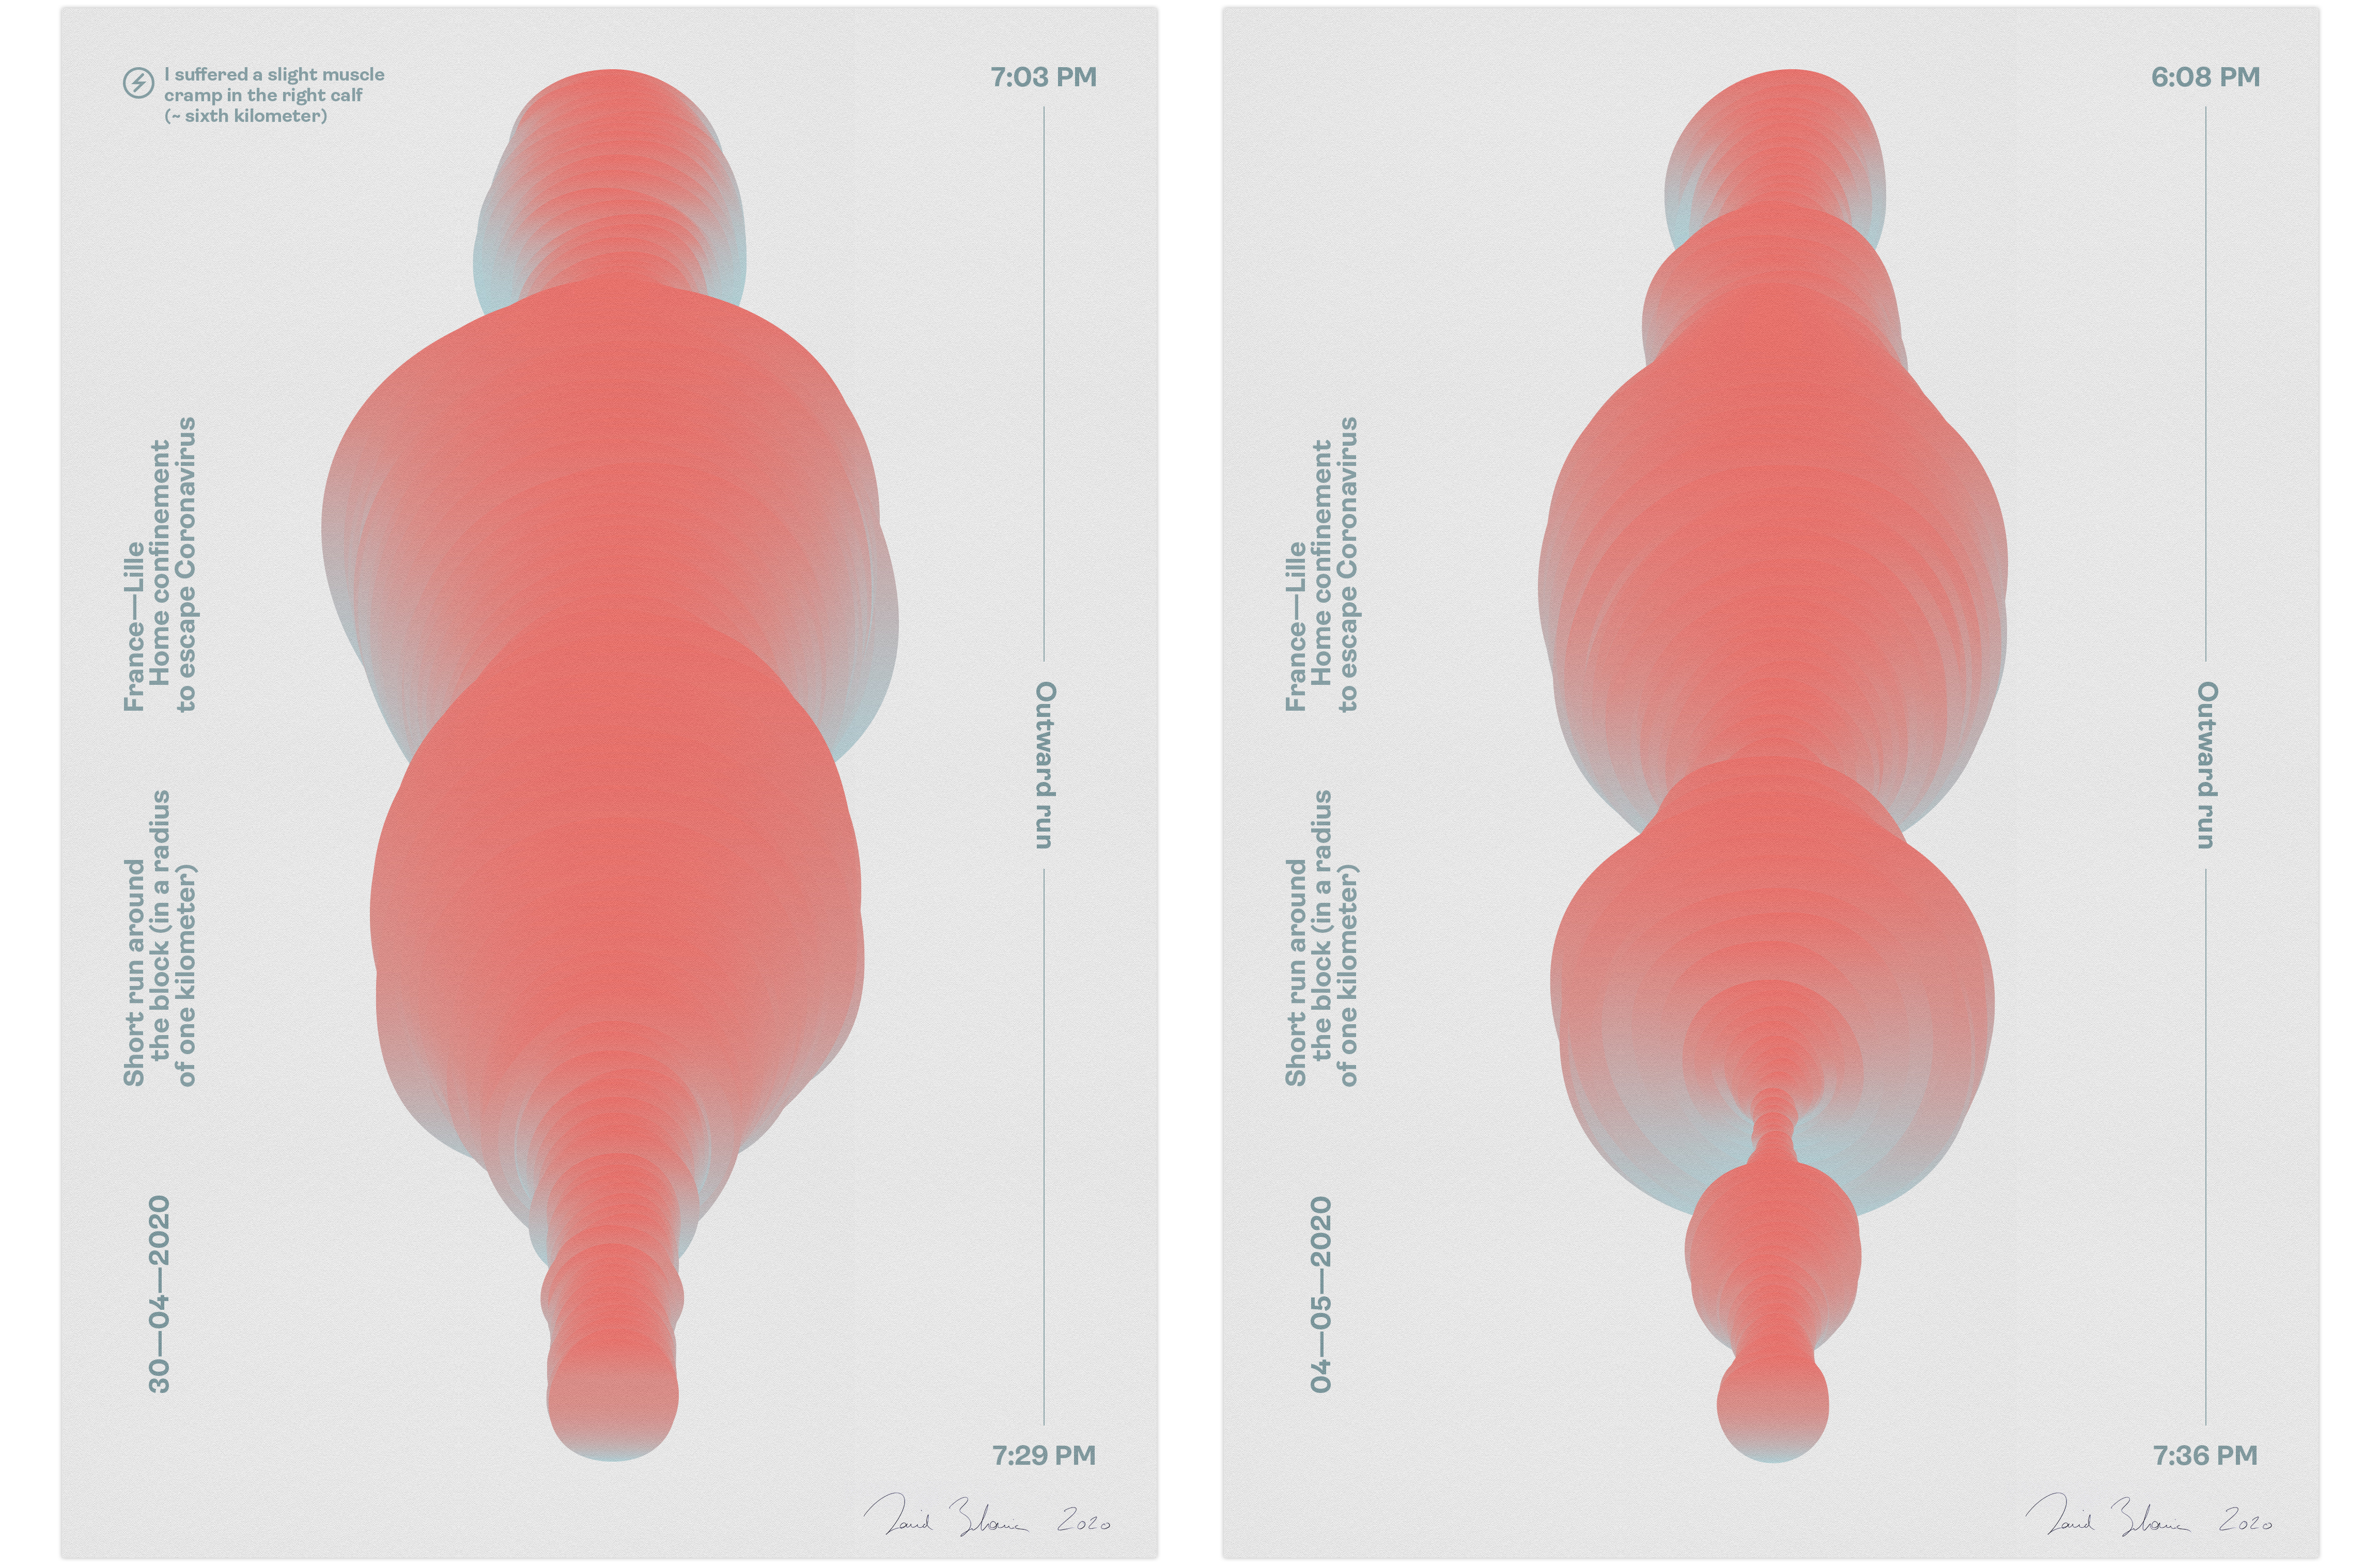
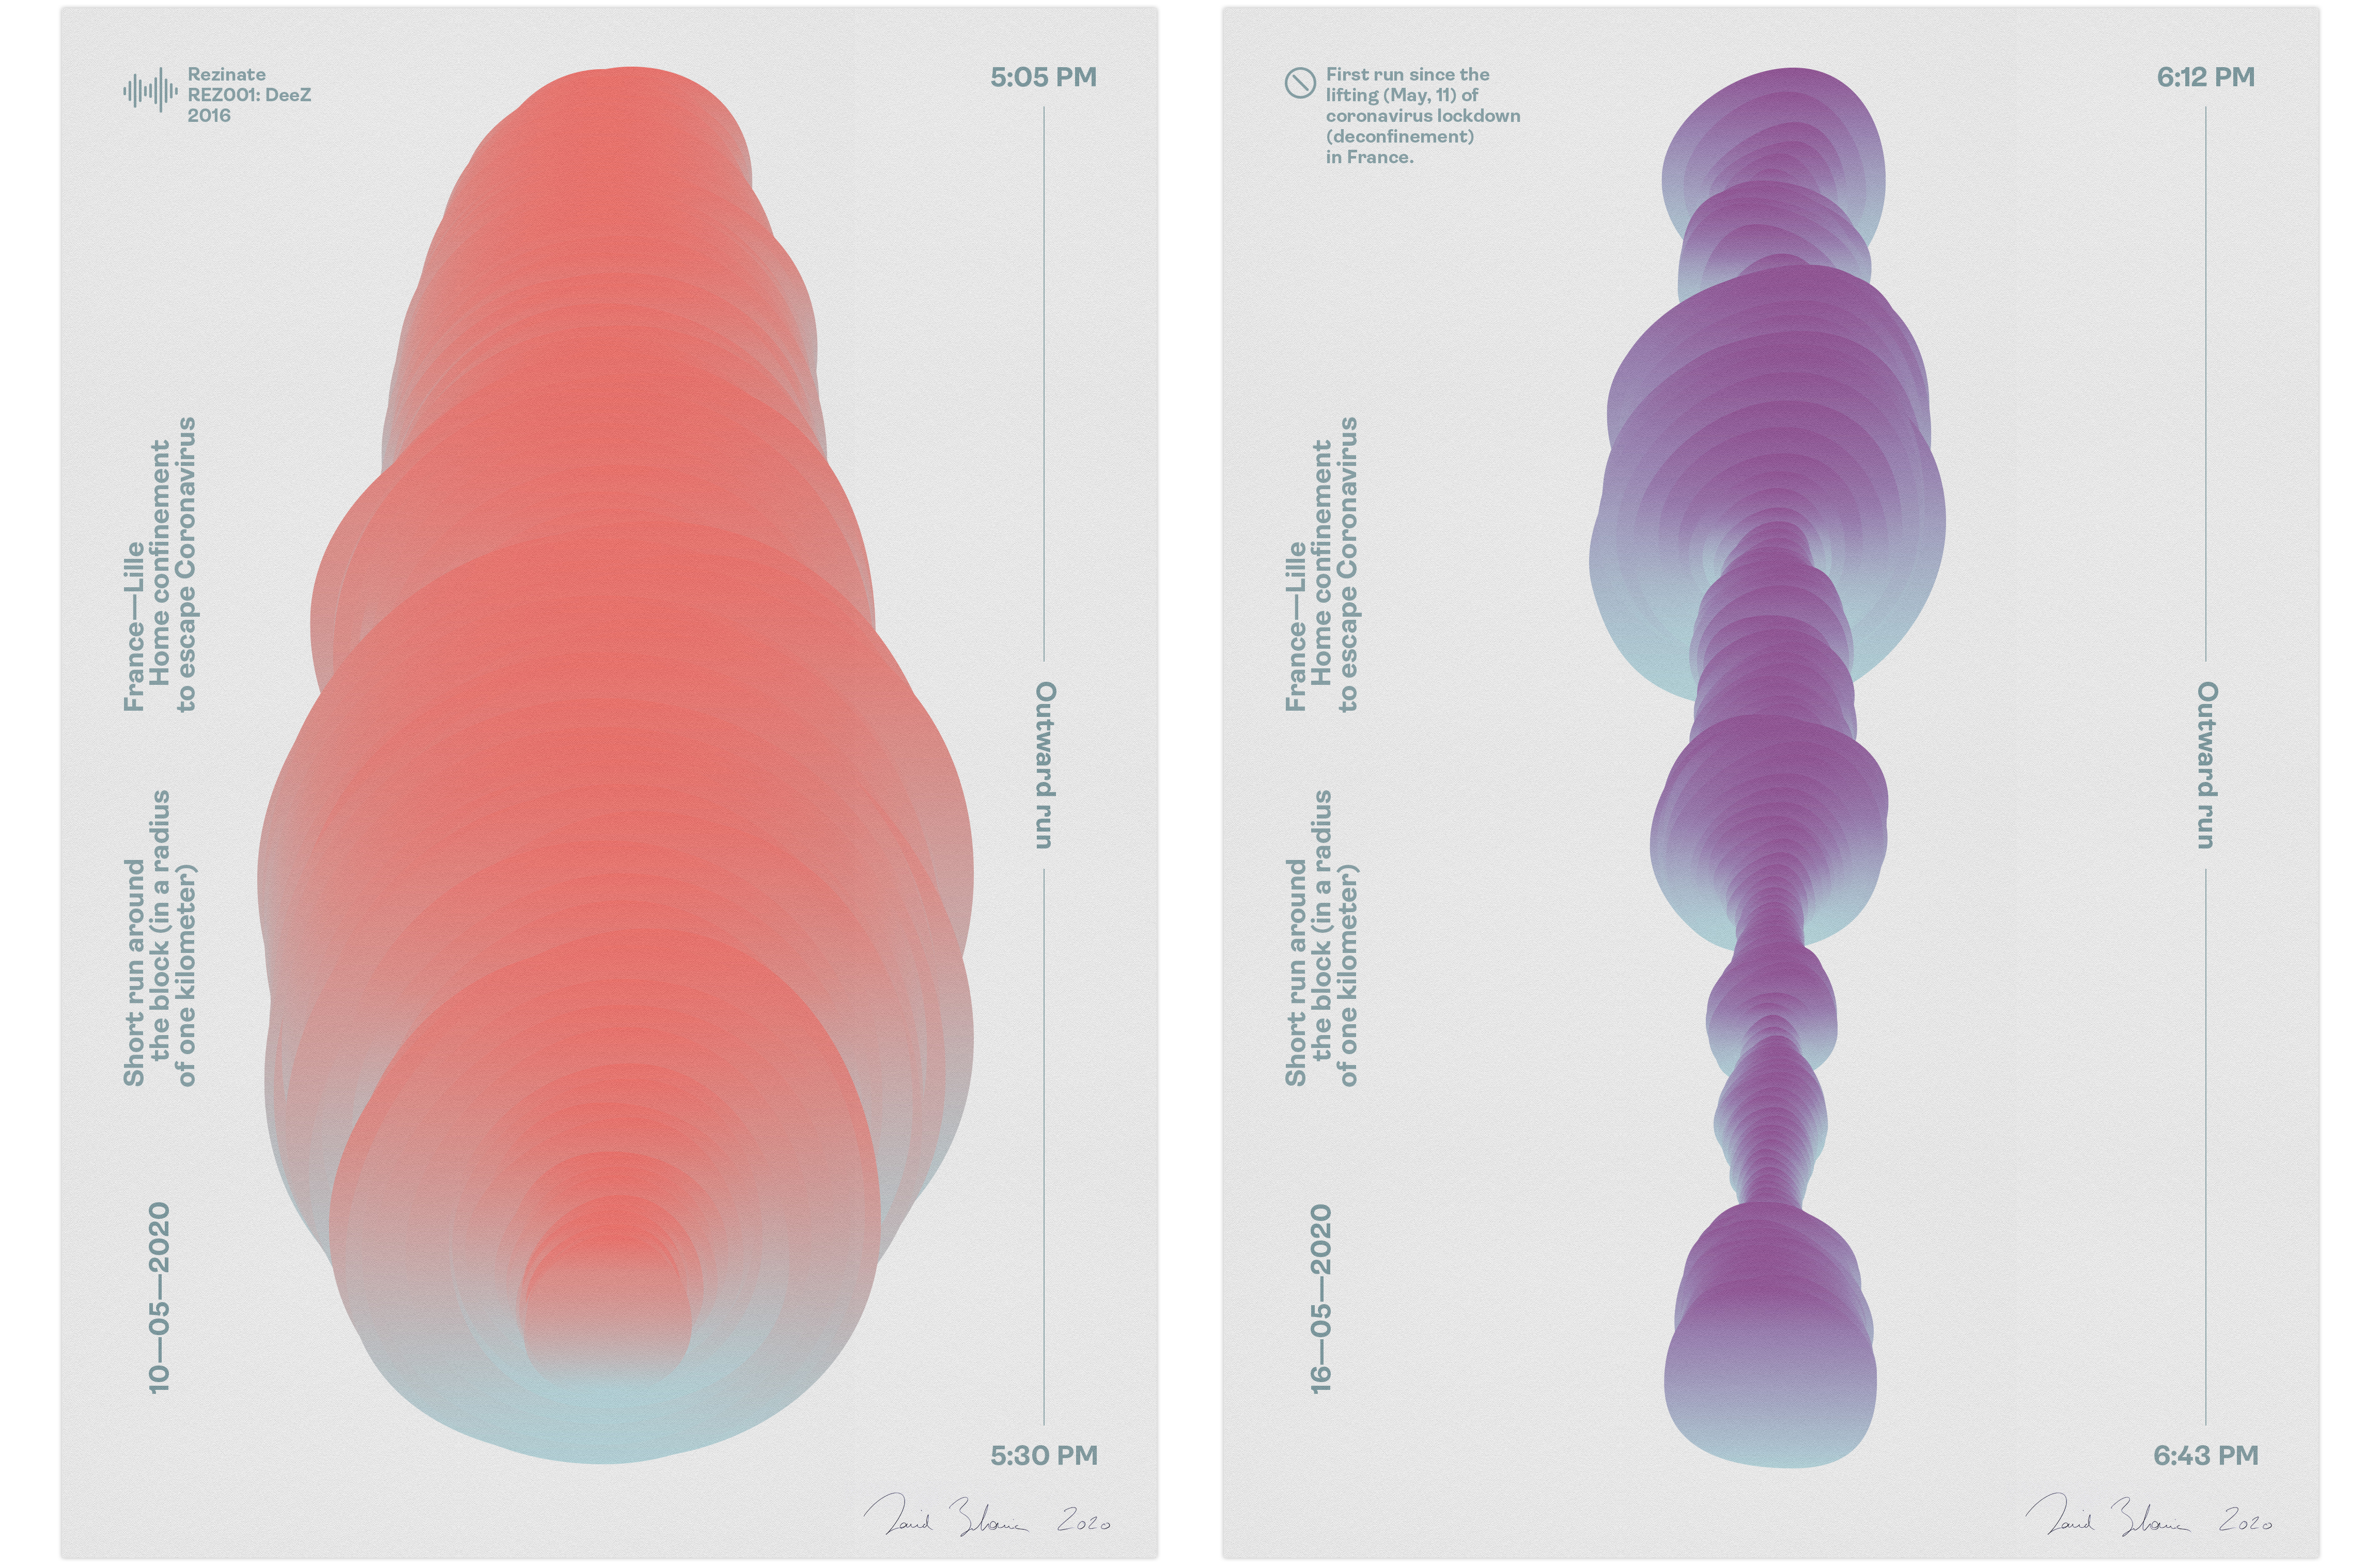
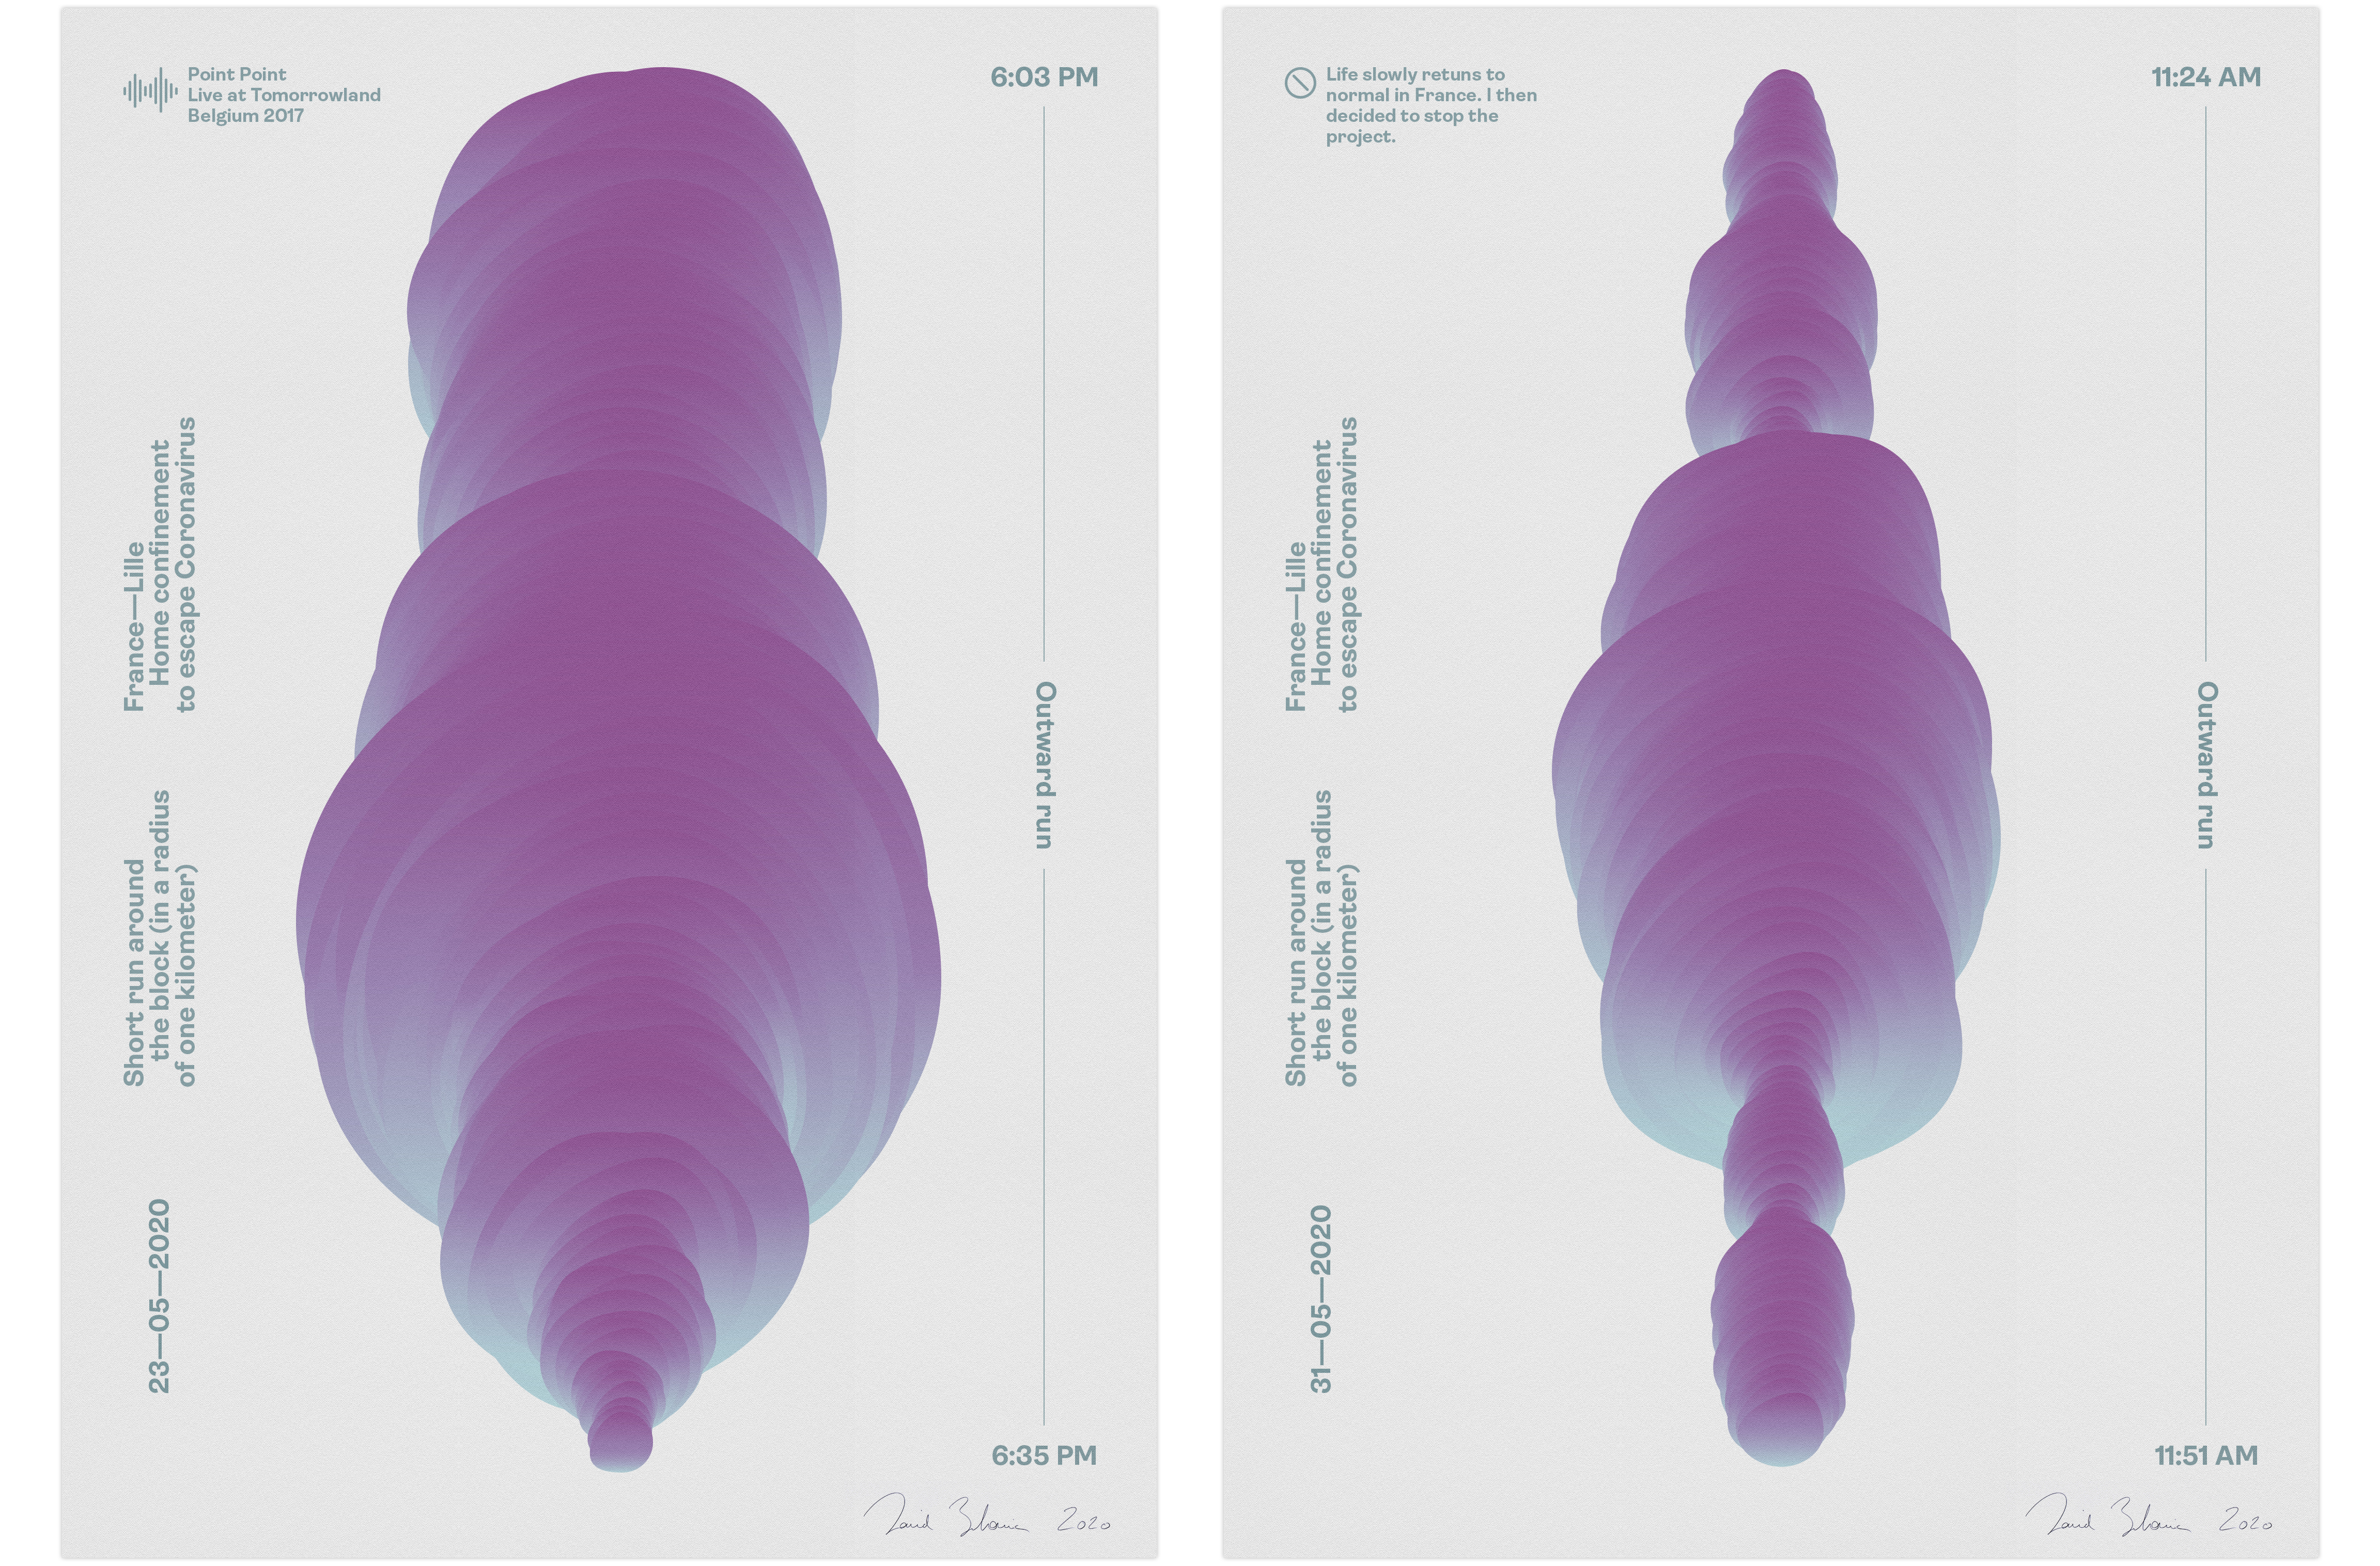
The period of home confinement or self-isolation aimed at reducing the spread of the coronavirus (having started in France on March 17, 2020) compels us, for the maintenance of a healthy lifestyle, following a daily program of physical activity which can include: a brief session of home fitness gym (a gentle fitness routine that offers to stimulate the blood circulation), a brisk walk near the residence accompanied by muscle stretching, a short run around the house (within a limit of one hour per day and within a maximum radius of one kilometer, in accordance with the current regulations)—any activities outside the residential location must be justified by a derogatory exit certificate. For my part, I engaged (since mid-March) in a sportive program of 2 or 3 one-hour runs per week. Then I started (a bit late, on April 25) to produce a series of Quantified-Self tracking infographics or data visualizations of all these sporting outings entitled “Running lines”. Here are the selected data variables: the running time (only the ‘outward’ trip) divided into short time lapses (intervals) of equal length (approximately 30 seconds); at each of them, the physical or social distance (presence of others more or less 1 meter from me), the available space (type of crossing routes: woodland path, public road, etc.), and finally the run speed—Added on the top of each datavis is a key or just distinctive piece of information. Keeping the same gradient colors (its distribution related to the running speed is changing at each interval of time), the result is (for each data representation) an organic-looking volume shape with a rectilinear column (like invisible bones) and variable ‘excrescences’: the “flesh” of each single form is getting thinner or thicker following the physical distance. This composes, more broadly, a visual analogy to the threatened body prey to Covid-19 Infection.
La période de confinement (ou d’isolement à domicile) visant à limiter la propagation du coronavirus (ayant débuté en France le 17 mars 2020) impose à chacun, pour le maintien d’une bonne hygiène de vie, un rythme journalier d’exercices physiques : gymnastique élémentaire (à réaliser de chez soi), marche aux abords du lieu de résidence à cadence relativement rapide accompagnée d’étirements musculaires, course à pied dans un rayon maximal d’un kilomètre et d’une durée n’excédant pas une heure—toute ‘échappée’ du domicile, même proche ou brève (en deçà d’une heure), devant être justifiée d’une attestation de sortie dérogatoire. Pour ma part, j’ai suivi depuis la mi-mars un planning de 2 à 3 courses à pied par semaine d’une durée d’une heure environ. J’ai entrepris sur le tard (soit à compter du 25 avril) de produire des représentations graphiques de données (à ranger dans la catégorie « mesure de soi », « quantified self » en anglais) ici relatives à chacune de ces sorties sportives lesquelles intégrant les variables suivantes : temps de trajet ‘aller’ décomposé en intervalles d’environ 30 secondes ; puis à chaque intervalle, la distance physique ou sociale (présence d’autrui à plus ou moins 1 mètre de moi), l’espace disponible (type de voie traversée : chemin, sentier, route, etc.) et enfin la vitesse de course. S’ajoute, en annexe, une mention informationnelle contextuelle relevant un point ou fait marquant, disons distinctif par course. Conservant les mêmes couleurs de dégradé (sa répartition ou distribution changeant en fonction de la vitesse de course), il en résulte, pour chacune des représentations, un volume visuo-graphique (d’apparence organique) à colonne rectiligne (tel des os invisibles) et à expansion variable : la « chaire » de la forme s’épaississant ou se réduisant suivant la distance physique, sociale ; une analogie faite ici au corps (et plus largement au vivant) menacé ou en proie à l’infection de Covid-19.
Below is the line graph legend:
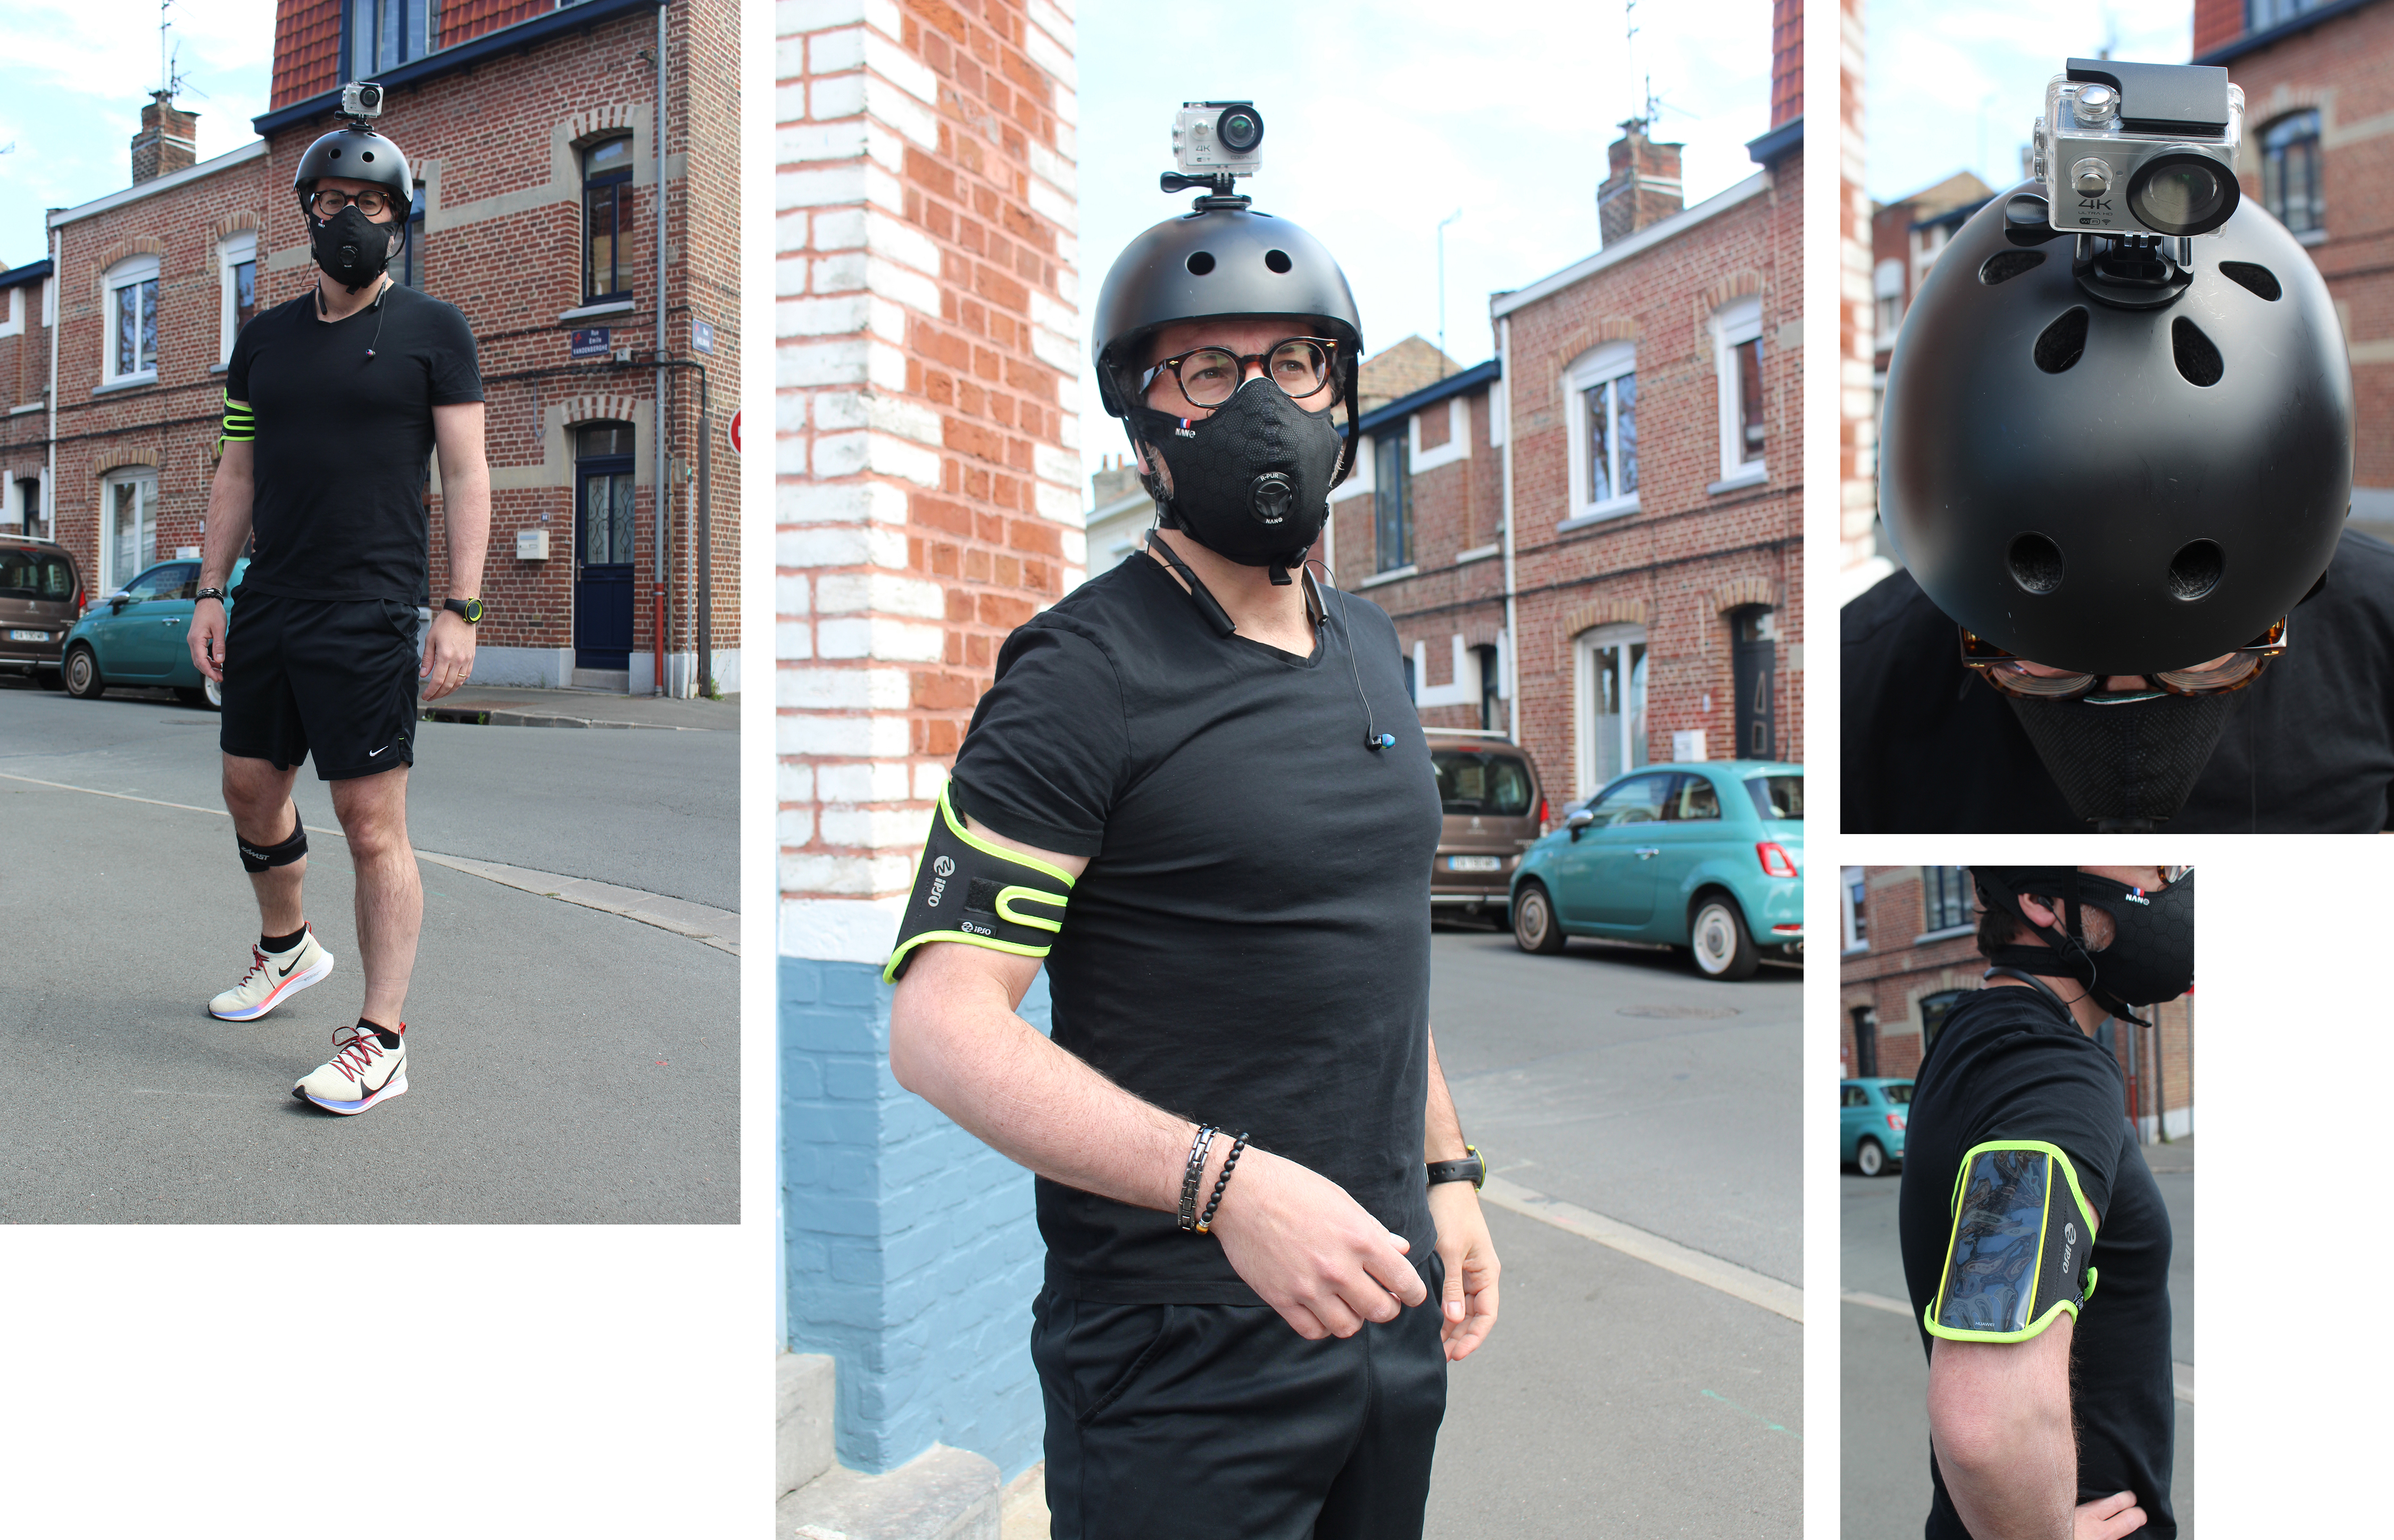
All the data I need is extracted from the mobile application Nike+ I used to use, except for the information about social distancing. To gather these missing data, and because I cannot have access to professional telemetering solution (like the LiDAR technology), I have experimeted alternative ways. First, I diverted the use of the 360° sport camera XD Design in order to capture the video presence of others around me; this camera is fixed on a helmet I wear during each run. The 360° viewpoint was not appeared really useful, and relevant in movement for many reasons (causing moreover marked distortion of images). So I decided to use a simpler mini-camera with a standard lens: the COOAU 4K 20MP cam with a large angles of 170°; I also activated the sound recording. This data is entered manually (every ~10 seconds) for each run in a spreadsheet when reviewing the video.
Images
This project was designed and coded by David Bihanic (2020).
To mention: David Bihanic, “Running lines”, April-May 2020.